


Warranty Reserve Levels:
Most large companies seem to pick a size and stick to it, even as sales and claims vary. Whether measured in dollars or as a multiple of claims paid per month, the size of most of the largest warranty reserves has changed very slowly over the past four years.
The problem with external examinations of warranty reserve levels is the lack of claims and accrual data per product line. What can be measured externally is merely an averaging of all product lines and all warranty periods, unlike the internal methodology explained by Greg Spraker in the Jan. 23 issue of Warranty Week.
Still, it appears that most major manufacturers are quite on top of their warranty reserve funds, managing them so they closely track actual claims paid and so they always contain enough money to pay expected future claims. In other words, that boilerplate language they always insert into their financial statements about closely monitoring payments and constantly adjusting levels is probably more or less what they actually do.
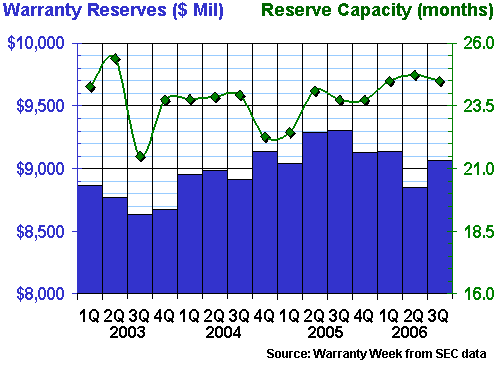
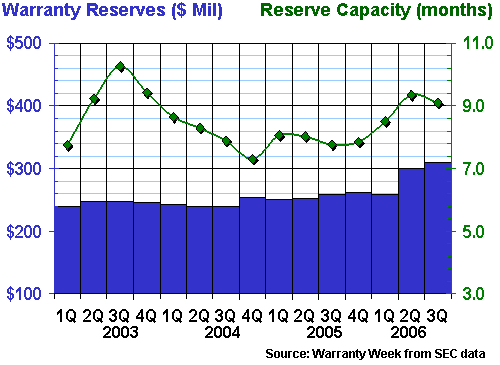
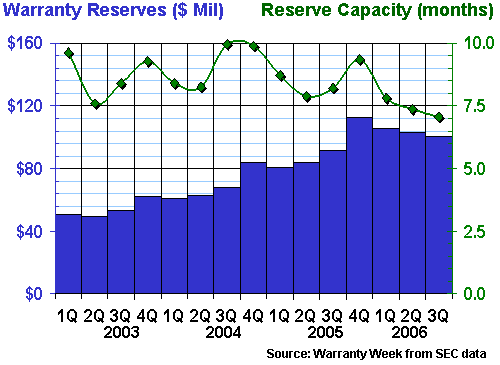
Let's begin by looking at the warranty reserves of all manufacturers taken together. As of the end of September 2006, we had recorded warranty reserves held by some 645 U.S.-based manufacturers totaling some $39.036 billion, which was marginally below the $39.12 billion balance recorded as of June 30, 2006.
We don't know what caused the decline. For companies which have yet to report their latest financials, such as Dell, Navistar, and Delphi, we have inserted place-saving estimates which keep their warranty reserve levels more or less constant. For acquisitions, the buyer should have merged the acquired balance with their own. As companies file their fourth quarter and year-end reports with the U.S. Securities and Exchange Commission, the totals may still change, but for now we've detected a slight decline.
Figure 1
All US Manufacturers
Warranty Reserves, 2003 to 2006
($ Mil and Months of Capacity)

There are two measurements of warranty reserves included in Figure 1. The columns in blue depict the total value of all 645 warranty reserves combined, in billions of U.S. dollars. The amount of dollars held in reserve is counted on the left-hand scale. The line in green depicts the warranty reserves as a multiple of claims paid per month, and is measured in months on the right-hand scale. And since the amount of claims paid in September 2006 was around $2,356,000, the amount held in reserves was equal to 16.57 months.
In other words, if all manufacturers immediately ceased adding funds to their warranty reserve funds, and if claims paid remained constant, the warranty reserves would last an additional 16.57 months. This doesn't mean they'll soon cease accruals, however. All it means is that their current capacity to pay claims stands at a little over 16-1/2 months.
Trend Towards Shorter Warranties?
Another way of interpreting this measurement would be to say that the average warranty for U.S.-made products is now 16-1/2 months, if one subscribes to the belief that at the time a product is sold all manufacturers immediately and accurately accrue the full amount they expect to pay out in claims over the life of the product. And if one believes this theory, then the data in Figure 1 suggests that warranties have been slowly getting shorter over the past four years. Conversely, warranties were never longer than they were at the beginning of 2003.
There is another explanation: in the past, manufacturers always erred on the high side when making accruals and establishing warranty reserve levels. But as they began to better understand the process and were able to compare themselves to close competitors using public data, they began to reduce the margin of error and more accurately accrue for the future cost of warranty. In other words, perhaps the typical warranty was always 16-1/2 months, but only recently have manufacturers allowed their reserves to fall to that level.
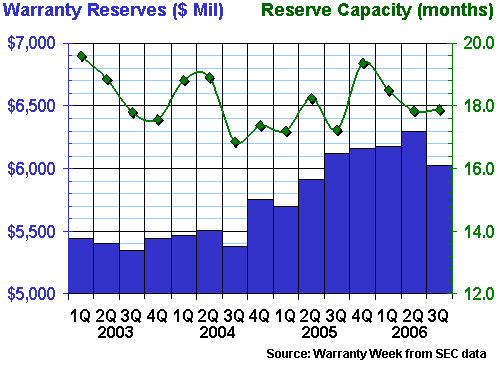
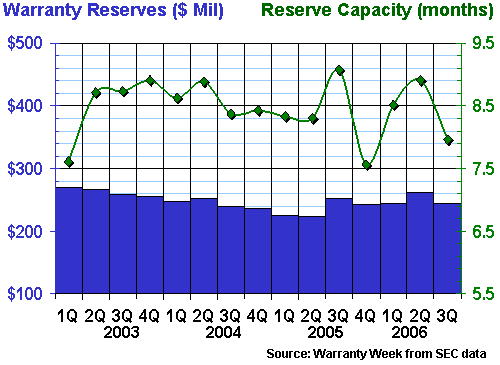
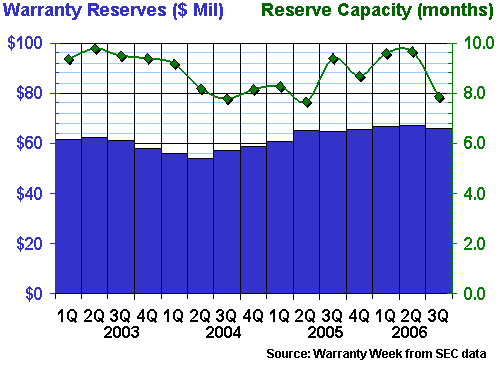
General Motors is not only the largest U.S.-based warranty provider but also one of the biggest warranty stories of 2006. In Figure 2, we're graphically presenting two important facts about GM: its warranty reserve fund balance peaked a year ago at $9.3 billion, and its capacity to pay claims has risen throughout 2006 despite a falling balance. What this means, of course, is that the amount GM pays out per month is falling faster than the amount it keeps in the fund. While in the third quarter of 2005 it had a capacity to pay claims for 23.7 months, in the third quarter of 2006 its reserves would last for 24.5 months.
Figure 2
General Motors Corp.
Warranty Reserves, 2003 to 2006
($ Mil and Months of Capacity)
The truth is, however, that although the scale used in Figure 2 has been manipulated in a way that magnifies small changes, GM's warranty reserve capacity has remained between 23.5 and 25 months for all but two of the past 15 quarters. That is a remarkably stable record, especially since all the while GM has been reducing its warranty claims paid.
Whenever possible, we'll continue exaggerating the vertical scale in Figures 3 through 14. But suffice it to say that all of the following companies were selected to illustrate how most major manufacturers are able to keep the ratio between what they pay out and what they put aside as constant as possible.
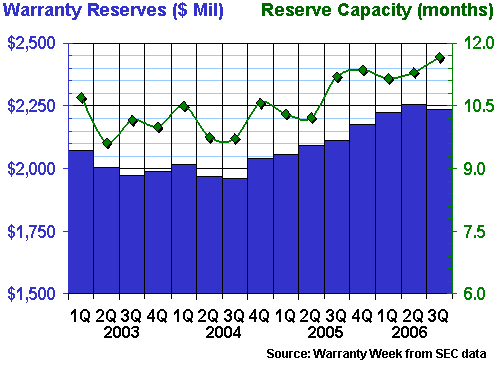
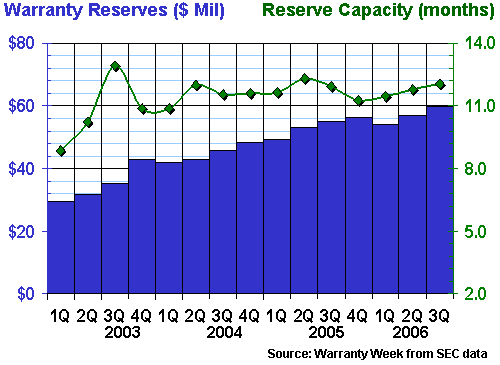
Warranty Stability at Ford
Ford Motor Co., for instance, has kept its warranty reserve fund balance between 16.8 and 19.6 months for the past four years, and is currently right in the middle of that range despite its recent well-publicized financial woes. Figure 3 is an example of a company that has kept its warranty reserves remarkably stable, despite the effects of rising claims, falling sales, and increasing reserve fund balances.
Figure 3
Ford Motor Co.
Warranty Reserves, 2003 to 2006
($ Mil and Months of Capacity)
In other words, Ford has maintained reserve stability despite having numerous excuses for not doing so. Interestingly, its warranty reserve fund total also is now below its peak, although that peak came more recently than GM's. Ford's reserve fund size peaked in June 2006 at just under $6.3 billion. Its capacity to pay claims, however, peaked way back in early 2003 at 19.6 months.
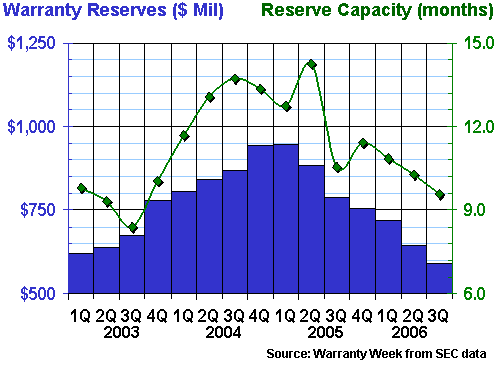
Hewlett-Packard is successfully trimming its warranty claims costs, as Warranty Week has noted numerous times over the past year. But what it hasn't done is to slow down accruals to the point that the warranty reserve fund ceases to expand in size. As Figure 4 illustrates, HP has allowed the reserve to grow in size during seven of the last eight quarters. And in terms of capacity, the trend has also been upwards since 2004.
Figure 4
Hewlett-Packard Co.
Warranty Reserves, 2003 to 2006
($ Mil and Months of Capacity)
Both HP's claims and accruals as a percentage of sales have been falling for multiple years. But as Figure 4 shows, this hasn't prevented the warranty reserve from growing in terms of both size and capacity to pay. Again, the vertical scale has been exaggerated to better show changes. But in HP's case, the changes have been primarily in the upwards direction.
Figure 5 illustrates what IBM was able to do after its spin-off of the personal computer division to Lenovo. Its warranty reserve fund peaked in size in early 2005 at $946 million. And its capacity to pay peaked a few months later at 14.3 months. The reserve has now contracted by almost 38% from its peak, and IBM now maintains only enough reserves to pay for 9.6 months of future claims.
Figure 5
IBM Corp.
Warranty Reserves, 2003 to 2006
($ Mil and Months of Capacity)
Of course, IBM will continue to make accruals as products are sold, so the reserve will never be exhausted. But what's also clear is that for whatever reason, IBM's management feels comfortable with a thinner cushion than either HP or Apple (Figure 8). If this is because IBM's products carry shorter warranties than HP's or Apple's, then all is well. But if IBM is reducing accruals even though claims are rising, and if this is what's cutting both reserves and capacity, then a day of reckoning is approaching.
Cisco Systems, meanwhile, is another poster boy for stability. Its year-end 2005 acquisition of Scientific-Atlanta Inc. no doubt had an effect on its warranty reserve balance, as well as its total capacity to pay claims. But that warranty reserve remained at $250 million plus or minus 5% for three solid years. And that capacity has never varied above 10.25 months or below 7.3 months, even after the acquisition.
Figure 6
Cisco Systems Inc.
Warranty Reserves, 2003 to 2006
($ Mil and Months of Capacity)
Another model of stability is Sun Microsystems, which has managed to keep its reserve fund balance in the vicinity of $240 to $260 million and its capacity to pay between 7.5 and 9.1 months for the past 15 quarters. We're exaggerating the scale in Figure 7 so that these measures don't appear as flat lines.
Figure 7
Sun Microsystems Inc.
Warranty Reserves, 2003 to 2006
($ Mil and Months of Capacity)
In contrast, what's happening in Figure 8 is that Apple hasn't fully adjusted its warranty accruals so that its warranty reserve fund begins to contract. Its claims rate peaked at 2.08% of sales during the first calendar quarter of 2006. The quarterly claims total peaked during the fourth calendar quarter of 2006 at $77 million paid. But the warranty reserve fund didn't peak until the second calendar quarter of 2006, and it contracted by only $3 million during the third calendar quarter.
Figure 8
Apple Inc.
Warranty Reserves, 2003 to 2006
($ Mil and Months of Capacity)
The net effect is that Apple's capacity to pay claims is now soaring. It had been very close to 10 months for most of 2003 to 2005. But then in the three quarters of 2006 it jumped from 10.3 months to 13.5 months to 16.4 months. That doesn't really hurt anybody, but as Greg Spraker termed it in his Jan. 23 column, there's some "lazy capital" on the books that could be put to better use (unless one believes the recent claims rate reductions are temporary, and that rates will soon rise again).
Estimates for Late Filers
KB Home, we should note, has not yet filed its financial report for the fiscal quarter ended Aug. 31, 2006 because of an investigation of its stock option grants. And so, in Figure 9, what we've done is to repeat the figures calculated for the previous quarter: $135 million in reserve and 23.4 months of capacity. As actual figures become available, we'll modify the data accordingly.
Figure 9 shows a company that has allowed its warranty reserve to increase in size at a rather steady rate during 2003, 2004, and 2005. But then in 2006 the company put the brakes on, and allowed the reserve to plateau at its present size. Reserve fund capacity, meanwhile, has increased from under 20 months to over 30 months, though most of the time it's been in the middle of that range.
Figure 9
KB Home
Warranty Reserves, 2003 to 2006
($ Mil and Months of Capacity)
In contrast, Pulte Homes has kept its warranty reserve capacity below 10 months -- less than half KB Home's level. Interestingly, Pulte's claims rate is also about twice KB Home's (1.3% vs. 0.7%), and its claims paid per quarter well over twice KB Home's ($42 million vs. $17 million).
Figure 10
Pulte Homes Inc.
Warranty Reserves, 2003 to 2006
($ Mil and Months of Capacity)
What's notable is how two extremely close competitors can have such divergent outlooks on what they need to set aside to pay future claims. It's impossible to say whether KB Home is over-accruing or Pulte Homes is under-accruing. And there's no consensus in the homebuilding industry. Lennar and Beazer Homes have low capacities like Pulte, while D.R. Horton, MDC Holdings and Hovnanian Enterprises maintain high capacities like KB Home.
It's much closer in the recreational vehicle segment of the market. Fleetwood Enterprises (Figure 11), Thor Industries (Figure 12), and Champion Enterprises (not pictured) are each at the low end of the spectrum in terms of reserve capacity.
Figure 11
Fleetwood Enterprises Inc.
Warranty Reserves, 2003 to 2006
($ Mil and Months of Capacity)
In most quarters, Fleetwood has kept its reserve close to $60 million in size and in a range of 8 to 10 months in terms of capacity. Thor Industries has allowed its reserve fund to grow in size, but its capacity has remained close to 12 months. Champion keeps its reserve size between $40 and $50 million and its capacity close to 9 or 10 months.
Figure 12
Thor Industries Inc.
Warranty Reserves, 2003 to 2006
($ Mil and Months of Capacity)
Novellus Systems has managed to cut its warranty claims rate by more than two full percentage points in the past year, through a combination of increased sales and reduced claims paid. In Figure 13, one can see the beginnings of that trend turning into an increased capacity to pay.
Figure 13
Novellus Systems Inc.
Warranty Reserves, 2003 to 2006
($ Mil and Months of Capacity)

In the third quarter of 2005, when claims stood at 6.7% of sales, the company's capacity to pay claims stood at only 6.5 months. By the third quarter of 2006, the claims rate had fallen below 4.7% and the capacity to pay was up to 8.3 months, having risen as high as 9.1 months at a time when the balance briefly surpassed $60 million.
Close to the Edge
At NCR, meanwhile, the capacity to pay claims is actually rising, even though the size of the warranty reserve is shrinking. But it's not because claims are falling. They remain within their traditional range of 1.5% to 2% of sales. It has more to do with the fact that NCR keeps its reserve cushion extremely thin, with claims paid per quarter approaching the total balance in the reserve. (A capacity of three months would occur when the amount paid per quarter exactly equals the reserve fund balance.) When a company does its warranty accounting this close to the edge, even small changes in one number have an exaggerated effect on the others.
Figure 14
NCR Corp.
Warranty Reserves, 2003 to 2006
($ Mil and Months of Capacity)
Notice that although all manufacturers average out to a capacity of roughly 17 months in their reserve funds, the warranty managers of these individual companies have on occasion seen fit to maintain capacities of anywhere between three months and two years. And these are among the most stable of all manufacturers, at least in terms of the relative stability of their warranty reserve fund balances and capacities.
External vs. Internal Measurements
Externally, it's extremely difficult to map these capacities to actual changes in the product mix or the average warranty duration of the installed base. Anecdotally, we can point to GM's five-year powertrain warranties, Cisco's acquisition, and IBM's divestiture as some of the forces behind the changes, but the companies aren't giving out any division-by-division warranty numbers to support our theories.
Internally, we just have to assume that they're following changes in their own warranty costs and adjusting accordingly, even though HP, Apple and Novellus may be allowing some minor build-up of "lazy capital" to occur within their reserve funds. The point is, as outsiders we can only guess, and wait for more data to confirm or contest our theories. After almost four years of warranty reporting, however, each of these companies has provided ample data to calculate some baseline averages. And at least among the well-run warranty providers, these numbers usually change slowly.


