New Home Warranties:
Pre-fab and mobile homes have much higher warranty costs than site-built homes. But even for site-built homes, there are big differences between the builders in the way they save and spend their warranty funds.
Warranty claims rose faster than new home sales last year, reversing a two-year trend. Among the 30 publicly-held homebuilders who report their warranty expenses to the U.S. Securities and Exchange Commission, 23 saw their claims rates rise as a percentage of home sales, while only seven saw claims rate decreases.
As a group, the companies reported $946 million in warranty claims last year, up 14% from 2005. Meanwhile, sales grew only 4.7% to $111.2 billion, causing the claims rate to creep up from 0.78% in 2005 to 0.85% in 2006.
This reverses the pattern seen in 2003-04 and again in 2004-05. Both times previously, sales rose faster than warranty claims, and the claims rate therefore fell. During 2003-04, sales were up 24% and claims were up 10%. During 2004-05, sales were up 28% and claims were up 23%. The claims rate therefore declined from 0.91% in 2003 to 0.81% in 2004 and 0.78% in 2005.
Claims Paid
Figure 1 below shows the total claims paid by these 30 homebuilding companies over the past four years. As the totals suggest, the biggest jump in dollar terms occurred from 2004 to 2005, when claims grew by $157.5 million. But of course, that jump was concealed by an even bigger jump in sales, which grew from $83.3 billion to $106.3 billion.
Figure 1
New Home Builders:
Warranty Claims per Year, 2003 to 2006
(in $ Millions per Year)

Of course, the industry totals are simply sums and averages of the 30 companies. And it turns out that while 18 of the homebuilders turned in claims rates below the industry average, 12 were above the average -- some significantly so.
Among the top 10 homebuilders, as defined by annual revenue, seven have claims rates below the industry average while three are above. As detailed in Figure 2, Centex Corp., D.R. Horton Inc., and KB Home are among those below the line, while Lennar Corp. and Pulte Homes Inc. are above.
Figure 2
10 Largest New Home Builders:
Warranty Claims As a Percentage of Sales,
Annual Report of 2006
(in $ billions &percent)
| Annual | Annual | |
| Home | Claims | |
| Company | Revenue | Rate |
| Lennar Corp. | $14.9 | 1.1% |
| D.R. Horton Inc. | $14.5 | 0.3% |
| Pulte Homes Inc. | $14.1 | 1.2% |
| Centex Corp. | $11.9 | 0.3% |
| KB Home | $11.0 | 0.6% |
| NVR Inc. | $6.0 | 0.8% |
| Toll Brothers Inc. | $5.9 | 0.6% |
| Hovnanian Enterprises | $5.9 | 0.6% |
| Beazer Homes | $5.3 | 1.0% |
| Ryland Group Inc. | $4.7 | 0.6% |
Source: Warranty Week from SEC data
In the chart above, we should note that while seven of the 10 had fiscal years ending Dec. 31, D.R. Horton and Beazer Homes ended their fiscal years on Sept. 30 while Centex ends its fiscal year on March 31. However, in each case above the revenue and claims rate figures come from the company's most recent Form 10-K annual report.
Site-Built vs. Mobile Homes
In terms of warranty, there is something of a split between companies that produce site-built homes and companies that produce mobile homes, pre-fabricated homes, or recreational vehicles. Those who build homes in their final location seem to have significantly lower warranty claims rates that those who build anything moveable.
As an example, look at the claims rates of the four companies charted in Figure 3. Champion Enterprises and Fleetwood Enterprises are both makers of pre-fab homes, and Fleetwood also makes RVs. Between them, the lowest claims rate they've ever reported was just a hair below 3% of product sales.
In contrast, KB Home and Lennar build homes the old-fashioned way: one nail at a time. KB Home builds across the U.S., and is also active in France. Lennar is also active nationwide, and also has interests in cable television services. Between them, the highest claims rate they've ever reported was just a hair over 2%.
Figure 3
Site-Built vs. Mobile Home Builders:
Warranty Claims Rates, 2003 to 2006
(As a % of Product Sales)

We should note that for each company in this week's report, we subtracted away all the revenue derived from services, mortgages, land sales, and other non-warranted sources, leaving behind what we hope was just their homebuilding revenue. In the case of the pre-fab companies, we also subtracted out all their retail-level markups, leaving just their manufacturing revenue. Most of the companies are rather helpful with their revenue segmentations, which makes the claims rate calculations all the more accurate.
In Figure 3, we simply want to illustrate the gap between the site-built and mobile home sections of the industry. If we were to add all the other companies, the same effect would be visible on the considerably more crowded chart. Pre-fab, RV and mobile home manufacturers turn in claims rates that look more like those seen for automotive or computer companies, while site-built homebuilders have claims rates closer to those seen for auto and computer suppliers.
Supplier Recovery for Homebuilders
That's a significant difference from the auto and computer industries. In those cases, it's the OEMs with the well-known and customer-facing brand names that pay the most warranty cost. Their suppliers pay significantly less. But in the site-built home industry, the "OEMs" very successfully push their warranty costs back onto their suppliers and subcontractors.
However, it's still not quite right to go comparing claims rates of two different companies, unless one can be sure that they both define warranty the same exact way. While we're confident we have comparable revenue figures, there's no certainty that each and every company puts the same exact cost items under the warranty heading. But in the post-Enron and post-WorldCom era we have to believe that each company is consistent from one quarter to the next regarding what is and what isn't under the warranty cost heading.
Therefore, while it may be improper to compare Lennar to KB Home or to compare Fleetwood to Champion, it should be quite revealing to compare one company to itself over time. Therefore, one can safely say that Champion is getting its warranty costs under control while Fleetwood is recovering from a third-quarter spike. But compared to a year ago, both companies have seen their claims rates rise slightly.
As is detailed in Figure 4, many other homebuilders saw their claims rates positively soar. A year ago, Calton Inc. had a claims rate just over 0.5%. Now it's just under 1% -- an increase of 95%. Comstock Homebuilding Companies Inc. went from 0.28% to 0.44% for a 60% increase. And then there were 15 others that saw annual increases above 10%.
Figure 4
New Home Builders:
Ten Highest Warranty Claims Rate Increases,
Calendar 2006 vs. 2005
(in percent)
| Latest | vs. | |
| Claims | Year | |
| Company | Rate | Before |
| Calton Inc. | 1.0% | +95% |
| Comstock Homebuilding | 0.4% | +60% |
| Meritage Homes Corp. | 0.6% | +57% |
| Coachmen Industries | 5.4% | +52% |
| Palm Harbor Homes | 3.9% | +45% |
| Pulte Homes Inc. | 1.2% | +37% |
| Centex Corp. | 0.5% | +33% |
| Beazer Homes | 1.5% | +29% |
| William Lyon Homes | 1.2% | +27% |
| Cavco Industries Inc. | 5.3% | +26% |
Source: Warranty Week from SEC data
Only seven companies saw their claims rate fall from the end of 2005 to the end of 2006, and only one -- M.D.C. Holdings -- saw it fall by more than 10%. Two of the other six decliners are the homebuilders in Figure 3: Lennar and KB Home. However, Lennar's claims rate was actually lowest during the second quarter of 2006, while KB Home seems to now be on the downstroke of an annual oscillation that peaks during the first half of each year.
Speaking of patterns, one could infer that something as seasonal as homebuilding would exhibit seasonal patterns in warranty claims. We could find no better example of this seasonal effect than Pulte Homes, which has seen first-quarter peaks in claims rates during three of the four past winters, and fourth-quarter troughs during each of the past four years.
Figure 5
Pulte Homes Inc.
Warranty Claims & Accruals, 2003 to 2006
(in $m and % of Product Sales)
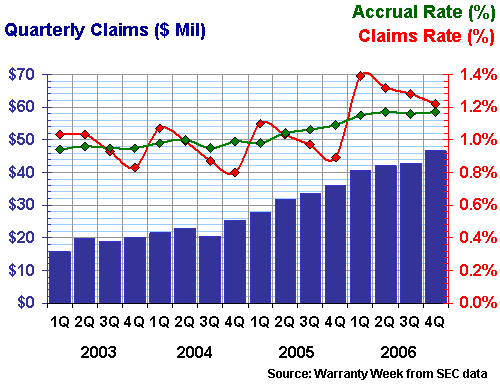
Remember, the warranty claims rate is calculated by dividing claims paid by sales made. So one would expect lower sales in the winter, and higher sales in the spring and summer. But what explains the fourth quarter trough? As the dark blue bars in Figure 5 show, there is no year-end drop-off in claims paid, so it must be yet another revenue effect.
In Pulte's case, the seasonal pattern also carries through to its warranty reserve fund. Notice in the chart above, that while the claims rate (in red) displays a seasonal sawtooth pattern, accruals (in green) follow a much more linear path. When the red line is above the green line, the warranty reserve should be shrinking in size, because more money is going out than is coming in. And when the green line is above the red line, the warranty reserve should be growing in size.
Expansion vs. Contraction
During the past 16 quarters, Pulte's claims rate has been above the accruals line eight times, and below it eight times. It's been above for the past four consecutive quarters, however, which would infer there's been some shrinkage in the reserve fund's total size.
As Figure 6 shows, this is indeed the case. Although the warranty reserve fund was most recently reported at $117 million (up $5 million from the end of 2005), it shrank in size during every quarter in between. It grew at year end only because Pulte added $51.4 million during the fourth quarter against claims of $46.6 million.
Figure 6
Pulte Homes Inc.
Warranty Reserve Fund Balance, 2003 to 2006
(in $m and Months of Capacity)
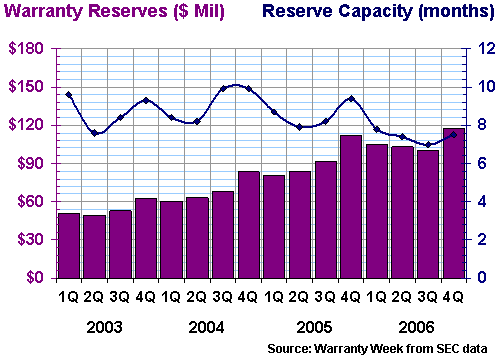
The seasonal pattern for reserves is more muted, but it's still there. Notice how the balance during the fourth quarter is always higher than the balance at the end of the three preceding quarters. And notice also how the company's capacity to pay claims, measured by dividing the reserve balance by the most recent month's claims total, has also peaked during the fourth quarter of each year. However, the trend for 2006 has been towards lower capacity, meaning the company is becoming more comfortable maintaining a thinner cushion than it did during 2003 to 2005.
In Figure 7, D.R. Horton exhibits claims rate peaks during the fourth quarter of at least the past three years. Why the difference? One might assume it's a function of their fiscal year ending three months earlier than Pulte's, but we're actually charting each company by calendar quarters, not their own fiscal periods. So these peaks actually occur during the first quarters of their respective fiscal years, suggesting that perhaps it has less to do with the seasons and more to do with the bookkeeping.
Figure 7
D.R. Horton Inc.
Warranty Claims & Accruals, 2003 to 2006
(in $m and % of Product Sales)
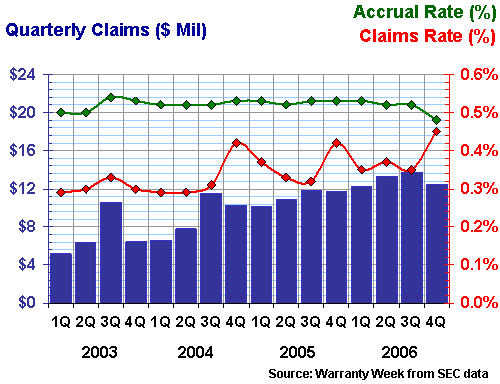
Notice also that in every quarter for the past four years, D.R. Horton accrues more than it spends on claims. If this were to continue indefinitely, the company's reserves would grow far larger than needed. Indeed, the reserve fund balance decreased only once during the past 16 consecutive quarters. However, for at least the past two years the company has kept its reserve capacity very close to 30 months, meaning the ratio between claims paid and reserves kept has remained more or less constant over that period.
Adjusting Accruals to Match Claims
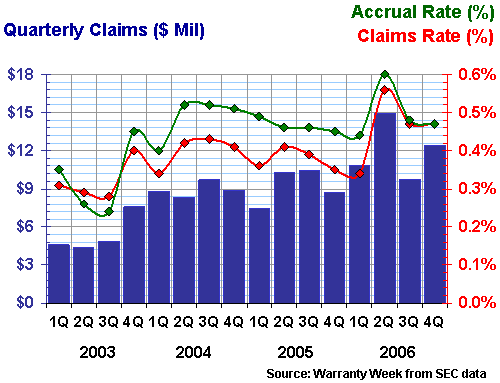
There's no seasonal pattern to the Centex data in Figure 8, but compared to some of the others, at least the green and red lines seem to be moving in the same direction at the same time. Since each rate is computed by dividing by the same sales figure, the gap between them is purely a function of whether the company wants its reserves to expand or contract.
As a quick read of the chart suggests, Centex has decided to allow its reserves to grow. And sure enough, its reserves stood at $15.9 million at the end of 2003; $27 million at the end of 2004; $42.8 million at the end of 2005; and $47 million at the end of 2006. But claims are up and sales are down, so the company now has less than 12 month's worth of claims in its reserve fund. The good news is that even at this level, its reserve capacity is much higher than it was in either 2003 or 2004, when it was significantly below the 12-month level.
Figure 8
Centex Corp.
Warranty Claims & Accruals, 2003 to 2006
(in $m and % of Product Sales)
Finally, we wanted to show you what happens when warranty claims and accruals each have a mind of their own. Hovnanian Enterprises, depicted in Figure 9, has allowed its accrual rate to drift as high as 1.3% and as low as 0.3%. We say allow because the accrual rate is something under the control of a company's financial planners. If they foresee rising claims, they can increase accruals. If they foresee declining claims, they can lower accruals. But if they have no visibility at all, then the claims and accrual rates will move more or less independently.
Figure 9
Hovnanian Enterprises
Warranty Claims & Accruals, 2003 to 2006
(in $m and % of Product Sales)
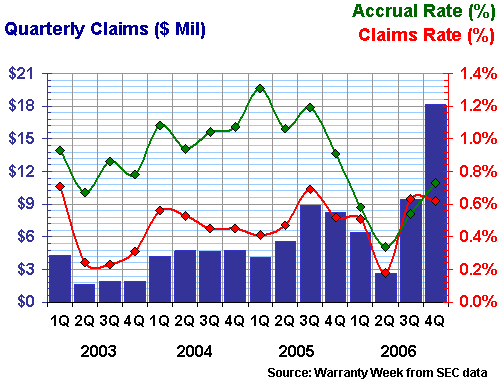
Hovnanian seems to have no visibility. Furthermore, Hovnanian seems to have guessed wrong, cutting accruals last year just as claims began to spike. The company ended 2006 with $93.5 million in its warranty reserve fund, at a time when it was paying out claims at a rate of $6 million per month. That means its capacity to pay most recently stood at 15.5 months, which is a bit to the high side of the range seen for most homebuilders. Better safe than sorry, right?
However, back in the second quarter of 2006, when the company was paying out only $880,000 per month in claims, its capacity to pay was over 100 months. And for most of 2003 to 2005, it was well over 30 months, meaning the company was allowing its reserves to build far larger in size than was necessary, considering its standard warranty is only 12 months long. The company says it employs an outside actuary to help with estimates. We think throwing darts at a target would be just as accurate and much less costly.
| Back to Part Three | Go to Part Five |


