HVAC, Appliance & Building Material Warranties:
Since so many manufacturers straddle the plumbing, appliance, and HVAC industries, we're profiling them together. But warranty occurs at very different rates for each product type. And some of the most expensive products from a warranty point of view seem to be small kitchen and personal grooming appliances.
To close out our annual tour of the manufacturer's warranty landscape, we're taking a quick look at several types of products aimed at the home and the office.
Heating, ventilation, air conditioning and refrigeration manufacturers, along with makers of kitchen and bathroom appliances, tools, and building materials make up roughly 6.8% of the $28 billion in annual claims reported so far by all types of U.S.-based manufacturers. So it's easy for them to get lost amongst the automotive (45%) and high-tech (36%) manufacturers that dominate the warranty landscape.
Back on April 24, we took a look at new home builders, who have historically accounted for an additional 2.5% to 3.4% of the warranty landscape over the past four years. These are essentially their suppliers, as well as the suppliers of systems, machines, fixtures, and tools to the actual homeowners.
As detailed in Figure 1, the HVAC and appliance makers account for the majority of the group's warranty spending. The makers of tools and building materials not only spend less dollars on warranty claims, but also spend a smaller proportion of their manufacturing revenue on warranty.
Figure 1
US-Based HVAC, Appliance & Building Material Manufacturers:
Warranty Claims per Year, 2003 to 2006
(in $ Billions per Year)

Together, these two categories saw claims grow 2.7% last year, after a 10.8% jump from 2004 to 2005 and a 7.7% increase from 2003 to 2004. Last year, the building materials category accounted for most of the growth, turning in a 4.2% expansion rate in claims paid. From 2004 to 2005, it was the HVAC and appliance makers who accounted for the bulk of the growth, with a collective 18% increase in the amount spent on claims.
Of course, sales also grew in the interim, so warranty as a percentage of revenue remained relatively unchanged. As depicted in Figure 2, the HVAC and appliance manufacturers have remained within their 1.5% to 1.8% range for 15 of the past 16 quarters, and the tool and building material manufacturers have stayed within their 0.6% to 0.75% range in every quarter since warranty data became available in early 2003.
Figure 2
US-Based HVAC, Appliance & Building Material Manufacturers:
Warranty Claims Rates, 2003 to 2006
(As a % of Product Sales)

Individual manufacturers quite frequently fall outside these bounds. But usually, when one sees a sudden big change, the others don't, so the averages remain relatively predictable. Within heating, cooling, and washing appliances, we find that the bigger the box, the longer the warranty and the higher the warranty cost. In fact, some of the makers of the really large central heating and air conditioning systems designed for commercial buildings experience warranty claims rates as high as anything seen in the auto or computer industries.
That having been said, the highest claims rates we found came from companies making small kitchen and bathroom appliances. They also showed the most volatility, with one company seeing its claims rate soar from 2% to 5% within a year. So perhaps there is less of a correlation between warranty duration and claims cost than we thought.
HVAC & Tools in Other Industries
We should note that Carrier, as part of the United Technologies conglomerate, is not counted here. Instead, it's in the aerospace category, as is Honeywell, Crane, and a handful of others who cross the line between air conditioning and airplanes. Johnson Controls, despite its acquisition of York International, is still in the auto parts supplier segment, as are Illinois Tool Works and Modine Manufacturing.
That leaves us with about 109 current or former warranty providers whose claims are included in Figures 1 and 2. of them, Whirlpool Corp. is by far the largest warranty provider, reporting $459 million in claims last year and $294 million in 2005, before it acquired Maytag (which would have ranked third were it still independent).
Whirlpool doesn't report its service revenue, which somewhat complicates the claims and accrual rates computed in Figure 3 below. To make the claims and accrual rates as accurate as possible, all non-manufacturing revenue must be subtracted from the total sales figures. That excludes finance, insurance, mortgage, and investment revenue as well as service, consulting, and consumables revenue. It also excludes extended warranty revenue, which of course isn't itself a physical product.
In cases like Whirlpool, what we do is estimate the non-warranted revenue segment and subtract it out from the total. It's highly unlikely we're exactly correct, so take these figures with some degree of uncertainty. They could be a tenth of a point higher or lower.
Figure 3
Whirlpool Corp.
Warranty Claims & Accruals, 2003 to 2006
(in $m and % of Product Sales)
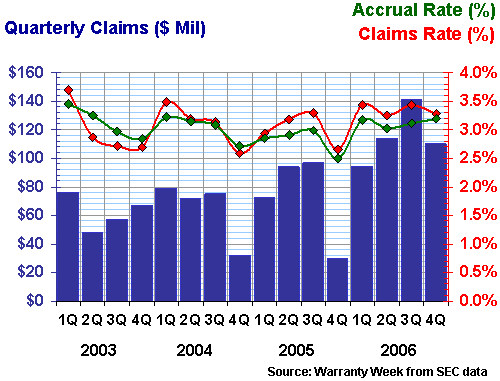
In every quarter but one, Whirlpool has kept both its claims and accrual rate between 2.5% and 3.5%. There does seem to be something of a seasonal pattern to the data, with peaks occurring in three of the past four winters and troughs in three of the past four autumns. However, as the actual claims paid totals suggest (the blue bars), the pattern has little to do with the actual dollars paid, and probably has more to do with seasonal sales fluctuations.
Note the growth in the size of the blue bars in 2006 but also note the relative flatness of the red and green lines. This suggests that as Maytag joined the family, claims continued to be paid at the old Whirlpool rate. That in itself is an achievement, because at times Maytag's claims rate was somewhat higher than Whirlpool's. That old Maytag repairman was busier than he let on.
American Standard & Trane
The second largest warranty provider in these segments is American Standard Companies, which conveniently enough belongs in both segments. Its Trane operation is a major HVAC vendor, and its plumbing and fixtures business earn it a spot in the building materials category.
Therefore, take the numbers in Figure 4 as an example of what happens when the two are blended into a single warranty profile. They're actually closer to the HVAC/appliance average, which to an outsider would suggest this is the dominant portion of the company when it comes to paying warranty claims. And although we're not going to graph plumbing competitors such as Masco and Fortune Brands for you this week, their warranty payout as a percentage of revenue is usually well below the 1% level.
Figure 4
American Standard Companies
Warranty Claims & Accruals, 2003 to 2006
(in $m and % of Product Sales)

Besides the Moen brand of faucets, Fortune Brands is also a major supplier of whiskey (Maker's Mark, Jim Beam, etc.) as well as cabinets and locks. Masco has the Delta and Peerless brands of faucets, as well as cabinets, paints, doors, and windows. So neither can be called a "pure play" in plumbing. But we still believe that claims rates are generally lower in the plumbing business than in HVAC.
Lennox International
If there's anything close to a "pure play" in HVAC systems, it would have to be Lennox International. Yet Lennox also makes fireplaces and chimneys, but, if you think about it, what's that but old-fashioned heating?
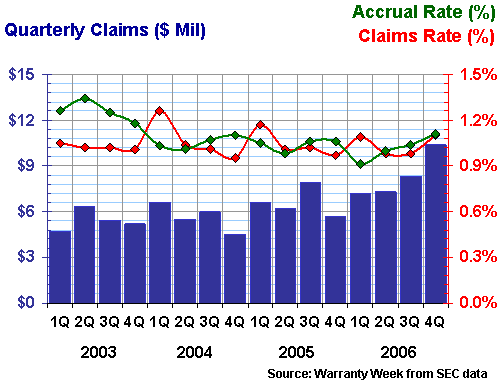
In Figure 5, it's pretty clear that Lennox sees a spike in its claims rate during the coldest months. But as is the case with Whirlpool, the blue bars show that the pattern has more to do with sales fluctuations than with actual claims paid. What is clear is that whether sales go up or down, Lennox usually keeps its accrual rate close to the 1.0% to 1.2% range.
Figure 5
Lennox International Inc.
Warranty Claims & Accruals, 2003 to 2006
(in $m and % of Product Sales)
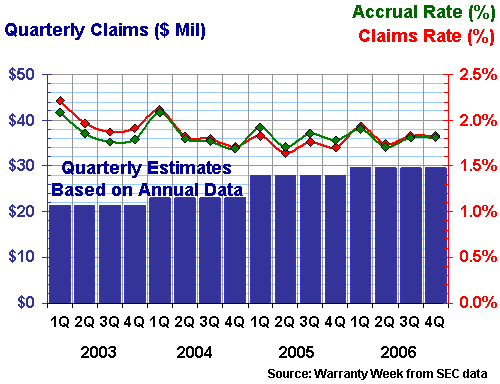
Black & Decker is both a tool and appliance manufacturer, not to mention plumbing, with such brands as DeWalt, Price Pfister, Kwikset, SnakeLight, and Dustbuster under its control. The problem is, it reports its warranty spending only once a year, so in Figure 6 what we've done is to split their reported figures into four equal parts. That makes the lines for their claims and accrual rates somewhat bumpy, but these fluctuations are purely reflections of their quarterly sales figures.
The fourth quarter figures are probably the most accurate of the series, and they have rather consistently come in between 1.7% and 1.9% for both claims and accruals. In two of the past four years, the claims and accrual rates were within hundredths of a percentage point of each other, and in the other two there was barely a tenth of a point between them. As a result, the company's warranty reserve has remained very close to the half-year level, meaning the total balance was very close to what the company paid out in claims over six months. Or, to put it another way, the annual claims total was twice the reserve balance.
Figure 6
Black & Decker Corp.
Warranty Claims & Accruals, 2003 to 2006
(in $m and % of Product Sales)
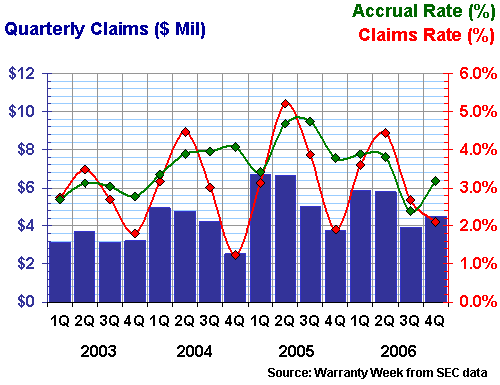
If you're looking for seasonality, look no further than Helen of Troy Ltd. But again, the curves have more to do with sales fluctuations than with any real seasonality to claims. People may buy more hair care appliances towards the end of the year as the holidays approach, but the appliances will break at any time.
Note how all four peaks in the claims rate came in the second quarter, and how all four troughs came six months later. The accrual rate was somewhere in the middle, but note how both rates were close to the five percent mark in 2005. Seasonality is one thing, but this is evidence of an actual manufacturing problem. And -- what a shock -- the company's financial statements for the quarter ended May 31 and the year ended Feb. 28, 2005 are completely silent about any such problems.
Figure 7
Helen of Troy Ltd.
Warranty Claims & Accruals, 2003 to 2006
(in $m and % of Product Sales)
Finally, we'd like to end the warranty tour with snapshots of two relative newcomers to the charts. Goodman Global was for many years owned by Harold Goodman and his family, until it was sold to investors in 2004 and went public in 2005. So it didn't begin reporting its warranty figures until early 2006.
Jarden Corp. acquired its way into the warranty business by buying such brands as Sunbeam, Coleman, Mr. Coffee, Oster, and First Alert. It first began reporting its warranty expenditures in early 2005, after the acquisition of American Household Inc., the parent of those brands.
Historical Data Provided
The reason we have four years of data for Goodman in Figure 8 and only two years of data for Jarden in Figure 9 is simple. Goodman was kind enough to include historical data for years that they were not required to report, while Jarden started fresh and reported nothing older than the Jan. 24, 2005 acquisition.
So what we did with Goodman's data was chop it up like Black & Decker. The difference is that since Goodman never reported its quarterly revenue for 2003 or 2004, we had to also chop those annual figures into four equal slices. In Figure 8, therefore, the only accurate data is for the year 2006. Everything for 2003-2005 is derived from estimates. We do believe, however, that Goodman has been steadily cutting its warranty expenditures from the 3% level in years past to the 2% level now.
Figure 8
Goodman Global Inc.
Warranty Claims & Accruals, 2003 to 2006
(in $m and % of Product Sales)
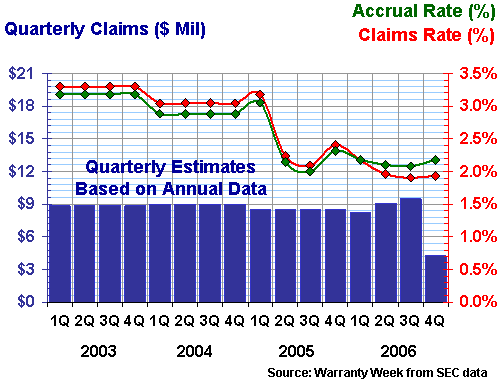
Jarden, meanwhile, has seen its claims rate jump from the 3% level in 2005 to over 5% in early 2006. As with Helen of Troy, this shouldn't happen in a company that has its manufacturing quality under control. And if this is the first mention of those spikes in a publication anywhere, then perhaps manufacturers should replace some of the boilerplate "we make estimates and adjust them when we have to" language that passes for explanations of their warranty management methodologies.
Figure 9
Jarden Corp.
Warranty Claims & Accruals, 2003 to 2006
(in $m and % of Product Sales)

We started this annual tour back on April 3 with a series of Top Ten lists that highlighted some of the biggest annual changes among the 800 or so manufacturers we track. Since then, we've visited the automotive, computer, semiconductor, new home, and consumer electronic segments of the warranty-providing landscape. And we covered the others as part of an all-inclusive snapshot in the April 11 issue.
Did you miss any? They're all online for easy browsing. Are there any segments, product types, or markets we missed? Please make your suggestions to the editor. Two of the segments we spotlighted in this round were in fact the suggestions of readers.
| Back to Part Seven |


