Ten Worldwide Warranty Providers:
It's holiday time in the U.S. this week, so we're taking the opportunity to present warranty data for ten global brands based in other countries. Despite the currency and accounting differences, many pay warranty claims at rates close to those turned in by their U.S.-based peers.
A British subject living in America was recently asked by a friend why July 4 wasn't a holiday back home. In reply, he said, "if we took a holiday for every colony we lost, we'd never get any work done."
Well, this week in America, nobody is getting any work done, because in 2007 our Fourth of July Independence Day holiday falls smack in the middle of the work week. Nobody knew whether to take off the preceding two or the following two days to make it a long weekend, so as a result many Americans are doing no work at all, even if they are showing up at the office.
Therefore, it's in that spirit that we broadcast a newsletter exclusively for the 20% of our 4,500 readers who are located in one of the 60 or so other countries that we now reach, and who we assume are working this week. For the remaining 80% of our readership that's located in the U.S., we expect a record number of "out of the office" auto-response messages to clog up our inbox during the overnight period tonight.
New Warranty Data
This edition of the newsletter is about some of the largest warranty providers located in Europe and Japan, specifically ten of the few dozen non-American companies that are kind enough to reveal their warranty expenditures in their financial statements, even though they're not required to do so. Japanese companies traditionally end their fiscal years on March 31 and publish their annual reports in June or July. European companies usually follow the calendar year, and publish their annual reports in the spring months. So much of this data is brand new, and little of it has ever been published elsewhere.
Toyota Motor Corp. published its annual report only ten days ago, detailing a 13% automotive sales gain and a 20% jump in profitability. Warranty claims were up only 11%, however, which means that the company's warranty expenses as a percentage of sales were down ever so slightly.
In the chart below, the red line represents the claims rate and the green line represents the accrual rate. At this scale, it's difficult to discern any change from one year to the next, but the claims rate for fiscal 2007 was 1.28%, down slightly from 1.31% in fiscal 2006 and up slightly from 1.26% in fiscal 2005.
Figure 1
Toyota Motor Corp.
Warranty Claims & Accruals, 2003 to 2007
(in Yen and % of Product Sales)
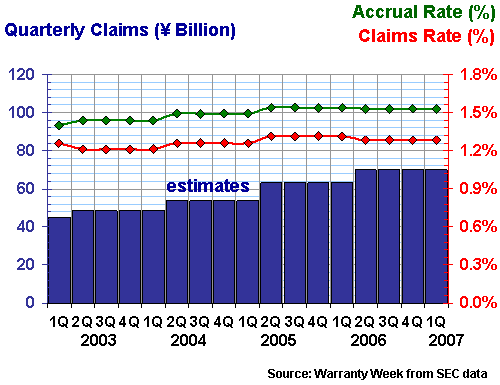
One could be forgiven for thinking that the lines in the graph above are simply too flat to be real. We assure you that they are real, though, with the following cautions. First, we're taking annual data and chopping it into four equal parts to fit it into the usual quarterly format, which is why each group of four data points looks so identical.
Second, we're calculating our ratios in yen, euros, and even in Swedish kronor, dividing warranty outlays by sales in each case. So while the red and green percentages might be somewhat comparable across nationalities, the blue columns are not unless one first makes a currency conversion. And since exchange rates are constantly changing, it also matters when those comparisons are made.
In terms of dollars, Toyota paid out US$2.4 billion in warranty claims in calendar 2006 -- slightly more than Hewlett-Packard and significantly less than either Ford or General Motors. So if it were entirely U.S.-based, it would be the third-largest warranty provider in the country. This ranking comes despite sales of 8.5 million vehicles worldwide -- two million more than Ford and only half a million less than GM did in the year ended Dec. 31.
In terms of accruals, Toyota put aside 337 billion yen in its most recent fiscal year, which equates to US$2.85 billion, or roughly $334 per vehicle. That means the company's auditors expect to spend that amount per vehicle over the life of their warranties. Needless to say, GM and Ford put aside much more. And while we're not providing a chart this week for DaimlerChrysler, suffice it to say that GM is not even close to being the world's top warranty provider.
Warranty in the Euro Zone
In Europe, DaimlerChrysler is one of only two car companies that make any warranty disclosures at all. The other is Italy's Fiat Group. In 2006, Fiat reported accruals of nearly 1.2 billion euros, which equates to US$1.38 billion. But Fiat makes everything from Iveco trucks to Maserati sports cars. Given that wide-ranging product mix, we're not sure how relevant it is to say that this totals $697 per vehicle. As was detailed in the May 30 newsletter, buses and heavy trucks demand much higher accruals than cars and light trucks.
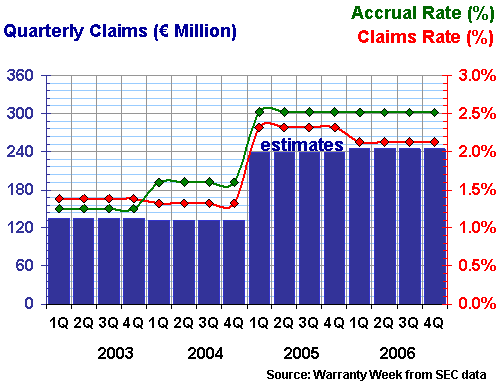
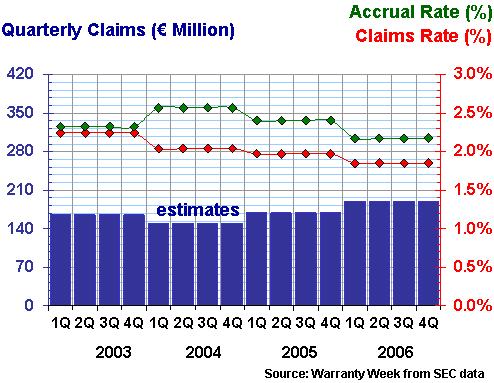
Still, it turns out that Fiat is comparable to other nameplates, coming in somewhat below the levels of GM and Ford and somewhat above Toyota and Honda. As can be seen in the chart below, Fiat has been married to a 2.5% accrual rate for the past two years, despite a slight drop in the claims rate from 2.3% in 2005 to 2.1% in 2006.
Figure 2
Fiat S.p.A.
Warranty Claims & Accruals, 2003 to 2006
(in Euro and % of Product Sales)
Fiat owns roughly 90% of CNH, makers of both farm and construction equipment under the brand names Case, New Holland, and Kobelco. Despite this Italian parentage, CNH is kind enough to report its warranty expenditures to the U.S. Securities and Exchange Commission. Quite conveniently, it also does so quarterly, and it reports in U.S. dollars. So what you see in the chart below is not comprised of quarterly estimates based on annual data. It's actual quarterly data. Nor is a currency conversion necessary to compare the company to peers such as Caterpillar or John Deere.
Figure 3
CNH Global N.V.
Warranty Claims & Accruals, 2003 to 2006
(in US Dollars and % of Product Sales)
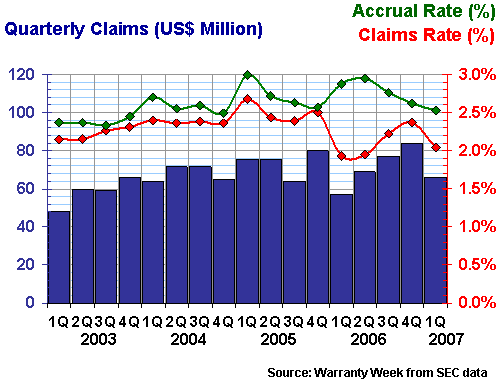
So how does CNH stack up against its American competition? One cannot safely assume that each company is counting warranty expenses in precisely the same way, so percentage comparisons are risky. But at the end of 2006, Cat was accruing 2.1% of its product revenue to pay future warranty claims while Deere was accruing 2.4%. In that light, CNH's 2.6% is slightly higher but not excessively so (for the equivalent Cat and Deere charts, see the May 15 newsletter).
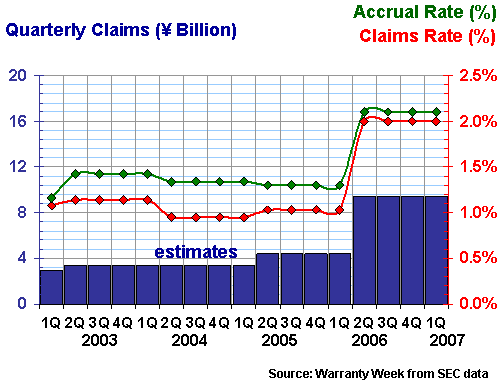
Komatsu is the closest Japanese peer of CNH, though it also gets into lasers and logging machinery, not to mention mining equipment. For several years, Komatsu was accruing 1.3% to 1.4% of its revenue to finance future warranty claims, but in its most recent fiscal year it pushed the rate up to 2.1%. And so, in that respect, Komatsu is now in the same range as CNH, Cat, and Deere.
Figure 4
Komatsu Ltd.
Warranty Claims & Accruals, 2003 to 2007
(in Yen and % of Product Sales)
Turning from vehicles to high technology, we'll first take a look at two European telecom companies, followed by two Japanese consumer electronics companies. As was detailed in the June 5 newsletter, Nokia and Sony Ericsson together account for more than 41% of worldwide mobile phone shipments, far more than rivals such as Motorola and Samsung.
However, Sony Ericsson is a joint venture, so it does not report its warranty expenses separately from its Japanese and Swedish parents. So what we'll do below is present Nokia, followed by Ericsson, followed by Sony.
Figure 5
Nokia Corp.
Warranty Claims & Accruals, 2003 to 2006
(in Euro and % of Product Sales)
As can be seen in Figure 5, Nokia saw a slight rise in its accrual rate in 2004 but has reduced it every year since. Its claims rate, meanwhile, has fallen four years in a row, dipping below 1.9% in 2006.
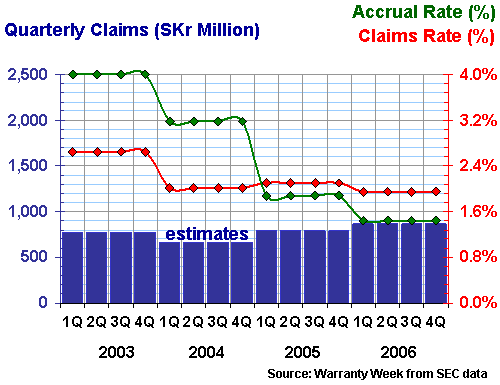
Ericsson has also kept its claims rate close to 2% for the past three years, but as can be seen in Figure 6, its accrual rate has varied from 3.2% in 2004 to 1.4% in 2006. Note that in this instance, the rates have been calculated in Swedish kronor. But also note that claims per year have not changed all that much. So what could be causing the company to slash its accrual rate?
Figure 6
LM Ericsson Telephone Co.
Warranty Claims & Accruals, 2003 to 2006
(in Swedish Kronor and % of Product Sales)
At Sony, the massive battery recall and other adverse events have pushed up the claims rate from 0.8% in fiscal 2006 to 1.1% in fiscal 2007. That's still not very high, but tell that to the executives who see it as a 43% jump in one year (not to mention the impact on a venerable worldwide brand image). In dollar terms, because of the weakening yen, it's only a 41% jump (from $410 million to $577 million), but either figure would place Sony into the list of the top ten warranty providers, if it were a U.S.-based company.
That's not really good news. Competitors such as Matsushita and Canon have managed to keep their claims rates well below 1%, as is the norm for most consumer electronics companies. In Sony's defense, it also has a sizeable computer operation -- and computers generate far higher claims rates than home entertainment products.
Figure 7
Sony Corp.
Warranty Claims & Accruals, 2003 to 2007
(in Yen and % of Product Sales)
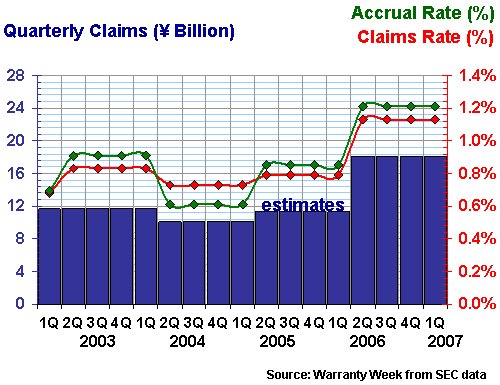
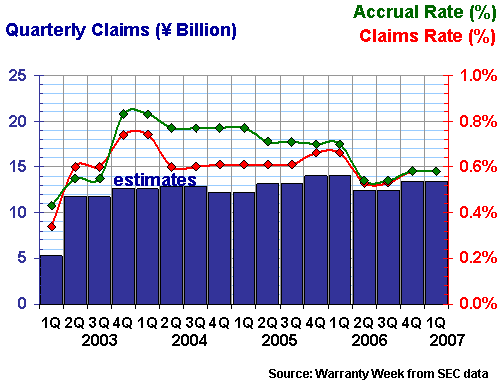
Hitachi Ltd. is in numerous market sectors that Sony is not. And Hitachi paid out more than Sony in warranty claims during 2004 and 2005. But now it pays out less. In terms of rates, Hitachi pays out a much smaller percentage of its product revenue in warranty claims than does Sony. Keep in mind that we've subtracted out all of Sony's entertainment revenue and all of Hitachi's service revenue. That still doesn't mean it's a comparison of apples to apples, because the product lines are still very different.
By the way, the reason why the data in Hitachi's chart seems to move in pairs is because the company files not only an annual report, but also a half-year report. It's the only company of these ten to do so, although one of the others actually makes quarterly disclosures. All the others file their warranty data with the SEC only once a year.
Figure 8
Hitachi Ltd.
Warranty Claims & Accruals, 2003 to 2007
(in Yen and % of Product Sales)
Electrolux is one of those brand names that everyone knows but nobody knows much about. That's because the company also sells its appliances under so many other brand names, among them Arthur Martin, Eureka, Frigidaire, Gibson, Kelvinator, Rex, Simpson, Tornado, Volta, and Westinghouse.
Figure 9 provides a view of the company's warranty spending patterns. As the chart shows, Electrolux has kept its claims rate below 1% for at least the past four years, while its accrual rate has been just slightly above that level.
Figure 9
Electrolux AB
Warranty Claims & Accruals, 2003 to 2006
(in Swedish Kronor and % of Product Sales)
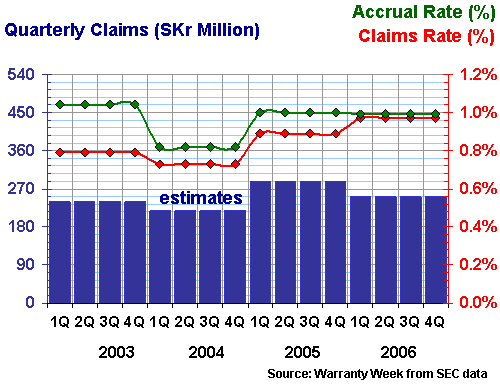
As with Ericsson, the currency unit is the Swedish kronor. If it were dollars and if the company were U.S.-based, Electrolux would rank somewhere towards the middle of the top 50 warranty provider list. Arch-rival Whirlpool pays out more than three times as much in claims, despite having a comparable annual revenue.
Finally, we present the warranty record of a company that is neither European nor Asian --one of the few such companies on our radar screen, if you'll pardon the pun. The Empresa Brasileira de Aeronáutica, better known as Embraer, is Brazil's second-largest exporter, supplying regional and budget airlines around the world with its small-but-fast commercial jet airplanes.
Figure 10
Embraer Brazilian Aviation Co.
Warranty Claims & Accruals, 2003 to 2006
(in US Dollars and % of Product Sales)
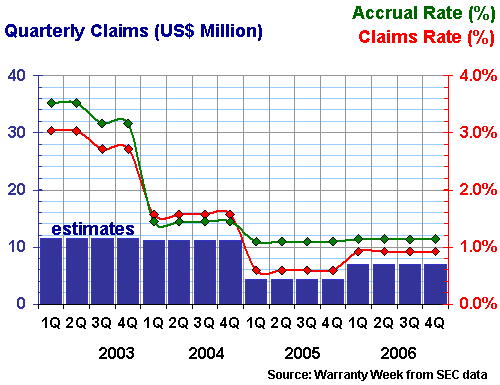
As the data in Figure 10 attests, the company in recent years has significantly improved its warranty profile, dropping down from the 3% range to same claims-rate levels as Boeing. And although it doesn't really compete with Boeing or Airbus, its larger airframes such as the E 190 are beginning to make inroads with airlines such as JetBlue Airways, which by the way frequently notes that many of its planes are so new they're still under warranty.
So there you have it: the warranty profiles of ten non-American manufacturers, only two of which report in U.S. dollars. While one can compare the claims and accrual rates, one should also keep in mind that each is a product of a different set of accounting principles. And while we've made some currency translations, keep in mind that these exchange rates change from year to year.


