Five-Year Warranty Trends, Part Four:
Warranty costs as a percentage of sales have remained rather stable since 2003. But while some industries are always below the overall average, others are always above it. And that depends not only on the product being made but also on the maker's spot in the supply chain.
Over the past five years, US-based manufacturers have spent an average of 1.7% of their product revenue on warranty claims, and have set aside slightly more than 1.7% each quarter in accruals, to pay for future warranty claims.
These rates have been remarkably stable since 2003, never veering by more than 0.15% above or below the long-term average. Numerous industries have also produced steady claims rates and accrual rates, although as we shall see, in a few cases a single large company was able to move the average significantly all by itself.
In last week's newsletter we detailed the dollar amounts spent on warranty by companies in 14 different industries. This week, we propose to express those dollar amounts as a percentage of sales.
Automotive Warranty Rates
Let's start with the automotive and aerospace sectors, which together account for more than half of all warranty claims. As can be seen in Figures 1 and 2, it's not a tremendous percentage of their overall sales. The automotive OEMs as a group have stuck close to the 2.4% to 2.6% range over the past five years, while aerospace manufacturers have remained close to the 1% mark.
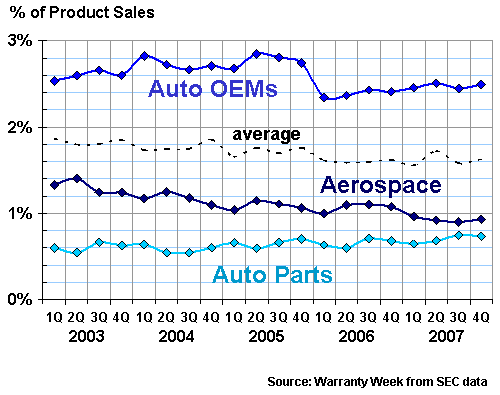
Auto parts suppliers, meanwhile, have remained more or less at the 0.6% level, despite the best efforts of the automotive OEMs to push more of their warranty expenses back onto their suppliers. Claims have remained stuck at the 0.6% level, although accruals (Figure 2) have crept up slightly in the past year.
Figure 1
U.S. Transportation Manufacturers
Claims Rates, 2003 to 2007
(As a % of Product Sales)
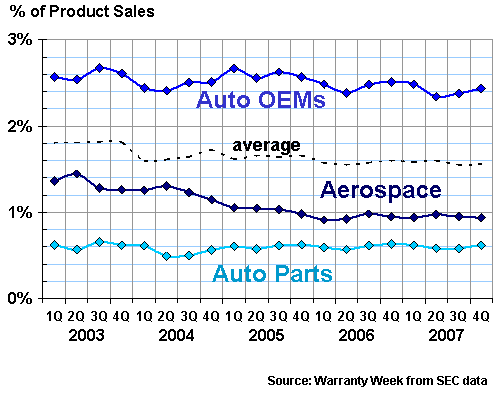
In all these figures, we've tried to use the same color scheme as we did in last week's newsletter. But on each chart this week, we've added a dotted line that expresses the industry average for all U.S.-based manufacturers -- the 1.7% line plus or minus 0.15%.
All of the odd-numbered figures refer to warranty claims while all the even-numbered charts refer to warranty accruals. The difference is that claims are what is paid now to repair products sold in the past while accruals are what is set aside now to pay for warranty claims in the future.
Put another way, claims are what happens to you while accruals are what you think will happen. Claims rates are very sensitive to changes in sales volumes. When sales are growing, the claims rate looks low because new products are being sold faster than the old ones are coming back for repairs. When sales are falling, the claims rate looks artificially high because the old products are coming back for repairs faster than the new ones are shipping out.
Accruals Proportional to Sales?
Accruals shouldn't be so sensitive. If you believe a vehicle will generate $500 worth of warranty expense, you set aside $500 in accruals every time you sell a vehicle. The accrual rate should remain steady, unless there's some other change such as an increase in quality or a warning of some imminent spike in defects.
The irony here is that the accrual rates in Figure 2 are not quite as flat as the claims rates in Figure 1, despite the well-publicized ups and downs of the automotive and aerospace industries. But they're close enough to look similar, which means that manufacturers in these sectors are good at matching inflows to outflows when it comes to their warranty reserve funds.
Figure 2
U.S. Transportation Manufacturers
Accrual Rates, 2003 to 2007
(As a % of Product Sales)
There's a bit more variability in the high tech sectors, which we've chopped up into multiple graphs for easier viewing. Figures 3 and 4 address the computer sectors while Figures 5 and 6 look at telecom, medical, and scientific. And then we've shifted consumer electronics into Figures 9 and 10, primarily because it was such an unusual graph.
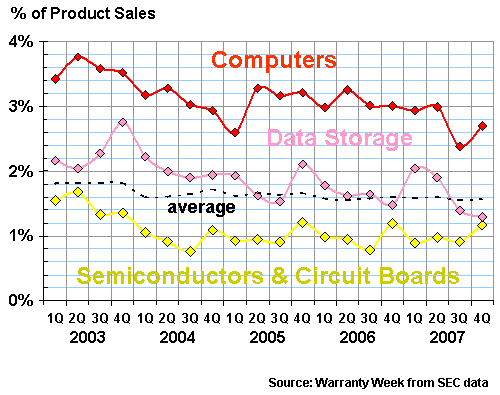
Computer manufacturers still have some of the highest warranty expenses of all industries, at least as a percentage of product revenue. While the automotive OEMs are spending around 2.4% to 2.6% of their revenue on warranty, computer OEMs regularly spend upwards of 3%.
Notice, however, that claims have recently dipped in the computer sector, falling to 2.4% in the third quarter of 2007. This is due to a combination of factors, first among them the continued cost cutting by Dell, HP, IBM, and other major vendors. We initially suspected it might be due to Gateway becoming foreign-owned a year ago, but before that happened its claims and accrual rates were close to the industry average. So taking it out of the mix wouldn't have changed the averages all that much.
Figure 3
U.S. High Tech Manufacturers
Claims Rates, 2003 to 2007
(As a % of Product Sales)
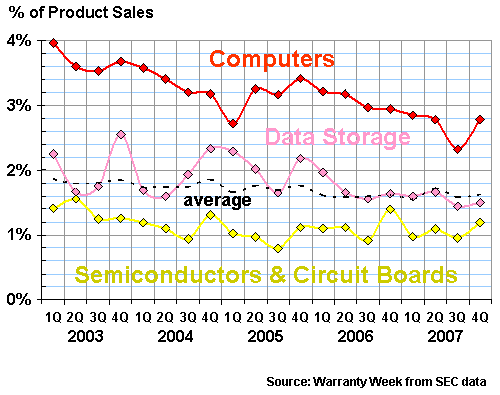
Again, the lines on the accrual chart below more or less mirror the claims chart above. There are some minor differences, but for the most part each pair of rates moves in parallel. This is a sign that manufacturers in these sectors are quick to adjust their accruals up or down as they detect changes in claims patterns. We'll look at this in more depth in the weeks ahead, but for now let's just say that the similarity between Figures 3 and 4 is a sign of some well-run warranty departments.
Figure 4
U.S. High Tech Manufacturers
Accrual Rates, 2003 to 2007
(As a % of Product Sales)
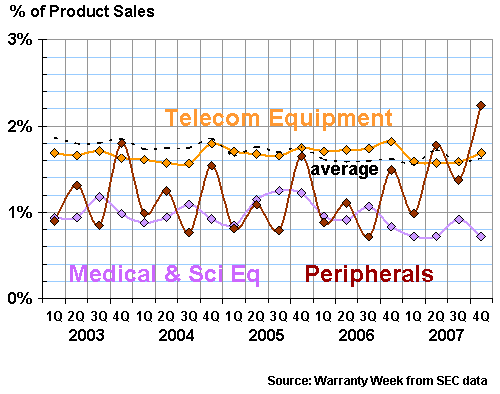
Figures 5 and 6 include three more high tech sectors. Why not put them all on the same chart? While that may have worked last week, it would be a tangled mess this week. As can be seen in these next two figures, the claims and accrual rates for both peripherals and medical equipment are close to the same level as semiconductors and printed circuits. And then telecom equipment is very close to the average for data storage, and both of these are very close to the average for all industries.
Keep an eye on the dotted black line. That's the average for all manufacturers in all industries. And it seems to be the case that while some industry sectors are always above the average, others have always been below the average over the past five years. Only six of the 14 sectors have ever crossed the average, and only a few of those have ever been both significantly above and significantly below the average at any point since 2003.
Figure 5
U.S. High Tech Manufacturers
Claims Rates, 2003 to 2007
(As a % of Product Sales)
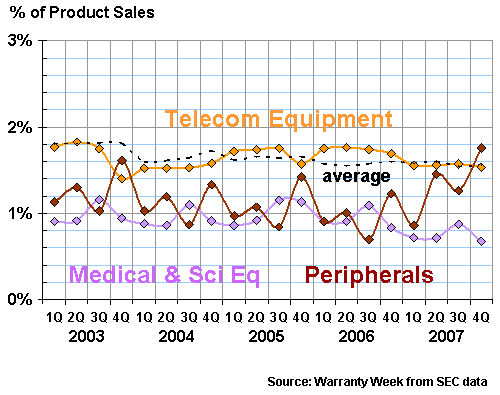
The peripherals sector is one of the few to show a significant upturn in both claims and accruals, spending most of 2003-2006 below the average but then rising above it in late 2007. The 18-month upwards trend is actually more noticeable in Figure 6 than in Figure 5. While the claims rate has risen to 1.8%, the accrual rate has gone above 2.2%. Both rates were below 1% earlier last year.
If we had to give a reason, we'd point to Lexmark International, which has seen both the claims and accrual rate for its printers rise steadily since 2006. In 2004, the company set aside $229 million in accruals to cover $2 billion in printer hardware sales, for an 11% accrual rate. But in 2007, it set aside $285 million to cover only $1.5 billion in hardware sales, for a 19% accrual rate. That was enough to move the average upwards.
Figure 6
U.S. High Tech Manufacturers
Accrual Rates, 2003 to 2007
(As a % of Product Sales)
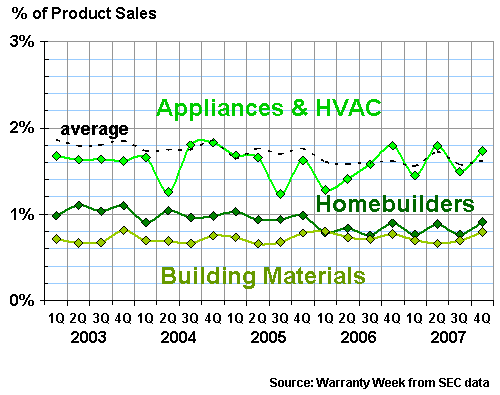
Building manufacturers, meanwhile, are in a full fledged slowdown, reporting precipitous declines in revenue during recent quarters. But a quick glance at Figures 7 and 8 suggests business as usual, more or less. That's because except in the case of a few homebuilders, most of these companies have cut claims and accruals proportionately to sales. There have been a few recent rises, but by and large the sectors on these charts have remained within their five-year ranges.
Figure 7
U.S. Building Manufacturers
Claims Rates, 2003 to 2007
(As a % of Product Sales)
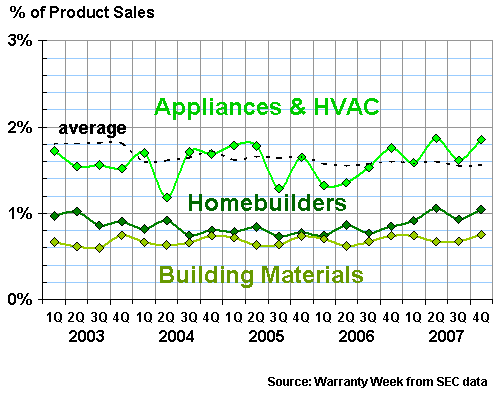
The building materials sector in this instance is a catch-all for all sorts of items used to furnish offices and homes. It includes cabinets, roofing, faucets, doors, chairs, windows, beds, pillows, tables, locks, pools, paint, carpets, and lots more. And while some of these items attract above-average warranty costs, the sector as a whole is the second lowest of all, beaten by only the auto parts supplier sector.
There's something to be said for being a supplier. On each of these charts, the brand names facing the consumer suffer the highest warranty costs, while those further back in the supply chain seem to keep their costs far lower. It happens in automotive and computers, and as can be seen in Figures 7 and 8, also in the building materials sector. The big difference is that the homebuilders seem to have perfected the art of passing their costs on to others.
Figure 8
U.S. Building Manufacturers
Accrual Rates, 2003 to 2007
(As a % of Product Sales)
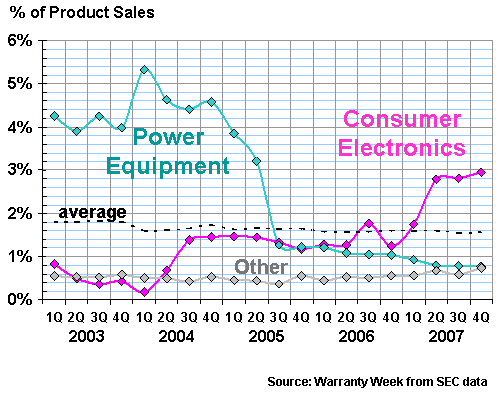
Figures 9 and 10 hold two sectors that defy the five-year trends, primarily because of the large companies within them. The electrical power equipment sector is dominated by General Electric, which as we noted two weeks ago keeps reorganizing its turbine business into larger and larger divisions. The result is smaller and smaller warranty percentages.
It's quite the opposite story at Microsoft, which saw its claims and accruals spike in the middle of 2007, thanks to the Xbox 360. Because so many of the leading consumer electronic brands are foreign-owned, a warranty crisis for one large American manufacturer can create exactly the kind of spike one sees in Figures 9 and 10.
Figure 9
Other Manufacturers
Claims Rates, 2003 to 2007
(As a % of Product Sales)
That huge spike in the second quarter of 2007 is what happened when Microsoft set aside almost a billion dollars to finance future warranty claims for the Xbox 360. That more than wiped out the cost cutting produced by other American members of this sector, which is otherwise dominated by makers of speakers, handheld GPS navigational equipment, projectors, car audio, radar detectors, and musical instruments.
Figure 10
Other Manufacturers
Accrual Rates, 2003 to 2007
(As a % of Product Sales)
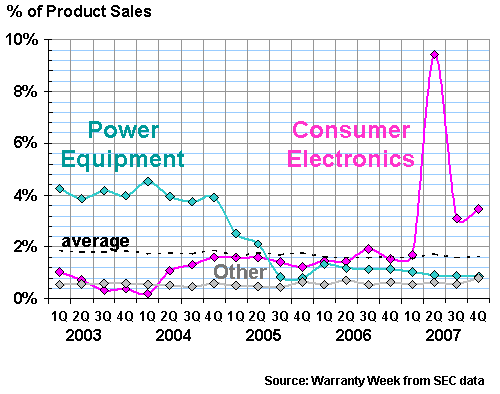
The "other" category that meanders across the bottom of these two charts is what's left over after everything that can fit into one of these 14 sectors has been put there. It's mostly sports equipment and jewelry, with some material handling equipment, oil drilling and mining equipment, some non-vehicle farm equipment, and both guns and bullet-proof gear. None of these sectors seem to attract warranty expenses at a very high rate, however.
Go to Part One
Go to Part Two
Go to Part Three
This Is Part Four
Go to Part Five
Go to Part Six


