

Auto Warranty Trends:
While the RV makers are imploding, the farm vehicle makers are thriving. Somewhere in between are the passenger car and light truck makers, for whom warranty has become an important issue in the government bailout. But the 1.9% gap in warranty costs between OEMs and their suppliers remains firmly in place.
U.S.-based automotive warranty providers finally saw their claims level rise above $13 billion last year, but not by much. Actually, for the first time ever, the OEMs that make the completed vehicles saw their annual claims total fall, although their parts suppliers saw their claims rise.
Sales declines blamed on financial fears had lots to do with that decline in warranty claims, but so did increasing product quality. At a time when many shoppers worried about an OEM's bankruptcy making their warranties worthless, the OEMs were finally beginning to see their warranty management project yield results. And sales declines, while they were devastating for some segments such as recreational vehicles, were far from universal. Other segments, such as lawn equipment and farm vehicles, actually saw both sales growth and warranty cost reductions.
Three or four years ago, the pain in the automotive warranty sector was widespread. OEMs saw their claims rise 7.5% from 2004 to 2005, while their suppliers saw a 12% increase. Automotive industry warranty claims grew by 8% that year, from $11.6 billion to $12.6 billion. And while warranty costs soared, so did product recalls. Numerous OEMs and suppliers began to look for ways to end the crisis.
Suppliers See Warranty Costs Rise
Those efforts are beginning to pay off, at least for the OEMs. Last year, overall automotive warranty claims rose slightly to $13.1 billion from $13.0 billion in 2007, but the OEM's share actually fell. It was the parts suppliers who saw their claims soar 15%, from $1.7 billion in 2007 to $2.0 billion in 2008. So now it's their turn to look for ways to control their soaring warranty costs.
Figure 1 tracks this split over the past six years, ever since automotive OEMs and their suppliers first began reporting their annual warranty expenditures to the U.S. Securities and Exchange Commission. Warranty Week is now tracking the warranty costs of 32 OEMs making everything from small motorcycles to huge fire engines, plus another 69 automotive suppliers, as well as 87 other companies that are at least partially engaged in the automotive industry.
Figure 1
Automotive Warranty Claims
Worldwide Warranty Claims of U.S.-based Companies, 2003-2008
(claims paid in US$ billions)
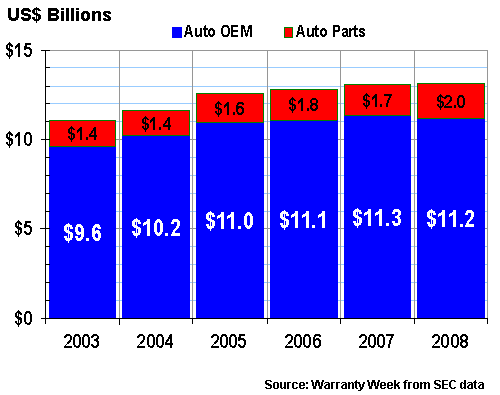
As can be seen in the data in Figure 1, the automotive warranty sector grew only slightly in 2008 -- its third year in a row where the total amount of claims rose less than 2% overall. All of this can't be blamed on falling sales. Because there's always a lag time between when a vehicle is sold and when it is repaired, claims totals have yet to reflect much of the impact from the terrible sales declines of late last year.
Rather than being caused by sales declines, we suspect much of the OEM's declines in warranty claims is the result of higher product quality, more efficient claims processing, and better use of warranty data analytics, text mining, and other innovations. And some of it is the result of the OEMs' deliberate efforts to shift more of their warranty costs back onto the books of their suppliers.
Those efforts resulted in a 15% rise for supplier warranty claims in 2008, the biggest annual jump since measurements began in 2003. That jump actually comes a year after parts suppliers actually saw their claims decline slightly, from $1.8 billion in 2006 to $1.7 billion in 2007. And that jump in claims comes at the worst possible time, when sales are falling.
Still Not Closing the Gap
These supplier recovery efforts, however, have not done much to close the 1.9% gap between the claims rates of the OEMs and their suppliers. Or perhaps more specifically, declines in sales volumes have prevented the OEMs from enjoying the benefits of their supplier recovery efforts. The gap is still as wide as ever.
In Figure 2, we're taking the amounts of claims paid and dividing them by the corresponding amounts of products sold. That changes the measurement to claims as a percentage of sales. And as Figure 2 shows, the gap is still stubbornly close to 1.9%, just as it was in 2003. The difference is that the rates have both shifted slightly upwards.
Figure 2
U.S.-based Automotive Warranty Providers
Average Claims Rates of OEMs & Suppliers, 2003-2008
(claims as a percentage of product sales)
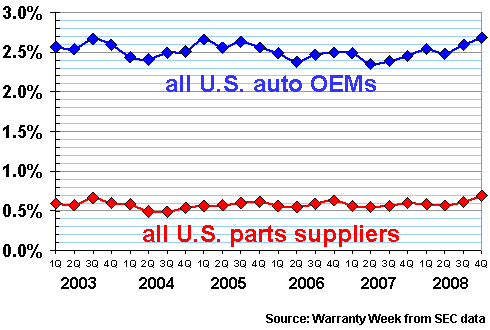
There's nothing alarming in these trends, but it shows how tricky warranty cost reduction efforts can be. Even though OEMs are seeing declines in their payouts, increases in their supplier recoveries, and therefore declines in their net warranty costs, claims as a percentage of sales rose because their sales fell faster than their costs.
Then again, as mentioned, the terrible fourth quarter downturn has yet to make a big impact on warranty claims, because vehicles sold late last year wouldn't have begun coming in for repairs until this year. And because the first nine months of 2008 weren't so terrible, especially outside of North America, worldwide auto sales revenue figures for the whole year were down only 17% at GM and were down 16% at Ford.
A few OEMs making much larger vehicles actually saw sales increases, e.g. Caterpillar up 14%, Deere up 20%, and Navistar up 21%. But it wasn't strictly a size thing. RV sales plunged. Big vocational truck makers such as Oshkosh Corp. and Federal Signal Corp. also saw sales fall. But those selling vehicles to farmers saw sales mostly rise.
Rear-View Recession Data
Because of the lag time with claims, sales declines would be much more quickly seen in measurements of warranty accrual rates or warranty reserve balances. Both of these measures can change much sooner, because accrual rates are always being fine-tuned to more closely match changes in quality and sales volumes.
Therefore, while claims may be a bit of a lagging indicator, accruals and reserves may signal trends even sooner. In the U.S., of course, we were told in the fall of 2008 that the recession actually began in late 2007. In hindsight, the warranty figures seem to support that.
In Figure 3, we're tracking the collected warranty reserve fund balances of the 32 OEMs from 2003 to 2008, and we're stretching the scale of the vertical axis to highlight the changes. And it's obvious that while balances were up in 2005, steady in 2006 and up slightly in 2007, they fell by alarming amounts throughout 2008.
Figure 3
U.S.-based Automotive OEMs
Warranty Reserve Balances, 2003-2008
(in US$ billions)
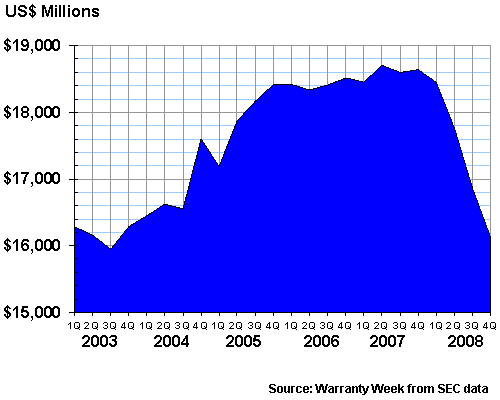
The OEMs' warranty reserve balances actually peaked on June 30, 2007 at a level of $18.7 billion. That was before Ford sold its Jaguar and Land Rover operations to Tata Motors, and long before most people had heard of either subprime mortgages or credit default swaps. The last uptick in the balances came right at the end of 2007. It's been down ever since.
By the end of 2008, automotive OEMs had allowed their reserves to drop by more than $2.5 billion from that peak. GM's warranty reserves were down $1.1 billion from their end-of-2007 peak level while Ford's were down an incredible $2 billion from their mid-2005 peak level. Again, some of that reduction is the result of higher quality, some is from reduced sales, and at least in Ford's case, some of it is due to key divestitures.
RV Makers in Crisis?
Incredibly, the pain began to impact more specific product types even earlier than it became obvious for passenger car makers. And no segment seems to have been harder hit than recreational vehicles. Winnebago Industries saw sales plummet an incredible 68% in the fourth quarter of 2008, compared to a year before. Fleetwood Enterprises saw a 50% sales decline. Thor Industries saw a 43% decline. Monaco Coach and Coachmen Industries couldn't even get their financial reports filed on time.
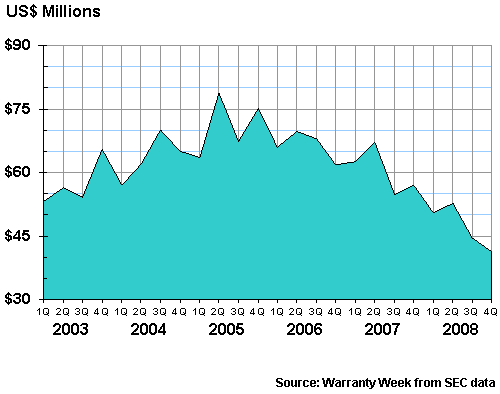
In Figure 4 below, we've taken the accruals made by these and other manufacturers in the RV industry over the past six years. And what's immediately apparent is that accruals peaked in the second quarter of 2005. Accruals were $79 million in that quarter. In the final quarter of 2008, they were barely over $41 million.
Figure 4
U.S.-based RV Manufacturers
Warranty Accruals Made, 2003-2008
(in US$ billions)
While bankruptcies may have been avoided by the passenger car makers and their suppliers, thanks to government support, there was no such safety net in place to help the RV makers. Fleetwood filed for Chapter 11 bankruptcy protection on March 10, while Monaco dismissed most of its workforce on March 2.
Warranty claims had little to do with the collapse of these companies, but in both cases their claims rate rose dramatically in 2008. In Figure 5, one can see that Fleetwood's claims rate rose from 3.2% at the end of 2007 to 5.7% at the end of 2008. Normally, anything over 5% is a sign of trouble. Meanwhile, the accrual rate, which should be less impacted by changes in sales, rose from 2.6% to 4.1% during the same time period.
Figure 5
Fleetwood Enterprises Inc.
Warranty Claims & Accrual Rates, 2003-2008
(as a percentage of product sales)
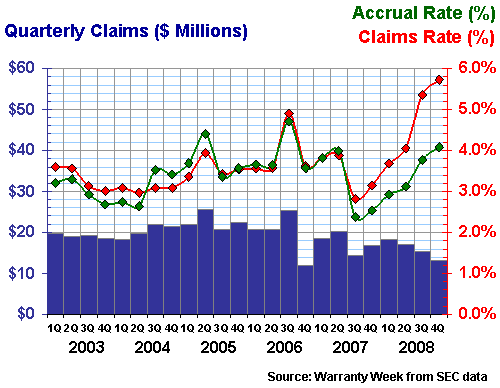
Fleetwood Enterprises was one of only two companies to make the maximum of four top 10 lists in the March 13 newsletter (the other was Ingersoll-Rand, which is covered below in Figure 8). Monaco Coach was not included in that ranking because its annual report has yet to be filed, so there's no annual data to be had. But just in the first nine months of 2008 the company saw its claims rate rise from 3.1% to 5.8%, while its accrual rate rose from 3.2% to 6.3%.
Winnebago Industries isn't a large enough warranty provider to make it into the top 100 list, but its warranty claims rate nearly doubled since the end of 2007, from 1.7% to 3.3%. Coachmen Industries already had a claims rate over 4% even before it missed the deadline for filing its latest annual report.
The point is that RV makers have been hit hard by the dual perils of falling sales and rising warranty costs. And it makes perfect sense, if you think of RVs as the cross between autos and homes, and if you think of autos and homes as the industries hardest-hit by the recession. Spartan Motors is the only major RV industry player to see either a sales increase or a claims rate reduction in 2008, and we think that probably has more to do with the momentum in its fire truck, ambulance, and military vehicle lines of business.
Supplier Bailouts
Chrysler and GM got their government bailouts, and now it appears that some of their suppliers will as well. This effort comes too late to help major suppliers such as Delphi and Dana avoid bankruptcy reorganizations, but at least it comes soon enough to help the most vulnerable avoid complete shutdowns.
Visteon, for instance, delayed the filing of its annual report because the cautionary language its auditors would have been forced to include could have triggered a bankruptcy filing in and of itself, had the company not first obtained waivers from its creditors. And when Visteon finally did file its annual report, the auditors did include the feared "going concern" language. The report also included the news that Visteon's UK subsidiary had filed for administration -- the British equivalent of a Chapter 11 reorganization. More relevant to warranty, the report also showed that Visteon's claims rate had soared from 0.3% at the end of 2007 yo 0.6% at the end of 2008, along with a modest rise in the accrual rate and a modest drop in the warranty reserve balance. Sales were down 15% for the year.
Dana filed for bankruptcy protection in March 2006 and emerged from it with a fresh start in January 2008. Delphi filed for bankruptcy protection in October 2005 and has yet to emerge from it. From the track record that can be seen in Figure 6 below, one could be forgiven for suggesting that bankruptcy proceedings have wreaked havoc on Delphi's accrual rates.
Figure 6
Delphi Corp.
Warranty Claims & Accrual Rates, 2003-2008
(as a percentage of product sales)
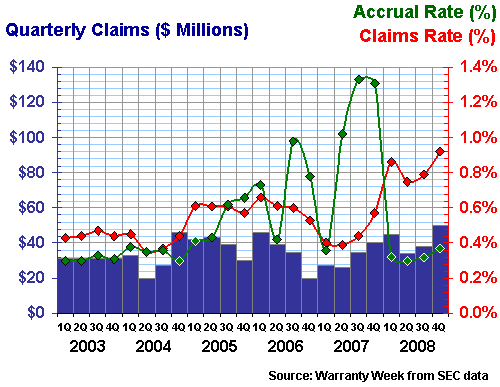
Until the point that Delphi filed for bankruptcy protection, claims and accrual rates tended to be close to one another in the 0.3% to 0.7% range. Since the filing, however, accrual rates have gone as high as 1.3% and the claims rate recently hit a new high of 0.9%. Some of that increase undoubtedly is linked to the settlement of outstanding warranty issues with GM, but some of it is probably the result of increased efforts by GM and other OEMs to recover more warranty costs from their suppliers.
That's the painful downside of supplier recovery efforts: What's good for GM and Ford may turn out to be very bad for Delphi and Visteon.
Acquiring Warranty Cost Increases
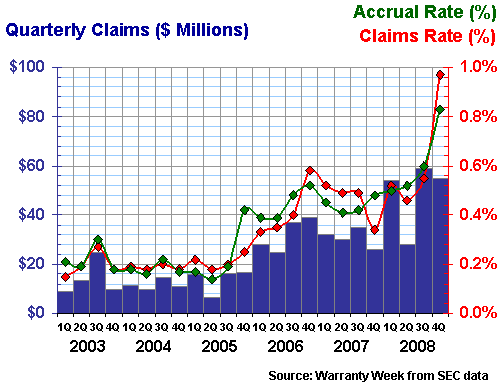
There are several other suppliers that saw massive increases in their claims and accrual rates for much less alarming reasons. Johnson Controls, in Figure 7, and Ingersoll-Rand, in Figure 8, each made key acquisitions in the heating, cooling, ventilation and refrigeration industry that caused their warranty profiles to swell.
At the time of its acquisition by Johnson Controls in 2005, York International was reporting claims and accrual rates a little below 2%. Trane Inc. had been slightly above 2% shortly before being acquired by Ingersoll-Rand last year.
In Figure 7, it's clear that claims and accrual rates keep rising at Johnson Controls, from the 0.2% levels seen before the merger in 2005 to the 0.8% to nearly 1.0% levels seen in late 2008. The point is, however, that even after such a dramatic rise, it's still not as high as York was on its own. And, neither 1% nor 2% is really all that high, compared to the passenger car makers, for instance.
Figure 7
Johnson Controls Inc.
Warranty Claims & Accrual Rates, 2003-2008
(as a percentage of product sales)
It's much the same story at Ingersoll-Rand. It had a stable warranty profile at around 1% of revenue until it acquired Trane, and then both claims and accrual rates rose dramatically. But they're still not all that high, and the increase isn't all that surprising given how warranty-intensive Trane's line of business can be. The difference is that while Johnson Controls' vehicle interior line of business wasn't all that warranty-intensive either before or after the merger, Ingersoll-Rand was already making refrigerated trucks, golf carts, and supermarket food refrigeration equipment that generated a healthy level of warranty costs. But Trane was still a bit higher.
Figure 8
Ingersoll-Rand Co. Ltd.
Warranty Claims & Accrual Rates, 2003-2008
(as a percentage of product sales)
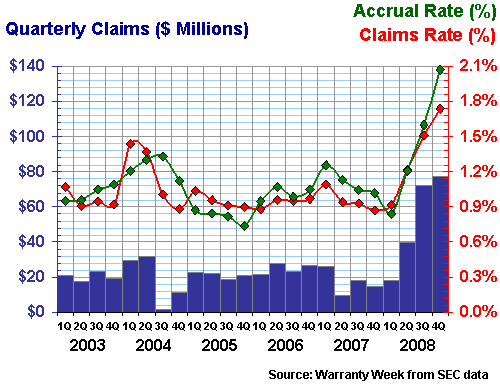
We'd expect that Ingersoll-Rand and Trane together will find a new "normal" in the range of 1.5% to 2.0%. And, despite the company's recently-announced plans to relocate its headquarters from Bermuda to Ireland, it is expected to continue to file quarterly financial reports with the SEC. And Ingersoll Rand's shares will continue to be listed on the New York Stock Exchange under the trading symbol of IR.
The Brightest Bright Spots
Finally, as we assembled this brief overview of trends among the automotive OEMs and their suppliers, we kept on seeing the same pattern: while most of the on-road business was down and warranty costs were rising, in the off-road business the opposite was true.
We note with delight that of the 14 automotive OEMs whose vehicles are used primarily off-road, an incredible 12 saw sales growth in 2008. Of those 12, five also saw both claims and accrual rate decreases. In fact, of the eight off-road vehicle manufacturers that made the top 100 warranty list as detailed in the March 13 newsletter, all eight showed sales increases!
The winter vehicle makers, as represented by Arctic Cat and Polaris, saw both sales increases and warranty cost reductions in 2008. Terex, NACCO and Astec Industries, all makers of heavy construction and road paving equipment, all saw sales increases, though they also saw warranty cost increases.
The four companies with a presence in the farm vehicle and lawn and garden equipment businesses saw both rising sales and declining warranty costs. Deere & Co. showed a 20% rise in annual sales. Caterpillar Inc. was up 14% for the year. Briggs & Stratton Corp. was up 11% for the second half of 2008, compared to the second half of 2007. Even Toro Co. squeezed out a 1% increase in product sales, which is remarkable given its dependence on residential customers. All but Cat also managed to reduce their warranty costs.
Warranty Reserve Stability
We already looked at the recent claims and accrual levels of Deere in the January 29 newsletter, along with other early reporters such as Navistar International. So we won't repeat that here again. However, there is another side to the story in terms of warranty reserves.
As can be seen in Figure 9, Deere began 2003 with a warranty reserve around $332 million in size. It ended 2008 with an $814 million balance in its warranty reserve fund. And although the balance was relatively stable in 2006 and 2007, it was rising before, and has been rising again after that two-year stretch. And that is to be expected from a company with rising sales, and therefore a rising need for warranty reserves.
Figure 9
Deere & Co.
Warranty Reserve Balance, 2003-2008
(in US$ millions & in months of capacity)
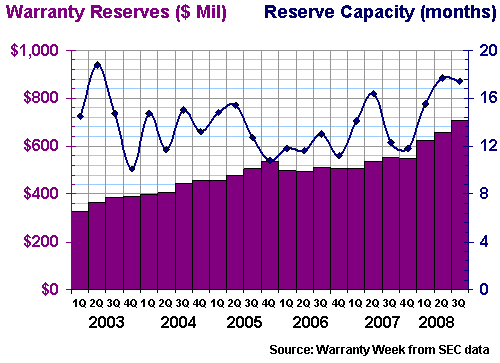
The purple columns in Figure 9 represent the warranty reserve balance, measured at the end of each quarter in millions of U.S. dollars. The dark line above those purple columns represents the amount in the warranty reserve divided by the amount spent per month to satisfy warranty claims. In that respect, it's a measure of the capacity of the reserve, expressed in months rather than in dollars or as a percentage of sales.
One would hope, for instance, that if a company was issuing one-year warranties for all its products, the warranty reserve's capacity would remain close to 12 months. This would show that the company is neither over-accruing nor under-accruing for expected future warranty costs. And if that is the typical length of a company's warranties, and if the capacity remains close to that mark for multiple years, one would say the company is doing a good job of managing its accruals and reserves.
In looking at Figure 9 in this week's newsletter alongside Figure 4 in the January 29 newsletter, what becomes clear is that despite rising sales, a highly seasonal product line, and rising reserves, Deere has been able to hold its warranty reserve capacity mostly within a range of 12 to 18 months. And its claims and accrual rates, though they gyrate over the course of the year, are usually around 1.5% during the growing season when the machinery is in heavy use and up around 2.5% to 3% during the fall and winter when it's undergoing maintenance. But despite all that variability and seasonality, there's a pattern of consistency in the data.
Go to Part One
This is Part Two
Go to Part Three
Go to Part Four
Go to Part Five
Go to Part Six
Go to Part Seven
Go to Part Eight
Go to Part Nine


