Appliance & Building Material Warranties:
The economic downturn that started with the homebuilders is showing its effects on the makers of appliances, fixtures, tools, furniture and building materials. But some segments haven't seen very big recent declines in warranty expenses, and some companies have actually seen their warranty costs rise.
Of the three major sectors in the warranty world -- vehicles, electronics, and buildings -- the latter is by far the smallest. While almost half of last year's $28.7 billion in warranty claims arose from the sale of automobiles, heavy equipment, boats and aircraft, and while more than a third came from computers, telecom, medical equipment, consumer electronics and other high-tech lines of business, only 14.4% came from the building trades.
And despite the slowdown that's evident below in Figure 1, the combined reported claims costs of the more than 123 warranty providers active in the building trades topped $4 billion for the third year in a row in 2008. Makers of home appliances and heating, ventilation, and air conditioning systems accounted for the bulk of that claims cost ($1.85 billion), followed by the manufacturers of portable generators and other power generating equipment ($951 million), the makers of fixtures, furniture, and other building materials ($757 million), and finally by the publicly-traded builders of new homes ($570 million).
Figure 1
Appliance & Building Material Warranty Claims
Worldwide Warranty Claims of U.S.-based Companies, 2003-2008
(claims paid in US$ millions)

When we last checked in with the building trades, coincidentally in the year-apart newsletters of September 25, 2008 and September 25, 2007, it wasn't yet clear how pervasive the economic downturn that began with the homebuilders would later become. We're planning an in-depth report on the homebuilders in next week's newsletter, so this week we'll tackle the other three segments.
Appliances & HVAC
Let's start with the appliance sector. One reason this sector accounts for so much warranty expense is the breadth of the products within it. Everything from basement furnaces to rooftop HVAC systems fits in here, as does practically anything mechanical that's used to cook or clean food or clothing (or people).
In Figure 2, we've taken the same data included in Figure 1 and chopped it into quarterly pieces, stretching the vertical scale as much as possible to show off the fluctuations in a better light. And it's clear from this angle that the peak came in the second quarter of 2007, when claims almost hit $600 million. By the final quarter of 2008, claims had fallen to $437 million, the lowest quarterly total since the end of 2006.
Figure 2
Appliance & HVAC Equipment Warranty Claims
Worldwide Warranty Claims of U.S.-based Companies, 2003-2008
(claims paid in US$ millions)
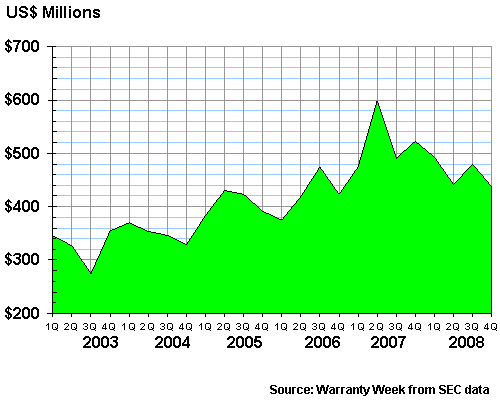
They say you never know when an industry has bottomed out until you're looking at it in the past. We suspect the same may be true of the industry peaks. Indeed, we weren't even told the current recession had begun until it was almost a year old. And looking at the appliance and HVAC data now in hindsight, it's clear that the peak for this segment was more than a year and a half ago. No other quarter has come close to that $600 million peak.
But wait, let's not jump to conclusions so quickly. As we saw two weeks ago in the April 2 newsletter, one very large company (in that case, Motorola) can skew an entire industry's data (in that case, telecom equipment), making its own peak look like the industry's peak. In this case, we suspect the peak arose from an anomaly reported by Whirlpool.
As can be seen in Figure 3, Whirlpool's warranty claims total momentarily surged in the second quarter of 2007, jumping from a $125 million total in the first quarter to $279 million in the second. The company never revealed the reason for the surge, but it quickly subsided and claims rates went back to "normal." And then at the end of both 2004 and 2005 there's a notch in the data, as claims fell to unusually low levels.
Figure 3
Whirlpool Corp.
Warranty Claims & Accrual Rates, 2003-2008
(as a percentage of product sales)
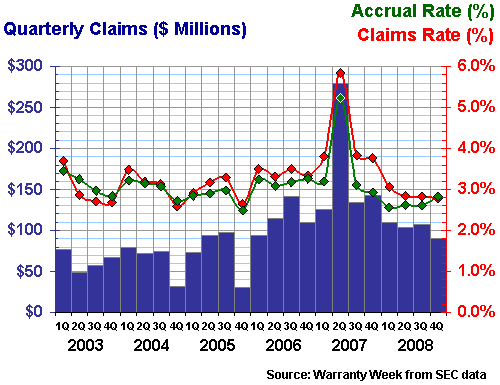
There's nothing alarming in this data. It just shows how timing can mean everything in warranty reporting. For any given company, after six years one can see a baseline developing, or at least a normal range of ratios, and one can spot the divergences from that baseline with the naked eye. It's a big reason why we present so much of the warranty metrics in chart form -- the pictures tell the story so much better than words or numbers ever could.
Acquisition-Related Surges
We spent a lot of time in the report on the top 100 warranty providers of 2008 describing how Ingersoll-Rand managed to get onto so many lists. Basically, that's what happens when a company makes a major acquisition in a warranty-intensive industry, as Ingersoll-Rand did when it acquired Trane and in the process became a major HVAC industry player.
Rather than repeat all of that again here, we'll suggest a detour back to that newsletter and then a quick look at the chart below, where it's rather easy to spot the moment the acquisition became final.
Figure 4
Ingersoll-Rand Co.
Warranty Claims & Accrual Rates, 2003-2008
(as a percentage of product sales)
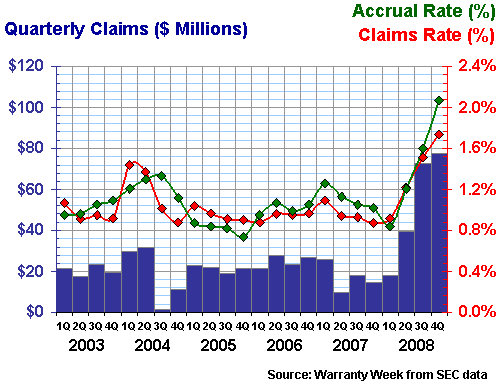
IR's claims rate and accrual rate each more than doubled from the end of 2007 to the end of 2008, and its warranty reserve quadrupled in size. But that's almost entirely caused by Trane coming into the fold. The same thing happened to Johnson Controls when it acquired York International. At first the metrics soar, then they readjust to the new "normal."
Carrier & Otis
Last week, we included United Technologies Corp. in the aerospace industry, because of its ownership of Sikorsky, Pratt & Whitney, Hamilton Sundstrand, and other aerospace operations. This week, we'll borrow them back for the appliance industry, thanks to its ownership of Carrier. And, one could make a case that they also belong in the building materials segment, thanks to its ownership of Otis Elevator.
In spite of the early 2008 spike in warranty costs, UTC has been rather stable over the past two years. Warranted product revenue grew by 5% in 2008, the claims rate fell by 3%, and the warranty reserve contracted by 9%. The only big change was the accrual rate's one-tenth reduction from 1.1% to 1.0%.
Figure 5
United Technologies Corp.
Warranty Claims & Accrual Rates, 2003-2008
(as a percentage of product sales)
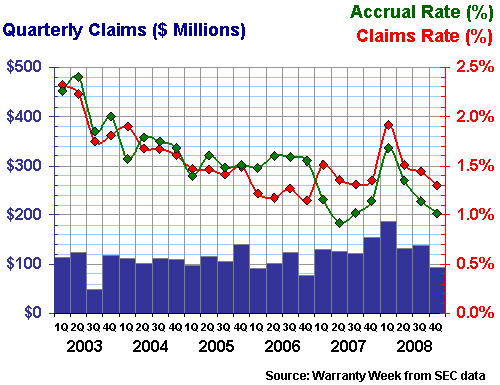
As was mentioned in last week's newsletter, it's impossible for an external observer to reliably separate the warranty costs of Carrier, Sikorsky, and Otis. But the company itself reports that 21% of its revenues were in the civilian aerospace segment, while Carrier was 25% of total revenue and Otis was 22%.
Therefore, one could make a case that with $551 in total warranty claims last year, United Technologies was likely a major player in the provision of warranties in civilian aerospace, air conditioning, and building materials. We're not going to double-count UTC in building materials this week, however. Let's just assume that something on the order of $150 million or more of UTC's total warranty outlays were for elevator repairs, and let's mentally add that into the data in Figure 6 below.
Figure 6
Tools & Building Material Warranty Claims
Worldwide Warranty Claims of U.S.-based Companies, 2003-2008
(claims paid in US$ millions)
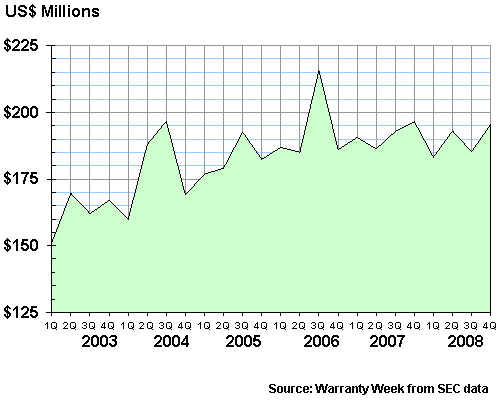
Except for spikes in the third quarters of both 2004 and 2006, the claims total for makers of building materials and tools have been rather stable for the past six years. And if one overlooks that most recent peak, the average quarterly claims total has remained rather close to $190 million for three-and-a-half years. What's truly amazing, however, is that claims actually rose in the fourth quarter of 2008, when the homebuilders were at what one hopes was the very bottom of their industry downturn.
The claims total for the full year of 2008 was actually down a bit from 2007, but as the data in Figure 1 shows, it's been close to $750 million per year for four years. And one can see why expenses are so stable in this industry segment from a glance at the snapshot below of one of its biggest players, Black & Decker Corp.
Figure 7
Black & Decker Corp.
Warranty Claims & Accrual Rates, 2003-2008
(as a percentage of product sales)
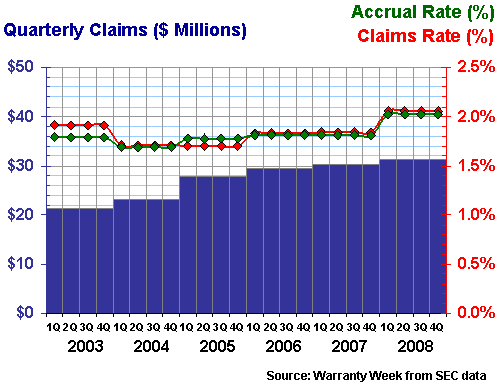
Black & Decker reports its warranty data only once a year, which is part of the reason its data looks so flat. However, in the six annual reports filed with the U.S. Securities and Exchange Commission since 2003, the company has never reported more than an 0.1% difference between its claims and accrual rates, nor have either ever been more than 0.2% away from their long-term average of 1.8%. We suspect that the quarterly data might contain a surprise or two -- maybe even a one-time anomaly like Whirlpool -- but the annual data is as smooth as they come.
Stanley Works, on the other hand, saw its claims and accrual rates dive precipitously during the fourth quarter of 2003. Like a missing tooth, it ruins an otherwise good-looking portrait, as can be seen in Figure 8 below.
Figure 8
Stanley Works
Warranty Claims & Accrual Rates, 2003-2008
(as a percentage of product sales)
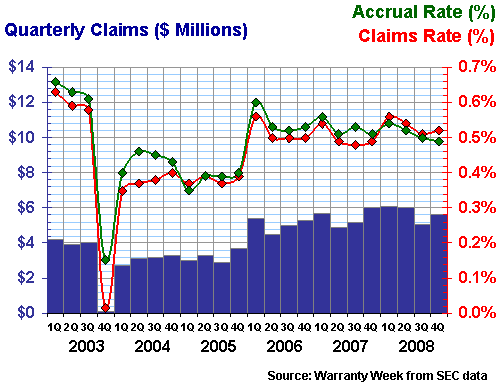
Stanley Works reported $23 million in claims last year; $22 million in 2007; and $20 million in 2006. Its claims and accrual rates have remained amazingly close to 0.5% for most of the past three years, and have never been very far from each other over the past six years. Sales were down 1% in 2008. Even its warranty reserve balance has remained the same over the past few years. Were it not for that notch taken out of the 2003 data, Stanley Works would have an impeccable track record in warranty expense reporting.
Electrical Power Generation Warranties
There's one more sector to spotlight this week: electrical power generation equipment. Warranty Week tracks more than a dozen warranty providers in this category, including Dresser-Rand Group Inc., American Superconductor Corp., Power-One Inc., and Capstone Turbine Corp. But, as is the case in several other sectors, one company utterly dominates the segment.
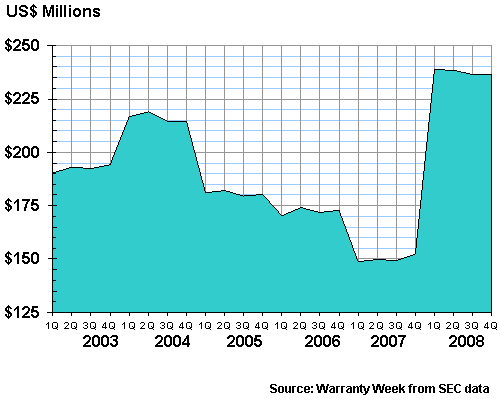
First, let's look at the overall trend. With the stretched vertical scale we're using, it's easy to spot the 2007 decrease and the 2008 increase. Total industry claims fell from $689 million in 2006 to $600 million in 2007, but then jumped by more than half in 2008 to $951 million. So what happened? It can't all be windmills and micro power plants.
Figure 9
Power Generation Equipment Warranty Claims
Worldwide Warranty Claims of U.S.-based Companies, 2003-2008
(claims paid in US$ millions)
The answer is two letters long: GE. General Electric has a major presence in both the appliance and the aerospace industry, and has lately acquired a major stake in medical equipment. All of those industries are warranty-intensive. But GE has always stated that its warranty costs arise primarily from sales of power generating equipment, so we'll take them at their word.
If that's the case, then GE alone accounts for between 95% and 97% of the expenses in Figure 9. Granted, the portable generator revenues of Cummins, Honda, and others aren't included there, nor are many of the hybrid car battery pack manufacturers. But even if they were, GE would still dominate the data, and the slope of the curve in Figure 9 would still look rather similar to the slope of the curve in Figure 10.
GE Nears The $1 Billion Mark
Tomorrow is the day GE is scheduled to reveal its first quarter financials, but if the past six years is any guide, their Friday morning announcement won't contain any warranty information. That's because GE has chosen to reveal this data only once a year, and that's why the lines and bars in Figure 10 look somewhat stair-like. To fit it into a quarterly format, we've taken each annual report and divided it into four pieces, as was done with Black & Decker.
Figure 10
General Electric Co.
Warranty Claims & Accrual Rates, 2003-2008
(as a percentage of product sales)
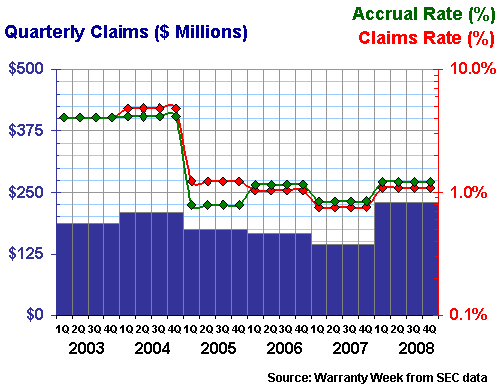
In calendar 2008, GE reported $917 million in warranty claims, a 60% jump from 2007 levels. And that right there accounts for most of the rise seen in Figure 9. But GE also said sales revenue within the Technology Infrastructure and Energy Infrastructure operating segments that account for most of the warranty expenses was up by 13%, so the company's overall claims rate jumped much more modestly, from 0.8% to 1.1% (we don't include revenue from non-warranted sources such as NBC or Universal).
Back in 2003 and 2004, GE's operating segments were organized differently, so the data from those years is largely incomparable to the past four years. As the graph suggests, though, it wasn't so much because of changes in the total warranty costs reported per year as it was a change in how revenue was segmented. Back in 2003 and 2004, GE said warranty expenses arose primarily from the sales of Power Systems, which was just one small part of what's now included in Energy Infrastructure. So the claims rate was higher, simply because it was spread across less revenue.
To get that into the graph, we had to use a logarithmic scale for the claims and accrual rates. That compresses the data somewhat, perhaps making it look like GE's claims and accrual rates have remained very close to one percent since 2005. In truth, though, the rates have remained within a range of 0.8% and 1.2%, which actually is a fairly narrow spread.
In 2009, if GE's sales and warranty expenses increase a bit more, the company could become only the sixth member of the Billion Dollar Warranty Club. To date, only five American companies have ever reported spending more than $1 billion within a single calendar year on warranty claims: GM, Ford, Caterpillar, HP, and Dell. Caterpillar reached this milestone for the first time in 2008, and Dell reached it for the first time in 2005. The other three have been there since before Warranty Week began counting in 2003. So it's a pretty exclusive club.
Go to Part One
Go to Part Two
Go to Part Three
Go to Part Four
Go to Part Five
This is Part Six
Go to Part Seven
Go to Part Eight
Go to Part Nine


