Homebuilders' Warranty Accruals:
Rather than looking at warranty costs as a percentage of sales, would it be valid to calculate warranty costs per home? Using such a metric makes some homebuilders look very precise and consistent, while others look like they're just guessing how much to accrue per home.
The publicly traded homebuilders had a very rough 2008, and come to think of it, 2007 wasn't very good either. Of all the warranty-issuing sectors of the economy, homebuilding is the one that fell first and fell hardest in the current recession.
Is it over? The latest statistics on home sales, prices and building permits say it's not, but take a look below at the chart that tracks warranty claims paid per quarter by the 35 or so largest publicly traded homebuilders.
As can be seen in Figure 1, claims hit a six-year low of $132.7 million during the third quarter of 2008. But in the fourth quarter, claims rose by a whole 0.1% to $132.9 million. Yes, it increased!
Figure 1
New Home Warranty Claims
Worldwide Warranty Claims of U.S.-based Homebuilders, 2003-2008
(claims paid in US$ millions)

A year and a half ago, there was a similar one-quarter increase, but it turned out to be just a ledge that preceded an even steeper fall to follow. Is that what this slight upturn is? Or could it be a sign that we've struck bottom?
Claims for the whole year hit $570 million in 2008, down a sharp 28% from the $797 million counted for homebuilders in 2007. It was the smallest annual claims total for the sector since at least 2003, when Warranty Week began collecting such data from U.S. Securities and Exchange Commission filings. And it made perfect sense, given that unit sales fell by 37% for the top homebuilders. Fewer new homes sold means fewer warranty repairs needed.
Homebuilders' Warranty Accruals
The story on the accruals side was similar. Total accruals fell in lockstep with sales, declining from $671 million in 2007 to $421 million in 2008 -- a 37% decline. That also makes perfect sense, because if homebuilders are setting aside a certain amount of money for each home sold, the amount of money they set aside should rise and fall exactly in parallel with sales.
Most of these homebuilders state in their SEC filings that they set aside a certain amount of funds upon the closing of each home sale, based upon their internal projections of future warranty claims for that unit. In other words, if they believe future warranty claims will equal $1,000 per home, every time they sell a home they'll accrue $1,000. If actual costs turn out to equal $1,200 per home, they'll change their accrual rate per unit accordingly.
Though the total for the whole company will rise and fall with sales, the amount they accrue per home sold should remain more or less the same unless there's been a change in local repair costs or product quality. If they sell a hundred homes, they'll accrue $100,000. If sales fall to 50 units, accruals fall to $50,000. It's always the same amount per unit, as long as costs and quality also stay the same. But does the accrual rate per home really stay the same?
Unit Sales Figures?
With most companies in most industries, it's difficult for an external observer to figure out the amount of warranty cost per unit. With a conglomerate such as United Technologies, it's impossible to figure out how much of their warranty cost is air conditioning and how much is airplanes. With a computer company, one cannot tell how much is printer warranty and how much is for laptops, even if one has unit sales figures for each. Even with Honda Motors, one cannot be sure how much is cars, how much is motorcycles, and how much is generators.
But with homebuilders, all most of them do is build homes. They don't make generators or washing machines. They don't make locomotives or fishing boats. All they do is build homes. And they usually detail exactly how many were built and sold each year. We should note, however, that we excluded three manufacturers of pre-fabricated homes, because their product mixes also included mobile homes and/or recreational vehicles. In past analyses, we've already noted that their warranty ratios seem more at home in the RV or even the heavy truck industry.
Regional Price Differences
Of course, everyone knows that not all homes are the same. They're not all the same size, nor are they the same cost to build. And even if they were all the same size, the sale prices would be different in Silicon Valley versus the Black Hills of Dakota. In warranty terms, the cost of fixing defects in different locations would be quite different, and heat-and-humidity-related issues caused by such problems as mold and Chinese drywall would be more severe down south.
Interestingly, though, the top homebuilders accrued an average of $2,465 per home sold in 2008, and that was up by only $6.00 per unit from the 2007 average. So perhaps, even after allowing for regional differences in price and climate, wealth and repair costs, there is such a thing as a "typical" or an "average" warranty accrual per new home?
More fundamentally, does each company keep the accruals made per sale more or less the same from year to year? Or have they fallen for the temptation to cut accruals to artificially low levels during the lean years when profits are hard to come by, in the hopes that nobody will notice? It's not as obvious a ratio as perhaps earnings per share or sales per retail outlet.
To test our hypothesis, we compared home sales to accruals for the past six years, and found that while roughly half the homebuilders do in fact keep their accrual rate per unit within a fairly narrow and predictable range, the other half allow it to drift far above and far below their long-term averages. That's not to say they're manipulating accruals. They're just doing a really poor job of regulating them.
Differing Terminology
There were a few problems encountered in the process. First of all, every company seems to use a different term for the sale of a home. Pulte calls them both "unit settlements" and "homebuilding settlement units." NVR uses just the word "settlements." Toll Brothers variously counts "completed contracts" or "closings," and other times uses just the word "units." Beazer Homes refers to "closings" and to "number of closings." D.R. Horton lists "homes closed." Centex counts "units closed." Lennar quantifies the "number of homes delivered." Meritage counts the "number of homes closed." Hovnanian Enterprises and KB Home use an even simpler label: "homes delivered," though in earlier years KB Home also used the term "unit deliveries" or the even more vague label of "deliveries."
No matter what they call it, most of the companies explicitly said they calculate their warranty accrual right after the closing. So if a home is built but not yet sold, or is paid for but not yet built, there hasn't yet been a warranty accrual made.
The second problem was the different fiscal years followed by the builders. Pulte and Meritage follow the calendar and end their fiscal years on December 31. Lennar and KB Home end their fiscal years on November 30. Toll Brothers and Hovnanian end their fiscal years on October 31. For all six companies, however, we adjusted the data so their fiscal quarters matched the calendar quarters in which their fiscal quarters ended. In other words, anything ending in October, November or December was assumed to be the fourth quarter.
Then there were the companies that followed other schedules. D.R. Horton and Beazer Homes end their fiscal years on September 30, so what they call their first fiscal quarters corresponds to the fourth calendar quarter on our charts. Centex ends its fiscal year on March 31, so its third fiscal quarter corresponds to the fourth calendar quarter of each year on our charts.
Accruals per Home Sold
For each of the nine charts that follow, we gathered the sales figures and warranty accruals for the past 24 quarters. The purple columns represent total accruals, in millions of dollars per quarter. The dark blue line represents accruals per home sold, in thousands of dollars per unit.
D.R. Horton, we found, was by far the most consistent homebuilder in terms of predictable accruals per unit sold. Over the past six years, accruals per unit were always between $977 and $1,726, and ended 2008 only $100 below the level at which they began 2003. The accrual rate per dollar of revenue was even more consistent, never straying very far above or below 0.5% of homebuilding revenue over the past six years.
Figure 2
D.R. Horton Inc.
Warranty Accrual Totals & Per Home Sold, 2003-2008
(in $ millions per quarter & per home)
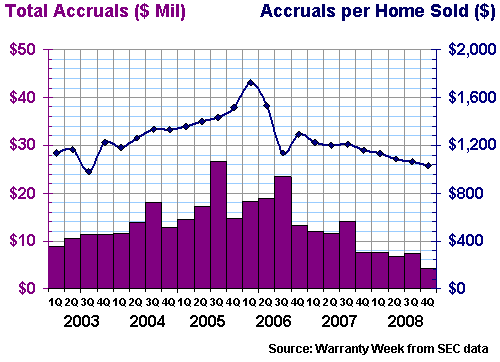
In other words, D.R. Horton proves the theory that a well-regulated warranty program can keep both accruals per dollar and accruals per home within a narrow range, even as sales soar, peak, and plummet. Revenue was down 45% last year, yet accruals remained at exactly 0.47% of revenue.
Lennar was almost as consistent. It accrues significantly more money per home sold than D.R. Horton, but as Figure 3 attests, it has kept the average accrual per unit amazingly close to $3,000 for the past two years.
Figure 3
Lennar Corp.
Warranty Accrual Totals & Per Home Sold, 2003-2008
(in $ millions per quarter & per home)
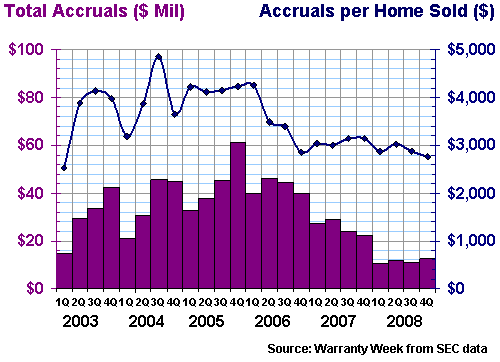
The highest accrual rate per home was $4,864, set in late 2004, and the lowest was $2,530, set in early 2003. Those quarters also correspond to peaks and troughs in the company's accrual rate per dollar of revenue -- 1.75% and 0.99%, respectively. Since early 2006 accruals per dollar have remained relatively flat at 1.0% to 1.1%. It's as if the company settled down and became consistent after a bit of fluctuation.
Another relatively consistent company is Toll Brothers. This company sells even higher-priced homes, and accrues even more per unit than D.R. Horton or Lennar. But it's just as consistent at that higher level. As Figure 4 shows, Toll Brothers have kept their accrual rate per unit very close to $4,400 over the past six years, though it has gone as high as $5,782 and as low as $3,581.
Figure 4
Toll Brothers Inc.
Warranty Accrual Totals & Per Home Sold, 2003-2008
(in $ millions per quarter & per home)
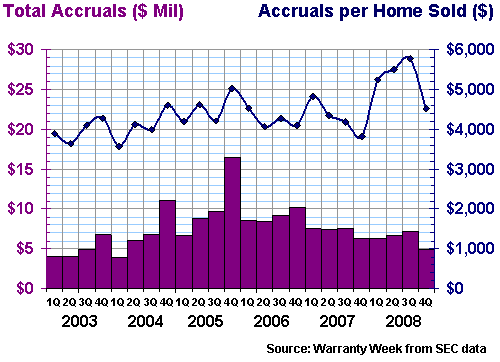
Expressed as a percentage of revenue, Toll Brothers has kept its accrual rate very close to 0.7% over the years, although in 2008 it rose as high as 0.9%. Sales were down 31% last year in dollars and were down 29% in units sold.
Next we get to the middle three in terms of consistency. In fact, Pulte Homes (Figure 5) is set to acquire Centex (Figure 6) in an all-stock deal said to be worth $1.3 billion, so it will be interesting to see how they combine their somewhat erratic warranty ratios.
In dollar terms, Pulte has seen a rising claims rate and a falling accrual rate in recent years, and as Figure 5 shows, its track record in terms of units is no better. At the end of 2006 it was accruing $4,087 per home sold. By the end of 2008, it was accruing only $1,703 per home.
Soaring quality? Shorter warranties? A new get-tough policy with sub-contractors? Not at all. Claims were $2,828 per home at the end of 2008, meaning there was a shortfall of over $1,000 per home that had to come out of reserves.
Figure 5
Pulte Homes Inc.
Warranty Accrual Totals & Per Home Sold, 2003-2008
(in $ millions per quarter & per home)
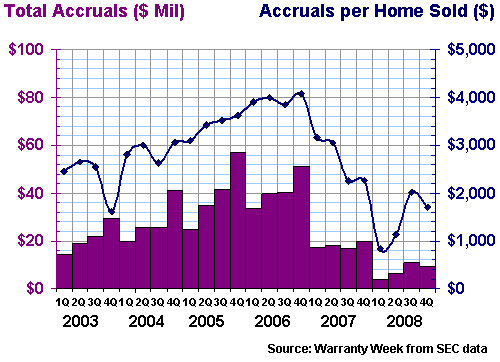
Centex was not much better. In fact, as Figure 6 suggests, accrual rates per unit at Centex seemed much more random, jumping from $512 per home to $1,482 per home in early 2007, and falling as low as $454 per home in early 2008. It actually looks better when calculated as a percentage of revenue, which is perhaps the point: it doesn't seem to be as proportional to units sold as it is to sales revenue. And it doesn't appear that Centex "estimates the costs that may be incurred under its warranty program for which it will be responsible and records a liability at the time each home is closed," as it states in its annual report.
Figure 6
Centex Corp.
Warranty Accrual Totals & Per Home Sold, 2003-2008
(in $ millions per quarter & per home)
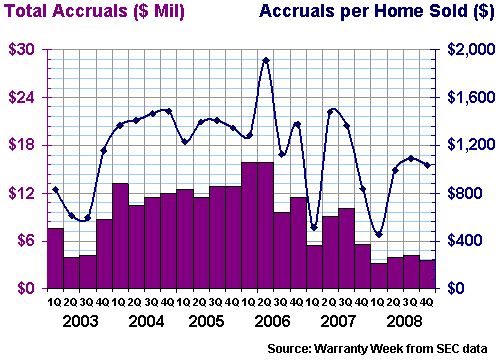
Meritage, unfortunately, just reported its highest claims rate of the past six years: 1.2% of revenue. And its accrual rate as a percent of sales was a full half a point lower. That's the bad news. The good news is that the year-ending bounce in accruals per unit sold seems to have ceased in 2008, as can be seen in Figure 7.
Figure 7
Meritage Homes Corp.
Warranty Accrual Totals & Per Home Sold, 2003-2008
(in $ millions per quarter & per home)
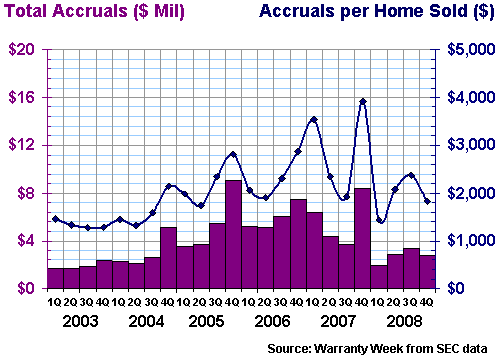
Meritage seems to be chasing after the same middle class accrual rates as Lennar and Pulte, but it needs to work on its aim. At the end of 2007 it accrued $8.4 million for 2,139 homes sold -- an accrual rate of $3,926 per unit. But in the very next quarter it sold 1,328 units and accrued only $1.9 million -- $1,441 per unit. Were those homes really more than twice as good as the ones sold a few months before?
The thing is, the six companies profiled in Figures 2 to 7 are the most consistent of the bunch. Now we get to the really random few. Hovnanian Enterprises, in Figure 8, has accrued as much as $10,813 per home sold. KB Home, in Figure 9, has accrued as little as $0 per home sold. But Beazer Homes beats them both, accruing almost $15,000 per home in one quarter and accruing nothing in three other quarters.
Figure 8
Hovnanian Enterprises Inc.
Warranty Accrual Totals & Per Home Sold, 2003-2008
(in $ millions per quarter & per home)
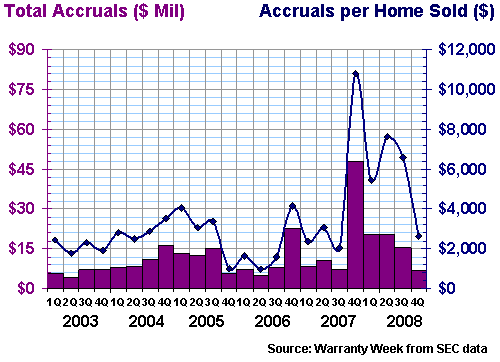
There's no mention of why Hovnanian accrued $48 million in the fourth quarter of 2007 in the company's annual report. There was a lengthy explanation of how expensive liability insurance had become that year, and how difficult it was for some of its sub-contractors to secure coverage. But there was no mention of any special crisis -- with mold or lawsuits or something else out of the ordinary.
Accruals jumped from $43.1 million in fiscal 2006 to $74.0 million in fiscal 2007. Sales actually fell from 20,201 units in fiscal 2006 to 14,928 units in fiscal 2007. The result is a more than doubling of the company's accrual rate, expressed as both a percentage of sales and per unit sold. One would think this would merit at least a mention in the annual report.
KB Home reported no net claims and no net accruals in the fourth quarter of 2007. However, modesty evidently prevented the company from announcing that breakthrough in its annual report last year, just as there was no mention of the tremendous year-end spike in the 2006 annual report.
In Figure 9, one can see the resulting notch in the data, showing $0 accruals per home (flawless construction) in the fourth quarter of 2007, and $4,915 per home (twice the average) in the fourth quarter of 2006.
Figure 9
KB Home
Warranty Accrual Totals & Per Home Sold, 2003-2008
(in $ millions per quarter & per home)

Lately, homebuilders have become more pro-active about mentioning how they're dealing with unusual warranty problems in their homes, such as health problems caused by exposure to mold or to the fumes allegedly given off by drywall imported from China. Some homebuilders have discussed in print how they created special reserve funds to pay these extraordinary expenses, much as some of the automakers do for massive recalls or product liability lawsuits.
The point is, if some unusual event causes warranty costs to suddenly soar, the companies are disclosing it. In these cases, we get the feeling that the companies are simply hoping nobody has a calculator handy. The numbers for warranty, revenue, and units sold are in different sections of the annual reports, and while it's not exactly rocket science to compare them, it's also not trivial.
For instance, back in Beazer Homes' first quarter 2005 financial report, the company explained in detail how a subsidiary named Trinity Homes LLC was facing multiple lawsuits over "external water intrusion issues." One of them, a class action lawsuit, was headed towards settlement with 1,311 valid claims received before the court-imposed deadline. Some of those claims were to be settled with buy-backs, which of course would be tremendously expensive.
In Figure 10 below, the huge spike in accruals per unit seen in 2005 is almost entirely caused by this issue. The company set aside $45 million that quarter specifically to pay the Trinity claims, but it sold only 3,602 units that quarter. So of course accruals per home sold soared to unprecedented heights.
Figure 10
Beazer Homes USA Inc.
Warranty Accrual Totals & Per Home Sold, 2003-2008
(in $ millions per quarter & per home)
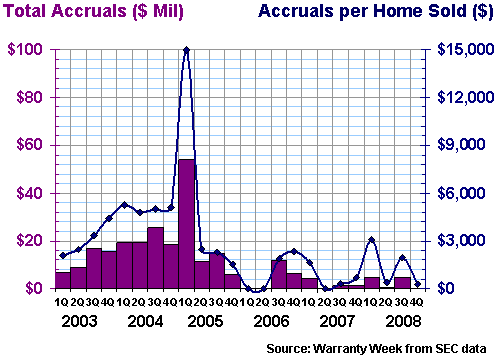
The lingering question, however, is why have accruals per home sold been so up-and-down ever since? In the past three years, there have been three quarters at $0, three more below $400, and five quarters above $1,600 per home. Surely, the quality level of Beazer's homes is not following this trend. So why are accruals?
Bottom line, the consistent track record of five or perhaps six homebuilders suggests that accruals per unit sold is a valid measure in this market, despite the regional variability of home prices and repair costs. And the inconsistent track record of three or four homebuilders suggests that contrary to the methodology they allege to use when determining accruals, sometimes they're really just guessing.
Go to Part One
Go to Part Two
Go to Part Three
Go to Part Four
Go to Part Five
Go to Part Six
This is Part Seven
Go to Part Eight
Go to Part Nine


