Annual Warranty Totals & Averages:
While claims were up slightly in 2008, both warranty reserves and accruals actually plunged last year. And as sales fall, the percentage of product revenue spent on claims has risen. With no less than 21 charts, we detail the industry totals and averages for the past six years.
In the past seven newsletters, we've toured the warranty world from one end to another, looking at the biggest players and the most warranty-intensive industries. This week, we're going to wrap it up with a look at the overall totals and averages.
What we intend to do this week is provide readers with six charts in the regular newsletter and links to at least 15 additional related charts on a separate Web page. That way, we won't test readers' tolerance for graphics but we will still make the entire story available to those who are interested.
Declining Rate of Increase
Notice in Figure 1 below that the rate of increase from one year to the next is declining. While in every year since 2004 U.S.-based manufacturers have spent more on claims than they did the year before, the total was up less than one percent from 2007 to 2008.
Figure 1
Worldwide Warranty Claims of U.S.-based Companies
(claims paid in US$ millions, 2003-2008)


The equivalent charts tallying up the equivalent totals for warranty accruals and warranty reserves are included below. Figure 1b, for instance, details how American manufacturers actually accrued 9% less in 2008 than they did in 2007. That's a much more immediate reaction to the downturn in sales.
Figure 1b
Worldwide Warranty Accruals of U.S.-based Companies
(accruals made in US$ millions, 2003-2008)
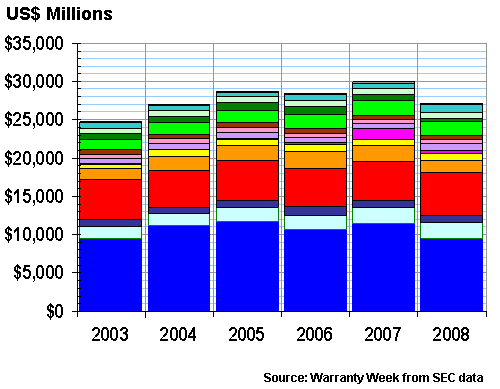

The dollar figures for accruals were $29.9 billion in 2007 and $27.2 billion for accruals in 2008. So the decline amounted to an astonishing $2.77 billion from one year to the next. In comparison, the only other annual decline that we have on record for accruals was the $271 million reduction tabulated from 2005 to 2006.
The biggest declines in accruals were turned in by makers of consumer electronics, new homes, telecom equipment, and automotive OEMs. These were also the industries most impacted by downturns in sales, so perhaps it's not such a surprise. There were, however, several industries that actually increased accruals, including the makers of power generation equipment, data storage systems, medical equipment, and computers. So while accruals were down overall, they weren't down for every industry or every company.
Massive Decline in Reserves
In Figure 1c, we've charted the year-ending warranty reserve balances reported by all the companies in each industry. As is obvious, there was also a massive decline in reserves in 2008, with the overall year-ending balance of $37.9 billion falling below the totals seen at the ends of 2007, 2006 or even 2005. And that, as far as we can tell, is the first annual decline in warranty reserves ever reported and recorded (however, there was of course no warranty expense reporting during the last recession).
Figure 1c
Worldwide Warranty Reserves of U.S.-based Companies
(year-end reserve balances in US$ millions, 2003-2008)
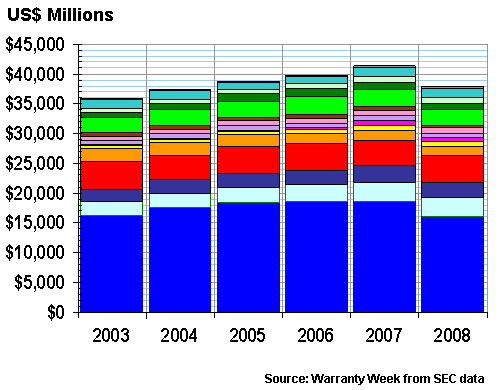

The same four industries -- consumer electronics, new homes, telecom equipment, and automotive OEMs -- showed the biggest annual declines in reserves. And the makers of power generation equipment, data storage systems, computer OEMs, and semiconductor/printed circuit companies were the only industries to register any increase at all in warranty reserve balances from the end of 2007 to the end of 2008.
Warranty "Market" Share
In the April 10, 2008 and May 8, 2008 newsletters, we published a series of pie charts for claims, accruals, and reserves during the five years between 2003 and 2007. Figures 3a, 3b and 3c should be considered to be the latest members of those collections. Figure 3a below was also part of the May 7, 2009 newsletter, while Figures 3b and 3c are exclusive to this 2008 Special Report.
Figure 3a
All U.S. Manufacturers
Claims Paid per Industry, 2008
(as a % of $28.7 billion total)


The share of all warranty claims paid by companies in just the reddish "high tech" sector rose slightly in 2008 from years past. Since 2004 these sectors have always paid 35.2% to 35.6% of all warranty claims paid by all industries. But in 2008 that share rose to 35.7%, mostly because of the corresponding falloff seen in the "buildings" sector.
The "high tech" share of accruals rose by even more. This sector accounted for 38.5% of the accruals made by all manufacturers last year, up from 37.2% in 2007 and 35.8% in 2006. And their share of all industries' warranty reserves has also risen, from 23.5% in 2006 and 24.0% in 2007 to 24.8% in 2008.
Meanwhile, the share of claims paid for by companies in the bluish "vehicles" sector was relatively unchanged at 49.3% in 2008. Their collective share was 49.2% of $28.5 billion in 2007 and 49.4% of $28.0 billion in 2006. The "vehicle" share of accruals, however, fell radically in 2008, to only 46% from 48.5% in 2007.
The "buildings" sector shrank its share of claims, but grew its share of both accruals and warranty reserves. This sector saw its share of claims slip from 14.9% to 14.4%. Its share of accruals grew from 13.7% to 15%. And its share of reserves grew from 16% to 16.9%.
Figure 3b
All U.S. Manufacturers
Accruals Made per Industry, 2008
(as a % of $27.2 billion total)
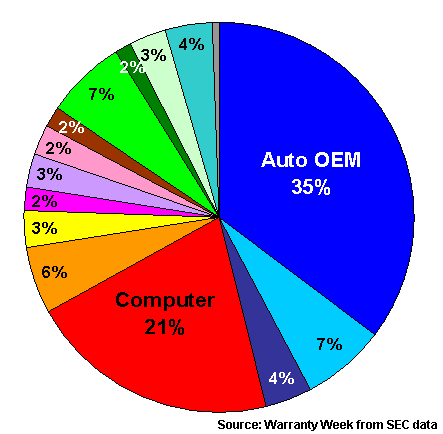

Neither the April 10, 2008 newsletter nor its supplemental report included any details on the "market share" of warranty reserves by industry. Instead, those pie charts were included in a separate report published on May 8, 2008, which is hereby updated by Figure 3c below.
Notice how in comparison, the automotive OEMs have more reserves and the computer OEMs have less reserves than their relative shares of claims and accruals portrayed in Figures 3 and 3b. While both product types generate relatively high warranty costs, automobiles generally do so for longer periods than computers, and manufacturers of cars generally maintain larger reserve funds than do the computer OEMs.
Figure 3c
All U.S. Manufacturers
Reserves Kept per Industry, 2008
(as a % of $37.9 billion total)
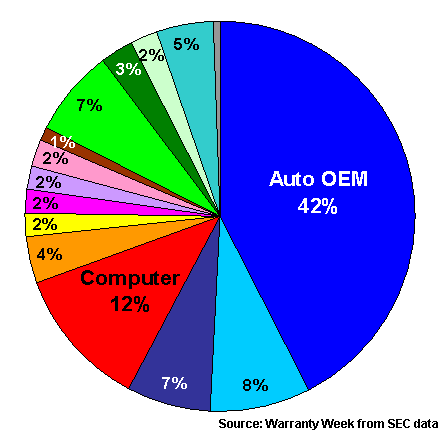

It's no surprise to discover that some of the same industries that saw the biggest dollar declines in reserves (Figure 1c) also saw the biggest percentage declines (Figure 3c). Automotive OEMs saw their share of reserves fall from 45% to 42%, and that was by far the biggest change in absolute terms. But the makers of consumer electronics and new homes actually shrank their reserves by more in relative terms: consumer electronics from 2.5% to 1.9% and new homebuilders from 3.0% to 2.6%.
The biggest increases in reserves, meanwhile, were turned in by the computer OEMs (10.3% in 2007 to 11.9% in 2008) and the makers of power generating equipment (3.8% in 2007 to 4.6% in 2008). Overall, nine industries had higher reserve levels in 2008, while six had lower year-ending reserve balances.
Warranty in the Vehicle Sector
In Figure 4 below, the dollar amounts reported during the past six years for claims in the three "vehicle" industries are detailed. Notice the slight decline in claims paid by the automotive OEMs. That probably has much to do with the sale of the Land Rover and Jaguar divisions by Ford, as well as the general decline in sales volumes recently affecting all automakers.
Figure 4
Warranty Claims in Automotive & Aerospace
Worldwide Claims Paid by U.S.-based Companies
(claims paid in US$ millions, 2003-2008)

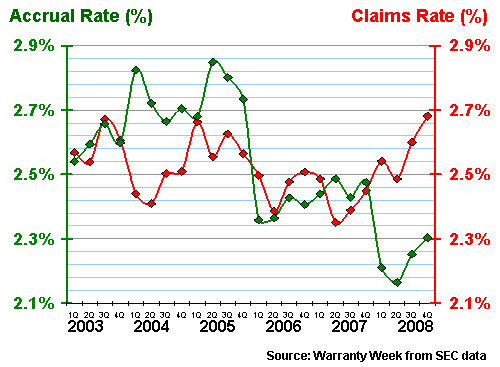
In Figure 4b below, the most curious development is the recently falling accrual rate and the recently rising claims rate. We think the causes are several. For falling accruals, we have 1) rising product quality and therefore 2) reduced future demands for warranty work, and also 3) the sale by Ford of the high-cost Land Rover and Jaguar units to a foreign buyer. For rising claims rates, we have 1) the severe downturn in sales combined with the 2) lag time between sales revenue and warranty expense, as well as 3) lengthening warranties used as marketing tools.
Diverging Averages in Late 2008
The most sobering thoughts of all is that industry average claims rates were never higher than they were in late 2008, and average accrual rates were never lower than they were in early 2008. Given the promises extended by the U.S. government to back warranties in the event of bankruptcies, we worry that some of the automakers may not be adequately financing their current guarantees.
Figure 4b
All Automotive OEMs
Average Warranty Claims & Accrual Rates
(as a percentage of product sales, 2003-2008)
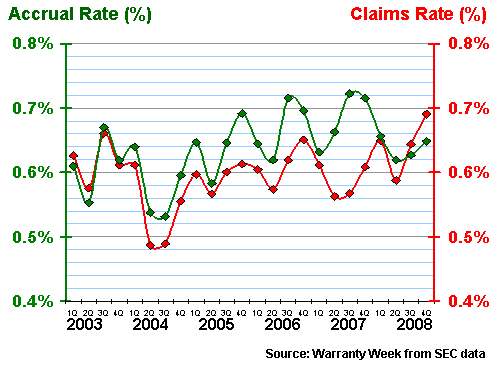
In the March 19 newsletter, Figure 2, we expanded upon the gap in average claims rates between auto OEMs and their suppliers. Here in Figures 4b and 4c, that gap is apparent in both warranty claims rates and warranty accrual rates. Parts suppliers have seen their average claims rates rise to just under 0.7%, but the gap with OEMs has actually widened from 1.9% to just under 2.0%.
Figure 4c
All Automotive Parts Suppliers
Average Warranty Claims & Accrual Rates
(as a percentage of product sales, 2003-2008)
Aerospace warranty trends were covered in the April 9 newsletter. Notably, the gap between OEMs and suppliers that was found in automotive was not found in the aerospace industry, as was detailed in Figure 3 in that newsletter.
Below, the apparent trend in aerospace warranty costs as a percentage of revenue is clearly down. There was an upturn in claims rates in late 2008, but it was not confirmed by an upturn in accrual rates. That means it probably had more to do with a decline in sales than any change in costs or quality.
Figure 4d
All Aerospace Companies
Average Warranty Claims & Accrual Rates
(as a percentage of product sales, 2003-2008)
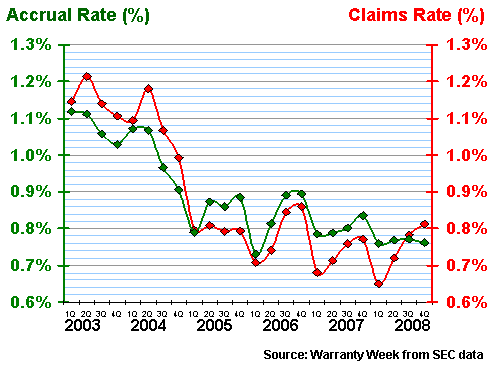
Also, please note how the claims record in aerospace seems to have taken on a seasonal pattern during the last three years. Claims peak in the fall and trough in the winter. While this pattern is also somewhat evident in the accrual rates, we believe it is more coincidental than deliberate.
Warranty in the High Tech Sector
In the high tech electronics industries listed in Figure 5, last year was relatively quiet. The computer OEMs have kept their claims cost relatively stable as sales rose (at least until late in the year). The telecom equipment vendors (primarily Motorola) are reducing their warranty costs. Disk drive, semiconductor and peripheral manufacturers saw little movement in either their totals or their averages. And in the consumer electronics segment, Microsoft has finally gotten over the worst of its Xbox 360 debacle. All of those trends are visible in the next six charts.
Figure 5
Warranty Claims in the High-Tech Industries
Worldwide Claims Paid by U.S.-based Companies
(claims paid in US$ millions, 2003-2008)

The warranty costs of the computer, data storage, and semiconductor/printed circuit board segments of the high-tech sector were covered in the March 26 newsletter. For computer makers, claims and accruals counted in dollars have been rising. But as Figure 5b shows, claims and accruals as a percentage of product revenue have been falling. In other words, sales have been rising faster than warranty costs.
Figure 5b
All Computer Manufacturers
Average Warranty Claims & Accrual Rates
(as a percentage of product sales, 2003-2008)
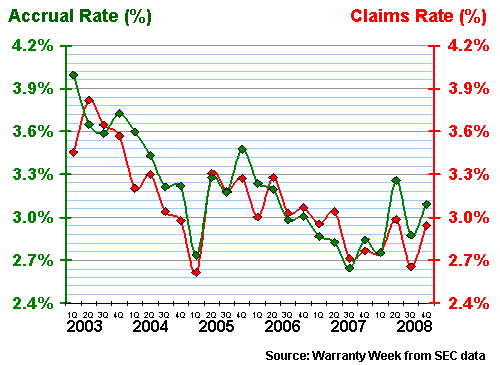
Much the same pattern can be seen in the data storage sector. Claims and accruals as measured in dollars rose, but fell as a percentage of revenue. The claims dollar total in 2007 was $560 million, and was $561 million in 2008. The accrual total was $548 million in 2007 and $622 million in 2008. However, as Figure 5c illustrates, both the claims and accrual rates were lower in 2007 than they were in either 2003-2006 or 2008. So while the multi-year trend is down, the single-year trend is up.
Figure 5c
All Data Storage Manufacturers
Average Warranty Claims & Accrual Rates
(as a percentage of product sales, 2003-2008)
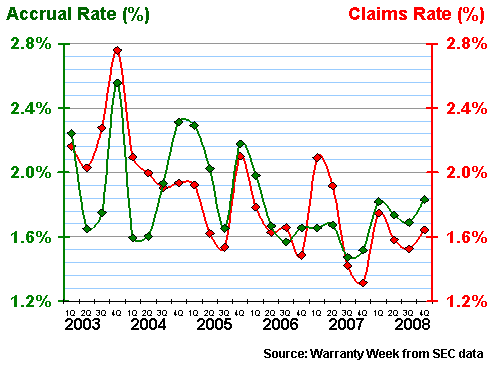
For 17 consecutive quarters and counting, semiconductor equipment and printed circuit board manufacturers have paid out between $175 million and $200 million per quarter in warranty claims. This can be seen in Figure 7 in the March 26 newsletter. As Figure 5d details on this page, this amount has usually represented a little more or a little less than one percent of their total product revenue. But it's always a little more at the end of the year than it is in the other three quarters. This seasonal pattern has no ready explanation.
Figure 5d
All Semiconductor & Printed Circuit Manufacturers
Average Warranty Claims & Accrual Rates
(as a percentage of product sales, 2003-2008)
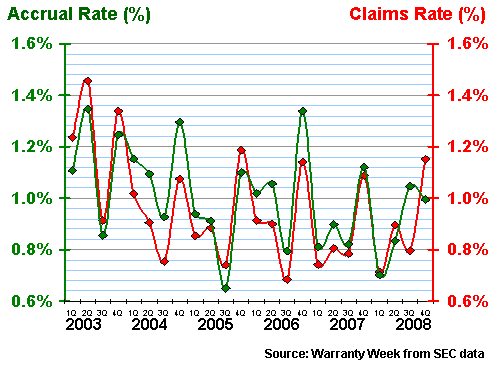
Telecom, medical, and scientific equipment warranties were covered in the April 2 newsletter. In that analysis, we found that the telecom numbers were heavily weighted by the warranty experience of Motorola Inc. Dollar costs peaked in 2006 and fell in the years since. That trend is more or less also evident in the data of Figure 5e, which calculates the dollars spent on warranty as a percentage of product revenue.
Figure 5e
All Telecom Equipment Manufacturers
Average Warranty Claims & Accrual Rates
(as a percentage of product sales, 2003-2008)
In the medical/scientific warranty sector, claims and accrual rates have been closely tracking each other up and down over the last six years, as can be seen in Figure 5F. For some reason, the rates always seem to be highest in the summer and lowest in the first half of each calendar year. In terms of dollars, the biggest spikes for claims paid came in the third quarters of 2005 and 2008, as can be seen in Figure 6 in the April 2 newsletter. There's no apparent reason for this apparent seasonality either, but its presence cannot be denied.
Figure 5f
All Scientific & Medical Equipment Manufacturers
Average Warranty Claims & Accrual Rates
(as a percentage of product sales, 2003-2008)
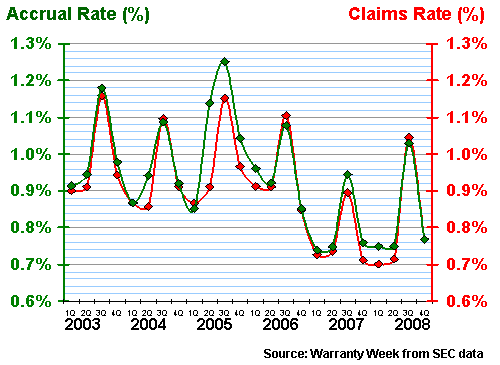
In the medical equipment industry and perhaps also in the semiconductor industry, there doesn't yet seem to be anything approaching a benchmark. Despite there being hundreds of companies counted in each industry, and no major players (like GE, Microsoft or Motorola) whose warranty costs skew the overall averages, there's not much tranquility in Figures 5e or 5f.
Warranty in the Building Sector
Figure 6
Warranty Claims in the Building Trades
Worldwide Claims Paid by U.S.-based Companies
(claims paid in US$ millions, 2003-2008)

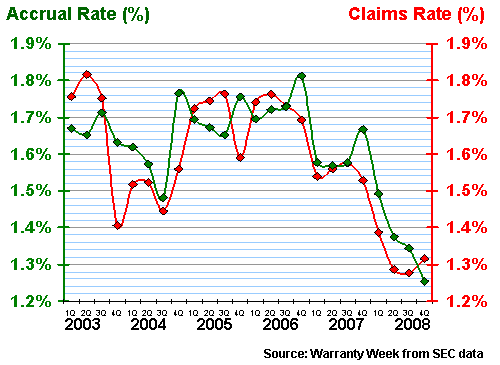
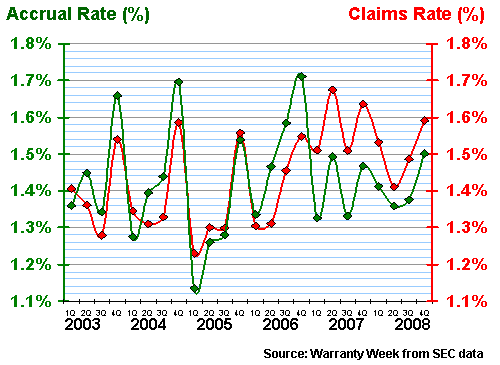
Appliance and HVAC manufacturers not only paid out the most in 2007, they also paid out the highest percentage of their sales revenue that year. Their average accrual rate rose above 1.7% at the end of 2006, and their average claims rate remained above 1.5% throughout 2007. Figure 6b also shows how, while they haven't always moved together, the average claims and accrual rates have at least moved in the same direction from one quarter to the next.
Figure 6b
All Appliance & HVAC Manufacturers
Average Warranty Claims & Accrual Rates
(as a percentage of product sales, 2003-2008)
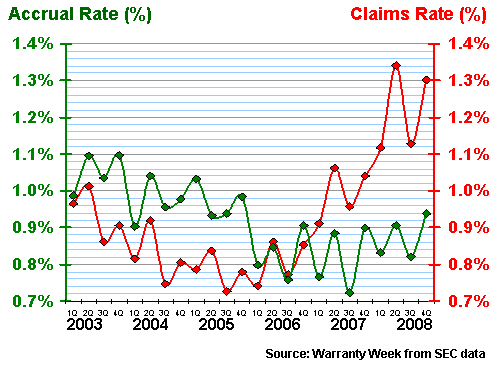
Homebuilders were examined in detail in the April 23 newsletter, including a computation of accruals per home sold that revealed how some companies seemed to be changing their accrual rates as sales slowed. Figure 6c shows how claims have risen while accruals have fallen, leading to a significant gap between the two in 2007 and 2008. At some point, either the claims rate will have to come down or the accrual rate will have to go up. Otherwise, the industry will run out of money to pay claims. Then again, some of these companies have seen sales fall so far and so fast that warranty is probably very far down their list as they battle to survive.
Figure 6c
All New Homebuilders
Average Warranty Claims & Accrual Rates
(as a percentage of product sales, 2003-2008)
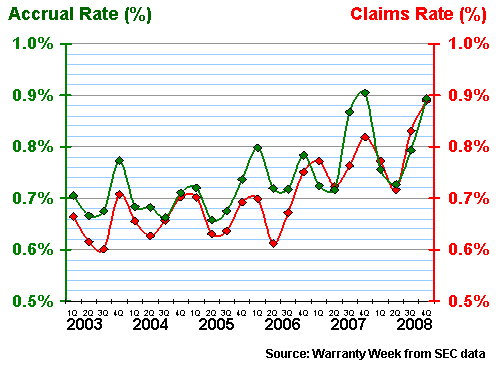
The makers of fixtures, furniture and building materials have also seen their warranty claims rates rise in recent years. But notice in Figure 6d how their accrual rates have kept pace with that upward trend. In the fourth quarter of 2008, their average claims and accrual rates were within 0.004% of each other. And they've never been more than 0.11% apart.
Figure 6d
Fixture, Furniture &Building Materials
Average Warranty Claims & Accrual Rates
(as a percentage of product sales, 2003-2008)
Had the vertical scale not been stretched so much in these charts, some of them would have looked more like straight lines. So perhaps this stretching of the axis makes them look more chaotic than they really are? For instance, as much as the appliance averages go up and down, they seem to always stay close to 1.5%. So perhaps what's needed to produce a useable benchmark is to take the average of an average?
Go to Part One
Go to Part Two
Go to Part Three
Go to Part Four
Go to Part Five
Go to Part Six
Go to Part Seven
Go to Part Eight
This is Part Nine


