

Computer Industry Warranties:
For most of the major players, sales declines caused relative warranty costs to increase. Turmoil in other industries caused a major PC maker to become the biggest warranty provider in the U.S. And for the lucky few, sales rose and warranty costs fell, despite a tough market full of customers still reluctant to spend.
Quick Question: Who is the largest warranty provider based in America?
Trick Answer: Because General Motors Company is now government-owned and no longer trades shares on Wall Street, and because the Ford Motor Company has reduced its warranty cost so tremendously in recent years through a combination of quality gains (good) and sales declines (bad), the dubious title of America's Largest Warranty Provider has at least temporarily passed to the Hewlett-Packard Company.
In the six months ended April 30, 2009, HP reported $1.293 billion in warranty claims costs. In the six months ended June 30, 2009, Ford reported only $1.259 billion in claims costs. And although the old GM reported only its first quarter warranty costs before sinking beneath the waves, the $917 million it spent on claims during January, February, and March are enough to earn it a third place finish for the year to date.
Turn of the Century
It's similar to the torch-passing that occurred when first Ford lost the U.S. market share contest to a non-U.S. firm and then GM lost the worldwide market share title. However, this time we're talking more in terms of the passing of the manufacturing torch from vehicles to computers. While in the late 20th century the world's largest warranty providers were U.S.-based car companies, now in the early years of the 21st century it's the U.S.-based high-tech manufacturers' turn to dominate the statistics.
The ultimate irony is that in strict dollar terms, HP's warranty claims costs actually fell 10% from the same period a year ago. But Ford's fell by 23% since a year ago, when measured in dollars alone, and of course GM went through bankruptcy and then into government hands, so it stopped reporting its financials entirely. But it's still paying claims. So indirectly, does that make the U.S. Department of the Treasury the world's largest warranty provider and insurance company?
By the way, across all industries, Dell Inc. would be in fourth place and Caterpillar Inc. would be in fifth place in our dollar-based warranty rankings. And on a worldwide basis even with the absence of GM, the cash flow associated with auto warranties still exceeds high-tech warranties by a wide margin.
But this week we want to talk about just the computer manufacturers, and the disk drive and storage system vendors that supply them. Within that industry, HP and Dell have always been in the top spots, or they have since at least 2003, when warranty reporting first began.
Falling Sales, Rising Claims Rates
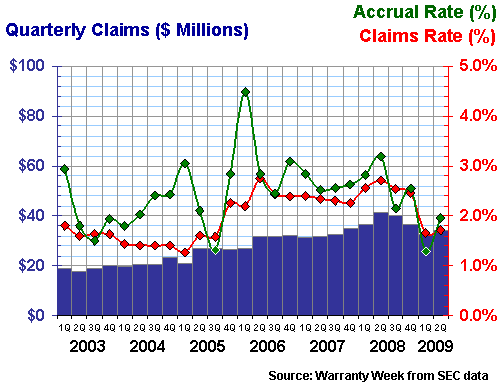
As can be seen in Figure 1, HP's claims rate has climbed from 3.3% to 3.8% in the year ended April 30. But wait, didn't we just say their claims were down 10%? Yes, they are down by 10%, in dollar terms. But as a percentage of product sales, because product sales fell by 23% over the same period, the claims rate rose.
HP's accrual rate remained about the same over the past year, however. If product quality stays around the same, and if the product mix remains about the same, and if product repair costs remain around the same, then so should the accrual rate. Actually, for HP it fell from 3.7% to 3.6%, but as Figure 1 shows, it's remained close to that narrow range for about a year and a half.
Figure 1
Hewlett-Packard Co.
Warranty Claims & Accrual Rates, 2003-2009
(as a percentage of product sales)
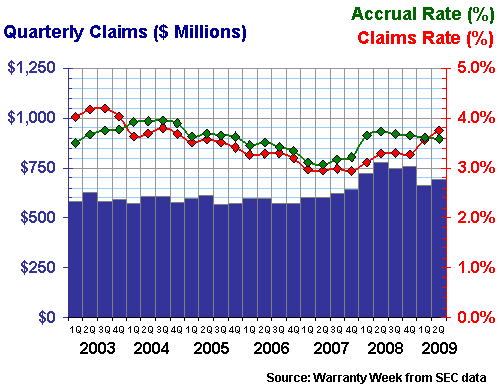
HP has also allowed its warranty reserve to shrink over the past year, from $2,555 million at April 30, 2008 to $2,391 million at April 30, 2009. HP's fiscal year ends on October 31, so rather than time-shift all their data a month into the past (so that its fiscal fourth quarter maps to the calendar third quarter), we've instead chosen to time-shift the data two months into the future (so that a fiscal quarter ending April 30 corresponds to the second calendar quarter).
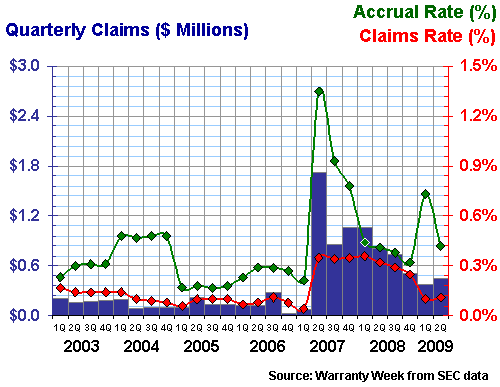
Dell, meanwhile, ended its fiscal year on January 30, so the data in Figure 2 below takes us through May 1, 2009 -- the end of their first fiscal quarter. Basically, whatever calendar quarter a company's fiscal quarter ends in is what we call that report, except in cases where companies choose to end on the weekend (Jan 3, April 1, etc.) after the end of the calendar quarter.
Recession Impact
Dell's first fiscal quarter report showed the impact of the recession quite clearly. Warranted product sales were down by 31%, but claims remained about the same. The predictable result, because the claims rate equals claims divided by sales, is a radical rise in the claims rate. As Figure 2 shows, it jumped from 2.0% a year ago to 3.2% on May 1, 2009. Ouch.
Figure 2
Dell Inc.
Warranty Claims & Accrual Rates, 2003-2009
(as a percentage of product sales)
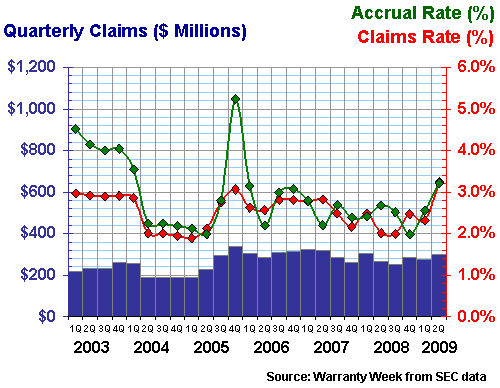
Dell also raised its accrual rate, from 2.7% to 3.2%, and also allowed its product warranty reserve to expand from $1,014 million on May 2, 2008 to $1,032 million on May 1, 2009. But as is apparent in Figure 2, the quarterly claims total as measured in dollars (the blue bars) has hardly varied over the past four years. Seven of the 16 quarters since April 29, 2005 were a little above $300 million and nine were below, but none were more than $50 million away from that midpoint.
Nothing to Worry About?
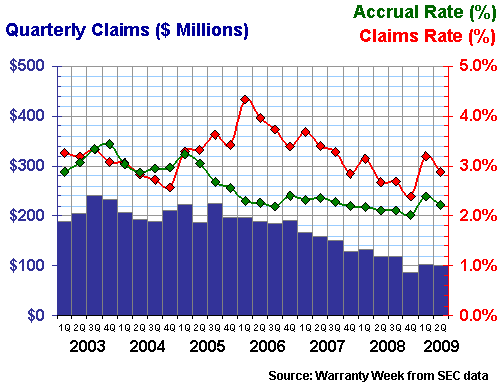
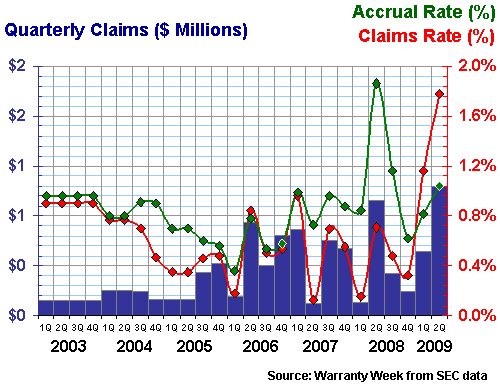
If you're looking for massive and meaningful change in warranty costs, look no further than IBM and Apple. In Figures 3 and 4, the respective downward trends for warranty costs at each company continues, though IBM did suffer from a bit of recession-induced sales declines and rate increases this year.
At IBM, claims costs fell by $49 million, or 19%, to $204 million in the first half of 2009. But product sales fell by 25% during the same period. So the company's claims rate rose from 2.7% in the middle of 2008 to 2.9% in the middle of 2009. We hate to say it's nothing to worry about, but as Figure 3 shows, the claims rate was 3.4% two years ago and 4.0% three years ago. In the computer business, claims rates under 3% are nothing to worry about.
IBM's accrual rate is also up, but only because accruals didn't fall as fast as sales. While sales of warranted hardware fell by 25%, accruals for that warranted hardware fell by only 21%, so the accrual rate percentage climbed slightly. Again, there's nothing to worry about. That accrual rate has remained very close to its current 2.2% rate for three-and-a-half years. In fact, it's been more predictable than the claims rate.
Figure 3
IBM Corp.
Warranty Claims & Accrual Rates, 2003-2009
(as a percentage of product sales)
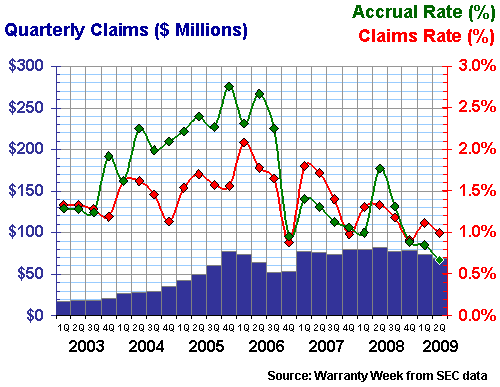
Apple, however, is a different story. Hardware sales actually grew by 12% in the company's third fiscal quarter ended June 27, driven by a more than quadrupling of iPhone sales, and in spite of a decline in computer sales. In fact, iPods and iPhones now account for more than 38% of total sales, making it easier and easier to begin thinking about classifying Apple as a consumer electronics company rather than as a computer maker.
But anyway, there's no doubt that iPods and iPhones have warranties, and from the looks of Figure 4, they're less costly to fix under warranty than Macintosh computers ever were. Claims costs in the first half of calendar 2009 have fallen from $162 million to $141, and the claims rate has fallen from 1.3% at the end of June 2008 to 1.0% at the end of June 2009. The accrual rate has fallen even faster and further, to only 0.7% at the end of June 2009.
Figure 4
Apple Inc.
Warranty Claims & Accrual Rates, 2003-2009
(as a percentage of product sales)
Last month, there was a brief flash of extended warranty-related news in some of the Wall Street coverage of Apple as an investment, which we'll summarize here for your consideration. A stock market analyst tracking Apple's revenue growth discovered that all the AppleCare service contract revenue has to be deferred and recognized gradually over the life of the contract. Therefore, they reasoned, Apple's actual revenue was growing even faster than was being reported in the bottom line.
Most Warranty Week readers already knew that, being the astute warranty professionals that you are, but the stock market analyst said this "new" information made him think the company's stock price/earnings ratio was even lower than it should be, making the company's shares an even more compelling "buy." But all that Wall Street math makes our heads hurt, so we'll leave it up to our readers who invest to fully process this nugget of wisdom.
Data Storage Warranties
Let's shift gears a little bit and take a look at the data storage industry. We usually include snapshots of Seagate Technology and Western Digital, but we won't in this half-year cycle. Instead, let's look at some others for a change. Unlike those two top disk drive makers, EMC Corp. is the manufacturer of entire storage systems sold to major corporations.
If Seagate and Western Digital are parts suppliers to the computer OEMs, sort of the Visteon and Delphi of the high-tech sector, then EMC is more like an engine manufacturer -- a Navistar, Caterpillar, or perhaps a Cummins. And like those engine manufacturers, EMC would be expected to experience warranty costs comparable to the OEMs.
That seems to be the case, as can be seen in Figure 5. However, there are new complications. EMC used to separate its total revenue into three buckets: systems, software, and services. Until this year, our claims rate and accrual rate calculations were derived from systems sales. But this year, EMC stopped separating systems and software revenues. Instead it now divides the total into just two segments: products and services.
Continuing our automotive analogy, if a year ago EMC was separating its revenue into engines, oil and labor, now it's giving us figures for just parts and labor. If the software is the oil, then what we're doing is comparing the cost of engines alone last year to engines plus oil this year.
Year-Ago Comparables?
The data in Figure 5 is heavily affected by this accounting change. It has the effect of increasing the size of the denominator by 31%, even though product sales fell by almost 19%. And since the year-ago number was closer to the true cost of warranty as a percentage of warranted product sales (engines alone), it makes little sense to adjust the year-ago numbers to make them more comparable to the current numbers. It would make more sense to try and subtract the "oil" from this year's numbers, although then we'd be comparing hard numbers to guesstimates. So we'd lose either way.
Still, EMC's claims were down from $78 million in the first half of 2008 to $67 million in the first half of 2009. And the claims rate did fall from 2.7% to 1.7%, even if the accounting change was responsible for most of that. Accruals were also down, from $89 million to $65 million, causing the accrual rate to fall from 3.2% to 2.0%. We'll assume it's all good news, and wait to see how the trend shapes up this year and next, though the dip to a 1.3% accrual rate seen at the end of March 2009 causes us some worry that perhaps accruals are being cut too much.
Figure 5
EMC Corp.
Warranty Claims & Accrual Rates, 2003-2009
(as a percentage of product sales)
In terms of metrics not affected by the accounting change, EMC's warranty reserve shrank from $275 million at the end of June 2008 to $267 million at the end of June 2009. Although that would appear to be another cause for concern, as a multiple of claims cost EMC's reserves are actually on an upwards trend. In other words, if the amount of reserves being held a year ago was equal to 20 months' worth of claims, now it's equal to 23 months. So that's actually an improvement in the reserve's ability to cover claims payments.
Brocade Snapshot
Brocade Communications Systems is engaged in a market segment similar to EMC, albeit with a vastly smaller market share. Meanwhile, Brocade never segmented its revenue into anything more specific than products and services, so there's no problem comparing its figures for the half-year ended May 2, 2009 to the equivalent half-year in 2008.
And in that half-year, product sales are actually, really, truly, up. And warranty claims are actually, really, truly, down. So the trends seen in Figure 6 are not the result of an accounting change. Nor have the rates been skewed by recessionary sales declines.
Brocade paid out only $825,000 in claims in the first half of its fiscal year, so it's operating a warranty department on a far smaller scale than EMC does. But that claims payment total is down from $1.878 million in the same period a year ago. And thanks to the magic of rising sales, the claims rate has dropped from 0.3% last year to only 0.1% this year. In fact, after a big surge two years ago, claims have been more or less dropping ever since. So in a year where most of the year-ago comparisons are somewhere between dreary and frightening, Brocade is a sight for sore eyes.
Figure 6
Brocade Communications Systems Inc.
Warranty Claims & Accrual Rates, 2003-2009
(as a percentage of product sales)
Brocade's accruals actually jumped noticeably in the first quarter of this year, but they have fallen back since into the range seen during 2008. The accrual rate now stands at 0.4%, down from 0.7% in the first quarter of this year and just slightly above the accrual rate seen a year ago. Warranty reserves have actually grown, from $5.9 million a year ago to $6.7 million now. In terms of coverage, the reserves have grown from the equivalent of 22 months of claims to more than 45 months of claims.
The New Silicon Graphics
Finally, we wanted to include a snapshot for Silicon Graphics, or at least the company now using that name. The data in Figure 7 is for Silicon Graphics International Corp., which used to be called Rackable Systems Inc. until it acquired the assets of the bankrupt Silicon Graphics Inc. in May of this year.
It's too soon to say whether the acquisition is what drove claims rates up from 0.7% a year ago to 1.8% now. Claims in the half-year grew by a little more than half, from $1.0 million to $1.6 million, but sales fell by a little more than half. So that had something to do with the big jump in the claims rate.
But Rackable Systems also took on $6.4 million in warranty reserves as part of the acquisition, so it's safe to assume that some of the increase in claims came from the newly-acquired customer base. The old SGI had a lucrative customer base in visual- and computational-intensive industries such as film studios, semiconductor design, financial services, and pharmaceuticals. They now become customers of the new SGI.
Figure 7
Silicon Graphics International Corp.
Warranty Claims & Accrual Rates, 2003-2009
(as a percentage of product sales)
Still, it's good to be able to use the SGI acronym again. As with the predecessor companies, the new SGI is engaged in the sale of high-end servers and storage systems to high-end customers. Hopefully, sales will pick up now that the bankruptcy and asset sale are completed, and the uncertainty surrounding service and support have been resolved.
Industry Statistics
Overall, claims in the U.S.-based computer industry fell 11% from $2,705 million in the first half of 2008 to $2,418 million in the first half of 2009. Accruals fell 24% from $2,933 million to $2,223 million. Warranty reserves fell from $4,485 million to $4,146 million. And Apple was the only member of the group to report an increase in product sales.
In the data storage industry, the declines were relatively mild. For the first half of 2009, claims were down only 1% to $282 million. Accruals were down 10% to $283 million. And reserves were down 1% to $895 million. Brocade and LaserCard Corp. were the only members of the group to report an increase in product sales, so it's no surprise to see declines in warranty costs.
Next week, we'll take a half-year look at the telecom equipment industry, where things are truly grim, and in future weeks we'll look in on the semiconductor, medical, aerospace, appliance and housing industries. While the year-ago comparisons are somewhat discouraging, the optimistic approach would be to say it's only up from here.
| Part One: Top 100 Warranty Providers |
| Part Two: Automotive Industry |
| Part Three: Computer & Disk Drive Industries |
| Part Four: New Home Builders |
| Part Five: Aerospace Industry |
| Part Six: Medical Equipment & Scientific Instruments |
| Part Seven: Telecom & Data Networking Equipment |
| Part Eight: HVAC, Appliances & Building Materials |


