Japanese & European Warranties:
While consumer electronics have some of the lowest warranty costs, computers have some of the highest claims rates. And telecom gear is somewhere in the middle, as a look at eight of the top international suppliers details.
In all the analysis of fresh international warranty data during the past few weeks, we've concentrated on automotive and have largely overlooked the high-tech electronics domain. But given that many of the consumer electronics companies end their fiscal years on March 31 and publish their annual reports in late June or early July, there's also now some new data on that side of the warranty world.
We have four Japanese companies and four European companies to tell you about this week. All four of the Japanese companies sell primarily consumer electronics, office equipment and laptop computers, while all four of the European companies sell primarily telecom equipment, mobile handsets, and handheld computers.
Warranty Costs Remain About the Same
In a way, not much has changed in terms of warranty costs over the past few years for most of these companies. Sales fell, but warranty costs fell more or less in proportion. But given how dramatically the recession impacted both sales and warranty costs in both the homebuilding and automaking markets, no news is truly good news for these telecom and electronics companies.
As numerous commentators have suggested, consumer electronics have relatively low product warranty costs. They generate relatively high amounts of extended warranty and service contract revenue, but in at least their first year of life they rarely consume more than one percent of revenue in warranty work.
Office equipment, telecom equipment, and particularly computer equipment don't always share this characteristic. In fact, laptops are one of the few electronic products for which warranty work consumes three or even four percent of revenue. And as phones become more computer-like, their sub-one-percent days may also be numbered.
There are three currencies in use in these charts: Japanese yen, European euros, and Swedish kronor. Exchange rates have gyrated sometimes wildly over the past several years, but that hasn't been reflected in the warranty claims and accrual rates, which have remained relatively stable.
One reason may be that the claims and accrual rates are calculated by dividing sales in one currency into warranty claims or accrual totals in the same currency. Any foreign exchange adjustments are done separately by each company. So for these calculations it hasn't really mattered what the yen-dollar or euro-yen exchange rates have been over the years. But for the sake of the curious, a billion Japanese yen in early 2010 was equal to US$10.75 million. At the end of 2009, ten million euro was worth US$14.24 million. And 500 million Swedish kronor was worth around US$65.6 million at the end of 2009.
Panasonic Remains Steady
With those exchange rates in mind, let's start with Panasonic, which saw sales fall by a rather unremarkable 4.5% in the year ending March 31, 2010. Sales fell much faster the year before, by some 14.4% in the year ending March 31, 2009. So it's no shock to see that Panasonic's claims and accrual rates remained virtually the same in the past two years, after rising from fiscal 2008 levels.
Figure 1
Panasonic Corp.
Warranty Claims & Accrual Rates, 2003-2010
(as a percentage of product sales)
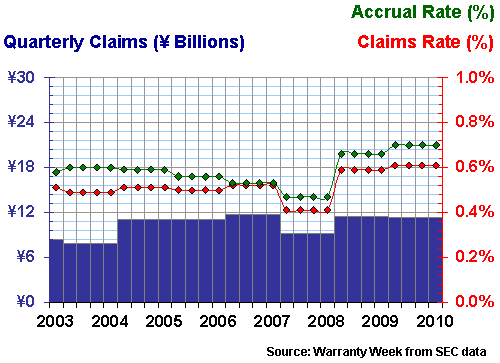
The left-hand scale in Figures 1 through 4 is in billions of Japanese yen. In Panasonic's case, the company reported spending ¥45.5 billion on warranty claims during the most recent fiscal year, which we've chopped into four equal blocks of ¥11.4 billion per quarter, represented by the blue bars.
The right-hand scale represents the percentage of sales that these warranty claims and accruals represent. Panasonic's ¥45.5 billion in claims per year represents 0.6% of sales. Its ¥51.7 billion in accruals represents 0.7% of sales.
A year ago, the corresponding figures for claims and accruals also represented 0.6% and 0.7%, respectively, of Panasonic's ¥7,766 billion in sales. So, with little change apparent, the lines in Figure 1 barely moved.
Sony Sees Costs Remain Stable
At Sony, we've subtracted out all the entertainment revenue, leaving just electronics and computer revenue. The company's hardware revenue fell by nearly 20% on the year ended March 31, 2010, following a 16% decline in the 2008-2009 fiscal year. but, as can be seen in Figure 2, claims and accruals remained close to the 0.9% line during all three fiscal years.
Figure 2
Sony Corp.
Warranty Claims & Accrual Rates, 2003-2010
(as a percentage of product sales)
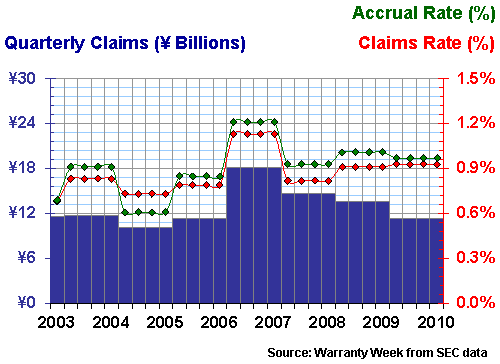
Sony spent ¥45.2 billion on warranty claims, about 0.9% of its ¥4,837 billion in product sales. It accrued ¥46.7 billion, just under 1.0% of its sales. As can be seen in Figure 2, accruals were just a little bit higher, and claims just a little bit lower, in the previous fiscal year.
Computers vs. Consumer Electronics
Of the four Japanese companies we're spotlighting here, Sony usually has the highest warranty claims and accrual rates. The reason, we suspect, has to do with the relative size of its computer product line. Competitors such as Hewlett-Packard and Dell quite regularly spend three percent or more of their hardware revenue on warranty claims. Competitors such as Panasonic probably also spend similar amounts on laptop warranty work, but it's not as big a slice of their total revenue.
We suspect Sony's Vaio computer products generate similar costs to HP and Dell, and that its consumer electronics generate costs similar to what's seen for Panasonic and Canon. The average between the high and the low is what's seen in Figure 2.
Both Panasonic and Sony publish their warranty data just once a year, in annual reports for fiscal years that end on March 31. Hitachi, on the other hand, has published warranty data either every quarter or every six months for multiple years. This is why the claims data in Figures 1 and 2 is shaped like a staircase for each consecutive group of four quarters, and why the data in Figure 3 below is much more choppy.
Figure 3
Hitachi Ltd.
Warranty Claims & Accrual Rates, 2003-2010
(as a percentage of product sales)
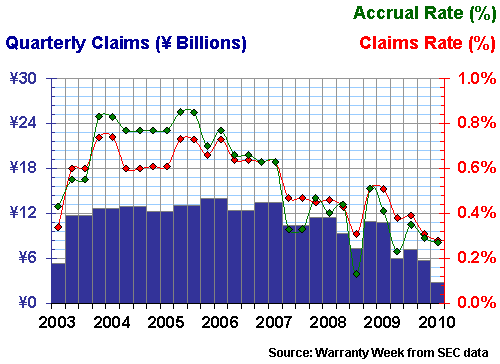
Hitachi has a much more diverse product line than merely consumer electronics and computer components. In addition to those product lines, Hitachi also builds power plants, elevators, train cars, excavators, dump trucks, refrigerators, and washing machines. Revenue from its financial services, property management, and other services, however, was subtracted before the percentages in Figure 3 were calculated.
In the most recent fiscal year ended March 31, Hitachi published three quarterly reports and one annual report containing warranty data. Warranty claims for the entire year totaled ¥21.7 billion, while accruals totaled ¥20.8 billion. Compared to ¥7,785 billion in warranted product revenue, the claims rate and accrual rate both work out to less than 0.3%.
As much as we suspect computers for driving Sony's warranty costs above the rate seen at Panasonic, we have no explanation for the lower rate seen at Hitachi. In fact, its largest reported product segment is Information & Telecommunication Systems, which includes disk array subsystems, servers and mainframes. Second-largest is Social Infrastructure & Industrial Systems, which includes rail cars, electronic components and traffic control systems. Both segments would be expected to require more than 0.3% of revenue to finance product warranties.
Canon Inc., unlike most of its Japanese peers, ends its fiscal year on Dec. 31. And it publishes its warranty data only once a year, in its annual reports. So the data in Figure 4 below is for seven complete years, beginning Jan. 1, 2003 and ending Dec. 31, 2009.
Figure 4
Canon Inc.
Warranty Claims & Accrual Rates, 2003-2010
(as a percentage of product sales)
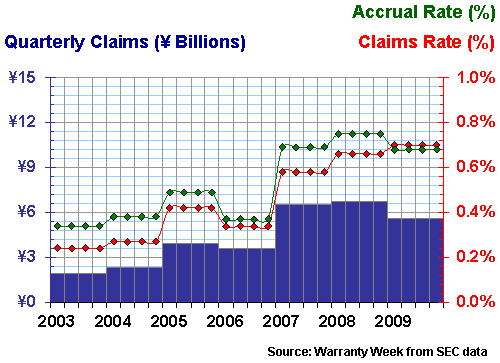
Again, sorry to remark about how unremarkable the data is, but 2009 looks little changed from either 2008 or 2007. However, seeing how sales were down by almost 22% in 2009 makes the year-to-year stability in warranty costs all the more remarkable.
In 2009, Canon's warranty claims were ¥22.5 billion, around 0.7% of its ¥3,209 billion sales total. In 2008, Canon's warranty claims total was ¥26.8 billion, just under 0.7% of its ¥4,094 billion sales total.
In 2009, Canon's accrual rate was just below its claims rate. In 2008 and 2007, the accrual rate was just above the claims rate. As a result, the company's warranty reserve has now contracted to ¥13.5 billion, from ¥18.1 billion at the beginning of 2007.
Upward Trend at Canon
Also somewhat concerning is a general upwards direction in warranty costs over the past seven years. However, although the trend is consistently upwards, the scale of Figure 4 somewhat exaggerates its magnitude. Since 2003, the claims rate has risen from 0.24% to 0.7% while accruals have risen from 0.34% to as high as 0.75%.
Besides the relative stability from year to year, the other shared characteristic of the four warranty providers portrayed in Figures 1 to 4 is the relative closeness of the red and green lines. While the lines do diverge, and the warranty reserve expands or contracts as a result, there really aren't any major gaps.
Contrast that shared characteristic to the data in Figure 5, which tracks the German industrial giant Siemens AG from early 2003 to the end of Sept. 2009 -- the close of its fiscal year. In all three of the most recent fiscal years, there has been a major gap between claims and accruals, indicated by the gap between the red and the green lines.
Figure 5
Siemens AG
Warranty Claims & Accrual Rates, 2003-2009
(as a percentage of product sales)
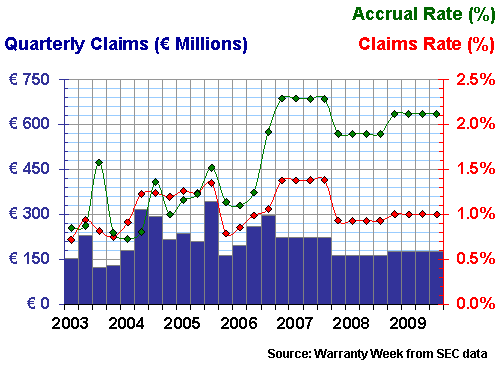
In fiscal 2009, Siemens reported €713 million in warranty claims, yet it accrued €1,508 million. In fiscal 2008, claims totaled €651 million while accruals totaled €1,329 million. And in fiscal 2007, claims totaled €888 million while accruals totaled €1,470 million.
We should note that in each of these years, Siemens withdrew much of the excess accruals through a change in estimate. As a result, the warranty reserve grew at a much slower pace than would be indicated by the gap between the figures above: from €2,440 million in Sept. 2007 to €2,744 million in Sept. 2008 and to €3,000 in Sept. 2009.
Quarterly to Annual Switch
In the four previous years, Siemens filed its warranty cost data with the U.S. Securities and Exchange Commission on a quarterly basis. This is why the data looks more variable from 2003 to 2006 than it does from 2007 to 2009. Were we to chart just the annual data for all seven years, the early years might actually look more stable than the more recent years.
The French-American telecom company Alactel-Lucent also made the switch to annual filings at around the same time, which is why the data in Figure 6 looks more choppy from 2003 to 2006. However, during those four years, Alcatel (before acquiring Lucent) was providing only half-year and annual reports, so the data for the most part comes in identical pairs.
Figure 6
Alcatel-Lucent
Warranty Claims & Accrual Rates, 2003-2009
(as a percentage of product sales)
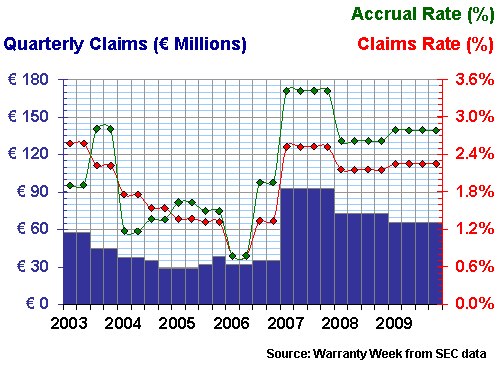
Notice how Alcatel's warranty claims and accrual rates drop from 2003 to 2006, only to rise again in 2007 after the Lucent acquisition. One could try to lay the blame on Lucent Technologies, except that before the acquisition the American company was turning in claims rates around 2.0% and accrual rates between 1.0% and 1.3%. And Lucent never reported an accrual rate above 2.1%, while it was 3.4% during Alcatel-Lucent's first year together.
Nokia, meanwhile, has shown an admirable level of consistency for the past seven years. Its claims rate fell from 2003 to 2006, then rose to just under 2.5% last year. Better yet, the mobile phone maker's accrual rate dipped below two percent in 2009, it's lowest reported level so far.
Figure 7
Nokia Corp.
Warranty Claims & Accrual Rates, 2003-2009
(as a percentage of product sales)
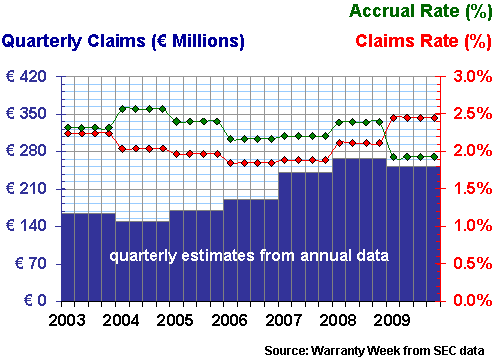
In 2009, Nokia reported €1.006 billion in claims and €793 million in accruals, against €40.984 billion in sales, for a claims rate of 2.45% and an accrual rate of 1.93%. In 2008, the corresponding claims and accrual rates were 2.11% and 2.39%, respectively.
However, because of a tendency to remove funds from the warranty reserve through changes of estimate, Nokia has allowed its reserve balance to fall to €971 million at the end of 2009. It was €1.375 billion at the end of 2008 and €1.489 billion at the end of 2007. And it had never gone below €1 billion since Nokia began making reports in 2003.
Measured a different way, Nokia's warranty reserve at the end of 2006 was equal to the total for the previous 19 months of claims payments. By the end of 2008 the balance was equal to 15 months of claims. Most recently, the capacity of its warranty reserve to pay claims was less than 12 months.
Consistent Downward Trend in Costs
Finally, let's take a look at LM Ericsson, a telecom equipment and cellular handset rival of several of these other companies. Ericsson is also partners with Sony, but there is no way to isolate just their wireless handset warranty expenses and compare them to Nokia, Motorola, or others.
Ericsson also reports in Swedish kronor, which has the effect of making its warranty outlays look bigger. But in the chart below, one can safely divide by 10 to convert to euro, since the prevailing exchange rate at the end of 2009 was SEK 10.85 = €1.00.
Figure 8
LM Ericsson Telephone Co.
Warranty Claims & Accrual Rates, 2003-2009
(as a percentage of product sales)
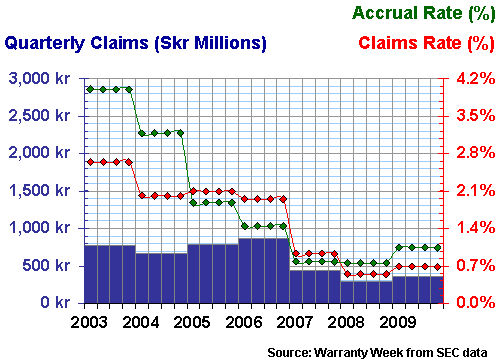
Notice that besides Hitachi, Ericsson is the only other company with a track record of warranty cost reductions over the past seven years. In 2003, Ericsson spent SEK 3.105 billion on warranty claims, equal to 2.6% of its SEK 117.7 billion in sales. By 2005, the claims rate was down to 2.1%, and by 2007 it was 0.9%.
In 2009, Ericsson reported SEK 1.427 billion in claims and SEK 2.141 billion in accruals, for claims and accrual rates of 0.7% and 1.0%, respectively. Both rates were slightly higher than they were in 2008 (0.6% and 0.8%, respectively). But both were still relatively low for a telecom equipment supplier.
Consumer Electronics Reliability
One always hears how reliable consumer electronics have become in recent years -- how if the units work out of the box they're likely to work without any need for repairs for multiple years. The data in Figure 1, and perhaps also a bit of Figure 4, seem to support that.
One also hears how computers generate vastly more warranty expense than consumer electronics. And if we could see Sony's warranty expenses division by division, we believe that trend would be confirmed.
Telecom equipment seems to be somewhere in the middle. The business end of the equipment market generates a significant amount of warranty expense. The consumer end, particularly the low end of the wireless handset business, has low levels much like the consumer electronics sector.
However, based on figures that we're not repeating here for competitors such as Palm, we believe that the more sophisticated and computer-like the handset becomes, the more costly it becomes in terms of warranty expense. In other words, the smarter the phone, the higher the warranty cost. The exception to this rule seems to be the Apple iPhone, but given last week's "we aren't perfect" press statement, that cost difference may now be diminishing.


