

Computer Warranty
Claims & Accruals:
No news is good news as the computer industry's top warranty providers turn in predictable warranty expense reports. Despite economic turmoil, new product launches and multiple recent acquisitions, claims and accrual rates just aren't changing much.
Every August, all the major manufacturers file their mid-year financial reports with the U.S. Securities and Exchange Commission. And every September, we take those 800 or so reports and assemble from them some trend data for product warranty claims and accruals within each industry.
This year, we'll lead off with a close-up for the U.S.-based computer industry. Although they number less than a dozen companies, together they account for roughly a fifth of all warranty activity -- second only to the automotive industry, which accounted for roughly 45% of the $25.2 billion pie last year.
In the first half of this year, computer manufacturers have paid out something like $2.41 billion in warranty claims, down slightly from the $2.42 billion registered in the first half of 2009. But that may have lots to do with the absence of Sun Microsystems Inc., which merged with Oracle Corp. in January.
Goodbye Sun, Hello Oracle?
Sun filed its last financial report in November, and none of the Oracle reports filed since then have yet begun to detail the company's hardware warranty expenses. So while we counted $121 million in claims for Sun in the first half of 2009, we have nothing yet to put in that column for Oracle in 2010. And while Oracle is beginning to at least mention its increasing warranty costs in its financial reports, we hope they realize that full tabular disclosures are the law, not a giant favor to the investment community.
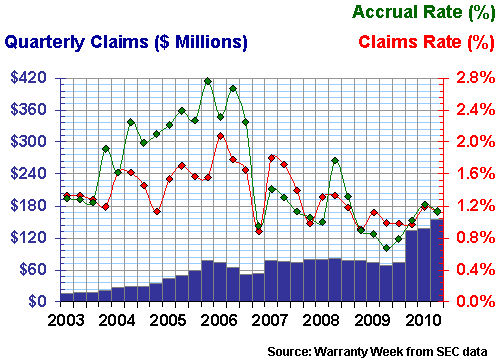
In Figure 1 below, the first quarter 2010 figure of $1.21 billion in claims paid is slightly above the year-ago quarter, while the second quarter's $1.20 billion is slightly below 2009's second quarter. In fact, the U.S.-based computer manufacturers have paid out slightly more or slightly less than $1.2 billion per quarter for the past six quarters.
Figure 1
Computer Industry
Warranty Claims Paid, 2003-2010
(in US $ millions per quarter)
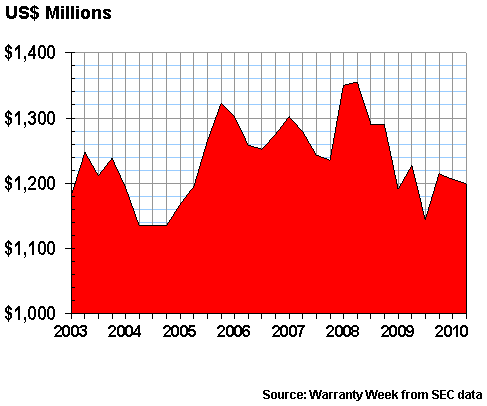
In Figure 3, we'll translate these amounts into figures that represent a percentage of sales. But these are the raw numbers -- the amounts that U.S.-based computer manufacturers have paid in claims worldwide since 2003.
The peak came in early 2008, when computer makers paid out $1.35 billion in two sequential quarters. And the trough, surprisingly enough, came not during the recent recession but in 2004, when for three quarters the manufacturers paid out around $1.13 billion per quarter in claims.
Claims vs. Accruals
But that's only half the story. More revealing data usually comes from the accrual figures. Claims rise and fall based on the timing of sales and repairs. But accrual amounts are set based on what a company expects will happen, based on not only sales but also on product quality and projected repair costs.
Claims are what happens to you. Accruals are what you believe will happen. The best companies -- and indeed the computer industry as a whole -- do a good job of matching one to the other. So as sales begin to rise again during this period of recovery, one would expect accruals to respond first. After those newly-sold computers get to be a few months old, they'll begin to show up as increased claims.
We say this because it's clear in Figure 2 that accrual totals have been above claims totals during 2010 and below claims in 2009. Computer manufacturer accruals hit $2.56 billion during the first half of 2010, up from $2.22 billion in the first half of 2009. And accrual totals are ahead of their year-ago figures in both the first and second quarters of this year.
Figure 2
Computer Industry
Warranty Accruals Made, 2003-2010
(in US $ millions per quarter)
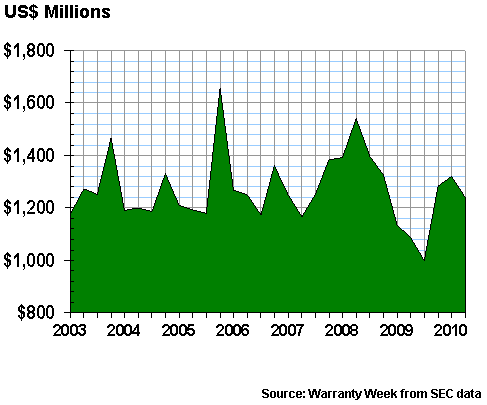
Computer industry accruals hit their peak during the fourth quarter of 2005, when manufacturers set aside nearly $1.66 billion. And the one and only time they set aside less than a billion dollars came in the third quarter of 2009 -- the very trough of the recent recession.
The thing is, they also sold fewer computers at that time, so their $999 million in accruals represented just over 3% of hardware sales revenue during that quarter. And at the peak, that $1.66 billion represented just under 3.5% of hardware sales.
Keeping Warranty Costs in a Range
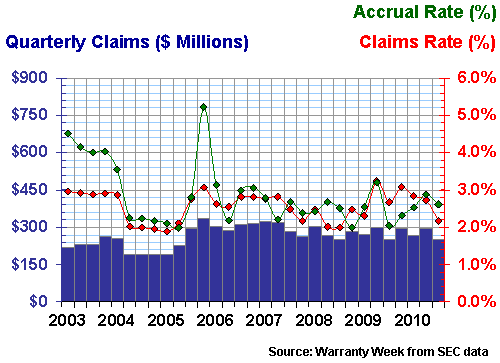
It turns out that for most of the past six years, computer manufacturers have kept both their claims and accrual rates between 2.5% and 3.5% of sales revenue. In 2003 and during part of 2004, their rates were higher. But then major manufacturers such as Hewlett-Packard Co. and Dell Inc. began to focus intensely on warranty costs, waste, fraud, and the efficiency of the process, and rates began to fall.
In Figure 3, we've stretched the vertical axis so the data looks more bouncy than it really is. But that makes it all the more easy to see that computer manufacturers have remained close to three percent despite the boom, bust, and boom cycles they've been through in recent years.
Figure 3
Computer Industry
Warranty Claims & Accrual Rates, 2003-2010
(as a percentage of hardware revenue)
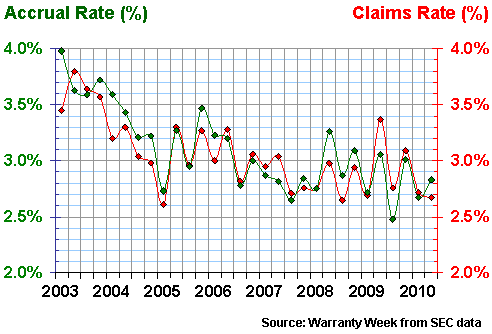
To obtain these figures, we added together the individual figures of all the industry members who report their warranty expenses. That list has been as long as 12 members and as short as the current six members.
In the next four charts, we'll provide snapshots for the four largest: HP, Dell, IBM, and Apple. With the acquisitions of Sun and Palm Inc., the bankruptcy of Gateway partner MPC Corp., and the lack of new data from Oracle and Unisys Corp., the only current computer industry data that we have which we aren't showing comes from Silicon Graphics International Corp.
No Big Surprises
Palm is actually now part of HP, following an acquisition that was completed on July 1. HP also recently acquired 3Com Corp., but the company on its own is so large that it hardly had an impact on the data in Figure 4. After more than seven years of tracking HP, it's becoming clear that there aren't and probably won't be any warranty surprises in their financial reports.
Figure 4
Hewlett-Packard Co.
Warranty Claims & Accrual Rates, 2003-2010
(as a percentage of product sales)
HP, in fact, is now America's second-largest warranty provider, following the contraction of Ford Motor Co. through a combination of warranty cost cutting and lower vehicle sales volumes. Last year, HP's claims total was $2.68 billion to Ford's $2.48 billion. Besides those two and General Motors, the only other American companies to spend more than a billion dollars on claims last year were Dell and Caterpillar.
Different Fiscal Years
We should note that in both Figure 4 and Figure 5, we have data for 31 quarters, because both HP and Dell follow a fiscal year in which their quarter ends on July 31. So what we're counting as their third quarters of 2010 are really the months of May, June and July. What we're counting as their first and second quarters are the periods that ended in January and April.
Everyone else is on a schedule in which the quarter ended June 30 (which is the 30th in our data series) is the latest available. We expect third quarter data to begin arriving in November, and then the fourth quarter data is expected in late February and early March 2011.
HP has been able to get both its claims and accrual rates back down close to 3%, after seeing them rise as high as 3.75% in 2008 and 2009. Dell, meanwhile, hasn't seen claims rates this low since the middle of 2008, though its accrual rates are now towards the middle of their recent 2% to 3.2% range.
The key to why overall industry warranty costs are falling, however, can be seen in the great progress both HP and Dell have made since 2003 and 2004. As they cut their warranty claims and accrual rates, the industry average also fell. Were it not for that huge accrual spike in late 2005, Dell would be in the sixth consecutive year of reasonably flat and consistent warranty costs.
Figure 5
Dell Inc.
Warranty Claims & Accrual Rates, 2003-2010
(as a percentage of product sales)
IBM, on the other hand, has simply brought its claims rate down to the level at which its accruals have been for years. While the gap between the red and green lines in Figures 4 and 5 is meager (and indeed they cross each other multiple times) the data for IBM in Figure 6 shows a continuing gap between claims and accruals.
In fact, IBM's accrual rate hasn't exceeded its claims rate since late 2004. What this means is that the outlays have always exceeded the replenishments, and the warranty reserve fund's balance has fallen. Back at the end of 2004, IBM had a balance of $944 million in its warranty reserve fund. At the end of 2009 that balance was down to $316 million. By June of this year, it had fallen to $308 million.
Figure 6
IBM Corp.
Warranty Claims & Accrual Rates, 2003-2010
(as a percentage of product sales)

In terms of coverage, IBM now has the equivalent of eight months of claims in its warranty reserve. That's less than the typical length of its warranties, and is also less than the coverage kept by its competitors. Both Dell and HP now have warranty reserve balances equal to what they spend in 12 months.
No Problems at Apple?
Finally, we continue to be amazed by Apple. Yes, claims are rising in terms of dollars spent (the blue bars in Figure 7) and are even creeping up as a percentage of sales (the red line in Figure 7). But no, at 1.2% it's not a problem, and besides, sales are rising in proportion to repair costs.
As Figure 7 shows, Apple as a company has paid out more than two percent of sales in warranty claims during only one quarter in the past seven-and-a-half years. Dell has paid out less than two percent on just two occasions, and neither IBM nor HP have ever gone below that 2% level. And what makes it all the more surprising is how many warranty-related headlines (and lawsuits) Apple has generated over the past few years. You'd almost think it's the wrong company's data you're seeing in Figure 7.
But it's not right to compare companies against each other. We don't know all of the indirect costs (call centers, training, troubleshooting, etc.) and we don't even know the claims rates for Macintosh vs. music vs. mobile phone. Apple segments its revenue pretty thoroughly, but its warranty data consists of one set of numbers for the entire company.
Then again, Apple generally has shorter warranties than Dell, and it leans more heavily on extended warranties than either IBM or HP. So there are good reasons why its product warranty costs would be lower. And with the iPhone, iPad and iPod, Apple is more reliant on consumer electronics than its computer competitors as well.
Consumer Electronics vs. Computers
We don't know why, but the market data consistently shows consumer electronics and mobile phones having lower warranty costs than computers. And Apple in recent years has become more about music players and mobile phones than about Macintosh. We wouldn't be surprised if the Mac's warranty costs are close to 2.5% of revenue. But the Mac product line is only 28% of the company now.
Figure 7
Apple Inc.
Warranty Claims & Accrual Rates, 2003-2010
(as a percentage of product sales)
The common theme, however, which can be seen in all four company charts, is that over time they're getting their warranty expenditures under control. Whether it's through reduced rates of spending or an elimination of the gap between claims and accrual rates, the companies are taking the surprise out of their warranty data. In the case of these companies, no news really is good news.
Product Warranty Series
This is the first in a series of 11 industry-by-industry newsletters that examine product warranty claims and accrual trends in detail over the past eight years. Links to the others in the series are included below, in case you've missed any.
September 16: Computer Warranty Claims & AccrualsSeptember 23: Data Storage Warranties
October 7: HVAC & Appliance Warranties
October 14: New Home Builders & RV Maker Warranties
October 21: Construction Equipment Warranties
November 5: Aerospace Warranties
November 11: Security Equipment Warranties
November 18: Automotive OEM Warranties
December 2: Automotive Supplier Warranties
December 16: Medical & Scientific Equipment Warranties
December 23: Telecom Equipment Warranties


