Data Storage Warranties:
Sales are once again rising and warranty costs are falling or at least remaining under control, despite longer warranty durations. But while some companies are cutting their warranty costs for real, at least one is merely changing the way it reports the numbers.
The data storage industry is a bit like the drivetrain manufacturers that supply the automotive OEMs. They don't usually bask in the glory of having their brand names on the outside of the box, but they sure do get their share of warranty claims.
The good news is that in the seven-and-a-half years we've been tracking the industry, the manufacturers have only once before paid out a smaller percentage of their product revenue in warranty claims. And that was back in the middle of 2007, before the recession knocked the wind out of sales.
The bad news is that it's been years since claims and accrual totals were as high as they were in the first quarter of 2010. And in the second quarter, both totals were down -- accruals by a startling amount.
Most of the midyear 2010 warranty data is in, and so we're taking a snapshot of various industry segments, beginning with the high-tech electronics sector. And within that sector, the data storage manufacturers are usually second only to the computer OEMs in terms of the percentage of sales revenue that's consumed by warranty costs.
Years of Fluctuations
As can be seen in Figure 1, the amount the 19 or so active vendors paid out each quarter in warranty claims has ranged from a high of $159 million in the first quarter of 2010 to a low of $128 million in the middle of 2005. To arrive at a percentage figure for the warranty claims rate, we divide those quarterly amounts by the corresponding totals for product sales.
Figure 1
Data Storage Industry
Warranty Claims Paid, 2003-2010
(in US $ millions per quarter)

Warranty claims are what these vendors pay out each quarter, in terms of both direct costs and indirect costs. With some disk drive warranties now lasting up to five years, that means we could be comparing costs arising from products sold in the pre-recession years to revenue earned in the post-recession period.
What's remarkable about Figure 1 is just how unremarkable it really is. If one were to look at the same style of chart for the new auto or homebuilding industries, one would definitely see more of a peak in 2007 and more of a trough in 2008 or 2009. But here, it's more or less steady, in spite of us trying our best to stretch the vertical axis.
More Volatility in Accruals
In Figure 2, we measure the other side of the equation: the warranty accruals. These are the amounts each manufacturer sets aside based on sales data, reliability predictions, and repair or replacement cost estimates. It should rise and fall in proportion to sales, which would again mean we would expect to see a peak and a trough.
The problem is, the peak and the trough are in the wrong place. The peak in warranty accruals came in late 2004, when the 27 manufacturers that were active at the time set aside $218 million in the fourth quarter of that year. And then three troughs each registered higher lows: $111 million in early 2003, $120 million in early 2007, and $134 million in early 2009. All was well until this spring, when they set aside only $102 million.
Figure 2
Data Storage Industry
Warranty Accruals Made, 2003-2010
(in US $ millions per quarter)

We don't know why there was a sudden plunge in accruals during the second quarter of 2010. The only disk drive vendor whose most recent warranty report is still missing is Overland Storage Inc., and they've never made a quarterly accrual of more than a million dollars. So it's not because of missing data.
It's probably just one of those coincidences that happens when several companies do the same thing at the same time. SanDisk Corp. cut its accruals by 84% compared to the second quarter of 2009. Seagate Technology plc cut its accruals by 67%. EMC Corp. cut its accruals by 45%. Of the top four warranty providers in the disk drive industry, only Western Digital Corp. raised its accruals, and that 25% increase wasn't enough to offset the others' declines.
Continuing a Downward Trend
Then again, as a percentage of revenue, both warranty claims and accrual rates have been headed downwards for several years. In Figure 3, one can see how the weighted industry average used to be as high as 2.7% for claims and 2.6% for accruals. That's as much as some of the automakers and computer OEMs pay now.
Disk drive manufacturers made steady progress in their quest to reduce warranty costs, which is all the more incredible because competitive pressures forced them to lengthen warranty durations at the same time. By the end of 2009, the industry's claims rate hit a new low of 1.3%, while accruals set a new low mark of 1.4%.
Figure 3
Data Storage Industry
Warranty Claims & Accrual Rates, 2003-2010
(as a percentage of hardware revenue)

And then something happened. Rates didn't exactly soar, but they're now back up to the 1.5% range. And it's not just a mathematical aberration caused by the end of the fiscal years coming in June for Seagate, Western Digital, NetApp Inc., Emulex Corp., and Dataram Corp. Most of the vendors saw a slight upturn in the first half of 2010, or at least an end to the downwards trend.
Seagate, for instance, saw a 16% increase in sales in its latest fiscal year, and both its claims and accrual rates are far below their year-ago levels. But its claims rate was a little bit lower at the end of calendar 2009 than it was as the company's fiscal year ended on July 2, 2010. Then again, as can be seen in Figure 4 below, the company's accrual rate hasn't been this low since the middle of 2006.
Figure 4
Seagate Technology plc
Warranty Claims & Accrual Rates, 2003-2010
(as a percentage of product sales)
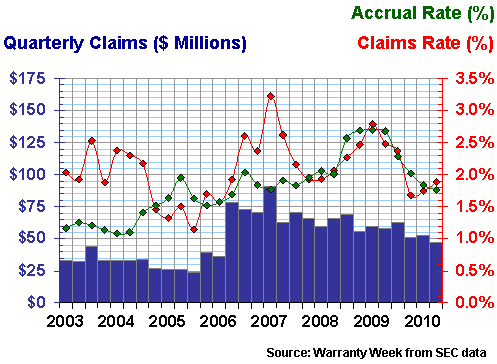
Western Digital ended its fiscal year on July 2 with a sales gain of 32%. Claims and accruals also rose in dollar terms, but not at the same rate. Claims rose 24% to $138 million for the fiscal year, while accruals rose 45% to $183 million. As a result, the claims rate fell from 1.5% a year ago to 1.4% this year, while the accrual rate rose from 1.7% to nearly 1.9% on July 2, 2010.
Figure 5
Western Digital Corp.
Warranty Claims & Accrual Rates, 2003-2010
(as a percentage of product sales)
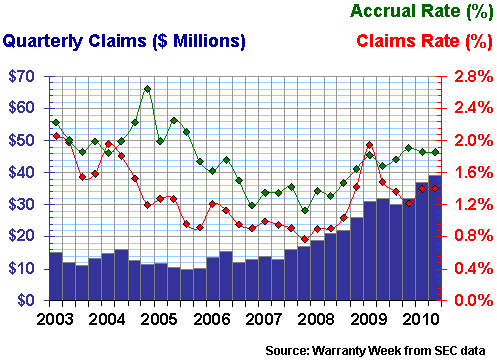
Neither Seagate nor Western Digital are setting new lows for their claims or accrual rates. However, both are now in the middle of the range they've established for themselves over the past seven-and-a-half years, which again is good news considering the likely costs of their five-year warranties.
To find a company that's clearly at the low end of their range, we had to go to EMC Corp. But even there, the trend is unclear. EMC ended its second quarter on June 30 with a 1.7% claims rate and a never-lower 0.9% accrual rate. But in this case, at least, we think we know why.
Figure 6
EMC Corp.
Warranty Claims & Accrual Rates, 2003-2010
(as a percentage of product sales)
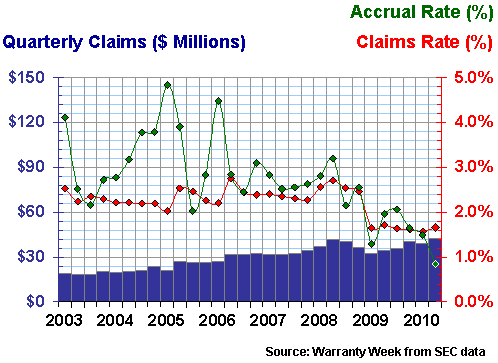
Notice in Figure 6 how claims and accrual rates suddenly sink at the beginning of 2009? Before that time neither the claims nor the accrual rate had been below 2%. Since that time, at least the claims rate has never been above 2%, while the accrual rate topped out last year at 2.06%.
Ordinarily, we'd be congratulating the company in question for getting its warranty costs under control and shifting its percentage rates downwards. But in this case, it has more to do with a change in the way EMC's revenue is segmented. From 2003 to 2008, the company clearly segmented its revenue into three pieces: systems, software, and service. But in 2009, it changed to only two segments: products and services.
The net effect is to increase the amount of revenue counted in the percentage calculations, which of course makes the percentages look smaller. For instance, in the 2008 annual report, we learned that EMC's revenue consisted of $6.3 billion in systems, $5.9 billion in software, and $2.6 billion in services. So when we divided $155 million in claims by $6.3 billion in systems revenue, we arrived at a 2.5% claims rate.
Now, go to the 2009 annual report, and look back at the 2008 figures in includes. Now we're being told that EMC's 2008 revenue was split into $10.1 billion in products and $4.8 billion in services. It's the same total as before, but the size of the pieces is different. And using just the piece that generates warranty costs (products) now results just in a 1.5% claims rate ($155 M / $10.1 B).
Comparing Apples to Apple Juice
One could argue that the hardware and software are inseparable, or that the software generates warranty costs too. One might even suggest that the services can generate warranty costs too. But that's largely irrelevant in this case. The problem here is that the post-change data is not comparable to the pre-change data, and so EMC's most recent warranty data can no longer be reliably compared against earlier years. It's like comparing two different companies now.
We encountered similar problems when General Electric and DuPont each reorganized their divisions in a way that made the warranty-generating pieces parts of larger units. Dell did quite the opposite -- providing previously unseen details about the product line that allowed for more precise comparisons of product warranty to product revenue.
We'd love it if the companies themselves would calculate their own claims and accrual rates, but so far the ones we've seen do it are usually dividing warranty costs by total revenue, which would lower the percentages even further. For instance, if we divided EMC's $155 million in claims by total revenue, the claims rate would be only 1.0% for 2008 instead of 2.5%.
The bottom line is that total revenue can include finance income, mortgage fees, royalties, service contracts, rentals, interest and dividends. And we doubt anybody could argue that those revenue sources are generating any warranty costs. But it does result in lower percentages when we have to include them, doesn't it?
Welcome NetApp
At the opposite extreme, a data storage company that didn't initially follow the late 2002 accounting rules regarding warranty disclosures has in recent years begun to do so. Network Appliance Inc., now known as NetApp Inc., began reporting its warranty costs in the middle of 2008, and at that time also provided historical data that went back to the middle of 2007. So in Figure 7 we've included the 12 quarters of warranty data that are available to us.
Figure 7
NetApp Inc.
Warranty Claims & Accrual Rates, 2003-2010
(as a percentage of product sales)
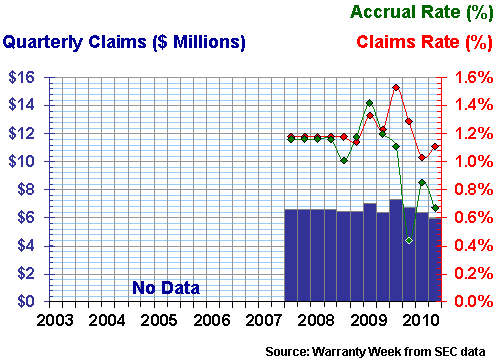
The reason the first four pairs of dots are identical because we simply took an annual report and chopped it into four identical pieces. It's likely that NetApp's claims and accrual rates were slightly above or slightly below 1.2% during that year, but 1.2% is the average for the year.
While we're at it, we're going to skip over some of the usual companies we profile (such as SanDisk and Quantum) to take a look at a completely new enterprise storage company called 3Par Inc. Though the company was founded in 1999, it didn't go public until 2007, and it didn't begin reporting its warranty costs until 2008. But at that time it provided historical data going back to April 2006, so in Figure 8 below we have 17 consecutive quarters of data to examine.
Figure 8
3Par Inc.
Warranty Claims & Accrual Rates, 2003-2010
(as a percentage of product sales)
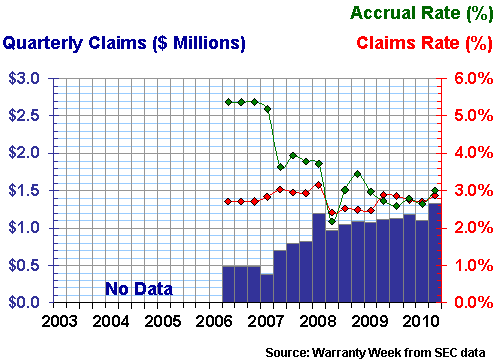
Notice how accruals began at a relatively lofty 5.4% rate before gradually falling to rates closer to the 2.7% to 3.2% range where claims could be found. It's as if the company estimated high and then brought those estimates down to the level of actual expense rates. And for three years running, the two rates have been extremely close together. And that's a sign of a good company that triangulates, corrects, and fine-tunes its estimates as it goes.
Product Warranty Series
This is the second in a series of 11 industry-by-industry newsletters that examine product warranty claims and accrual trends in detail over the past eight years. Links to the others in the series are included below, in case you've missed any.
September 16: Computer Warranty Claims & AccrualsSeptember 23: Data Storage Warranties
October 7: HVAC & Appliance Warranties
October 14: New Home Builders & RV Maker Warranties
October 21: Construction Equipment Warranties
November 5: Aerospace Warranties
November 11: Security Equipment Warranties
November 18: Automotive OEM Warranties
December 2: Automotive Supplier Warranties
December 16: Medical & Scientific Equipment Warranties
December 23: Telecom Equipment Warranties
Claims & Accruals: No news is good news as the computer industry's top warranty providers turn in predictable warranty expense reports. Despite economic turmoil, new product launches and multiple recent acquisitions, claims and accrual rates just aren't changing much.September 16, 2010 Warranty Maturity Model: As a proof of concept, IDC and the iWCM are asking all warranty professionals to take a brief survey to help verify that their responses can be used to assign a relative level of maturity to their warranty processes.October 1, 2010


