HVAC & Appliance Warranties:
Both claims and accruals have taken a nosedive this year. But that's good news if it's the result of increased quality and reduced cost, rather than merely a symptom of slowing sales. The problem is, it's hard for external observers to tell the difference.
The systems that heat, cool, refrigerate, cut, groom and clean for us also throw off a considerable amount of warranty expense. Besides passenger cars and computers, major appliances are probably the most warranty-intensive products on the market.
So far in 2010, the 33 or so U.S.-based HVAC and appliance companies have spent a collective $1.08 billion on warranty claims, and have set aside $1.18 billion in warranty accruals. Claims have consumed roughly 1.1% of their combined product revenue, while accruals were equal to 1.2% of product revenue.
The good news is that sales are beginning to pick up again. Eight out of the top 10 warranty providers in this sector saw sales rise since the middle of 2009, led by Johnson Controls Inc., owners of the York International brand, which reported a 28% rise in product and system sales for the period ended June 30, 2010.
The net effect is that as sales rise, warranty accruals rise in proportion. Meanwhile, the latest claim totals reflect repair costs for products sold in the slow years, so that metric should be falling. And indeed they are: The claims total for the first half of 2009 was $1.2 billion (11% higher than this year) while the accrual total was $1.1 billion (9% lower).
The bad news is that more sales this year means more claims next year. However, we hope that during the recession companies learned not only how to cut costs but also how to raise product quality, how to detect problems sooner, and how to design systems that are cheaper and easier to fix.
Mergers and Acquisitions
In Figure 1, we're tracking the claims total reported by all HVAC and appliance makers since 2003. We should note that the names have changed quite significantly over the years through mergers and acquisitions. So what we've done is to add together the totals for all the companies that are now or ever have been in the industry, going back 30 quarters.
The net effect is that we're counting companies such as Johnson Controls both before and after they acquired York, Ingersoll-Rand plc both before and after they acquired Trane, and Whirlpool Corp. both before and after they acquired Maytag. In other words, it's as if the 33 companies now in the industry were always in the industry, even when they weren't.
Figure 1
HVAC & Appliance Industries
Warranty Claims Paid, 2003-2010
(in US $ millions per quarter)

Admittedly, this approach may inflate the totals somewhat, but there's already plenty of that from other sources. For instance, one of the biggest warranty providers in the HVAC and appliance industries is United Technologies Corp. thanks to its Carrier product line. But the company also makes elevators, helicopters and jet engines. And the warranty expenses from those product lines is also included in Figures 1 through 4. However, there's really no alternative. Companies report only their totals, and not figures for each product line. So it's the same problem with Ingersoll-Rand and Johnson Controls, both before and after their acquisitions.
A quick glance at Figure 1 reveals that warranty claims peaked in the second quarter of 2007, at a level of $735 million. The lowest level they've ever reached came in 2003, when the total was barely over $400 million. but one should also note the recent falloff in claims, from a level of $650 million in 2009's third quarter to $621 million in the fourth quarter, to $571 million in 2010's first quarter, and finally to $513 million in the second quarter. As mentioned, this is a lagging effect of the recession. Claims are likely to begin heading up again later this year and on into 2011.
The Other Side of Claims
Claims are what's spent fixing products that were sold a year or two ago. Accruals are what's set aside from current revenue, in order to finance future repairs. So if one assumes that neither repair costs nor product quality are changing, this metric should rise and fall in exact proportion with product sales.
That never happens, of course, because repair costs and product quality actually do change over time. But the data in Figure 2 does show both an earlier peak and a deeper trough than Figure 1. The peak in accruals came in the third quarter of 2006, when accruals hit a level of $724 million. The trough in 2003 was $415 million -- somewhat higher than claims were at the time.
However, the really interesting decline came in 2007-2009. While accruals went up and down quite a bit, the trend was always downwards. By the first quarter of 2009, warranty accruals in the HVAC and appliance industries had bottomed out at $537 million. In 2009's second quarter, there was only a slight rise, to $548 million. And this half-year, most would agree, corresponded to the bottom of the recession.
Figure 2
HVAC & Appliance Industries
Warranty Accruals Made, 2003-2010
(in US $ millions per quarter)

That recession has now officially ended, but the warranty accrual figures for 2010 aren't suggesting a very meaningful recovery. In fact, in the second quarter of 2010 accruals reached a new low of $532 million. And it's not because there's missing data. All the major players have reported their first-half 2010 warranty expenses. And while United Technologies and Whirlpool made massive cuts to their accruals, Ingersoll-Rand and Jarden Corp. added to theirs. So we don't have a ready reason for this new trough that seems to be developing.
Cost As a Percentage of Sales
There's also no explanation to be found when claims and accrual totals are compared to product revenue. The percentage rates in Figure 3 show decreases in 2010, but they come in the wake of multi-year highs reached in 2009. In fact, in the seven-and-a-half years we've been tracking the industry, the claims rate has never been higher than it was during the four quarters of 2009, and the accrual rate has surpassed its late 2009 peak of 1.3% in only one of the 27 preceding quarters.
Figure 3
HVAC & Appliance Industries
Warranty Claims & Accrual Rates, 2003-2010
(as a percentage of product revenue)

If we had no choice but to take our best guess, the story that makes the most sense is that HVAC and appliance manufacturers, greatly impacted by the 2007-2009 recession, got very serious about cost-cutting and quality-raising. Last year, they finally managed to reverse the rise in warranty costs, and in 2010 they're enjoying the benefits of all that hard work and sacrifice. But that's just a guess.
Downward Trend at United Technologies
And then there are the companies that have been driving down their warranty costs for years, during and in spite of the recession. There's no better example of this that United Technologies. In Figure 4, the downward trend is almost linear, except for a spike in 2008 and a dip in 2003.
Figure 4
United Technologies Corp.
Warranty Claims & Accrual Rates, 2003-2010
(as a percentage of product revenue)
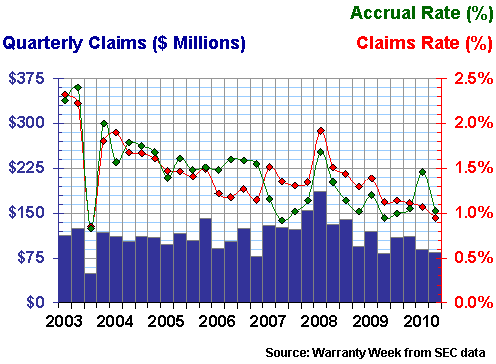
That dip, by the way, is really nothing to worry about. We don't know the cause, but in speaking with other companies it seems to be nothing more than a timing issue, which for instance can happen when a supplier makes a huge warranty payment to an OEM after exhausting all their delaying tactics. Or it might be a timing issue with the OEM's own claims payments: Something that should have fallen into that quarter was shifted to the quarter before or the quarter after the dip. You'll see similar notches taken out of the data in Figures 5 and 6, for instance.
United Technologies, though, has never before seen its claims rate dip below one percent. And while that's a mix of air conditioners and airplanes (not to mention elevators, fuel cells and fire alarms), it's still worth celebrating. The company's accrual rate, meanwhile, was a little lower a year ago, was even lower three years ago, and was even lower during that brief 2003 dip. But the long-term trend is clearly downwards, from as high as 2.4% seven years ago to just over 1.0% now.
Long-Term Stability at Whirlpool
In Figure 5, Whirlpool shows one spike and two dips in its data. And the accrual rate headed noticeably higher this year. However, if anything, the long-term trend is one where both the claims and accrual rates remain close to their 3.2% long-term average. So the story in this snapshot is one of stability (with a few stumbles).
Figure 5
Whirlpool Corp.
Warranty Claims & Accrual Rates, 2003-2010
(as a percentage of product revenue)
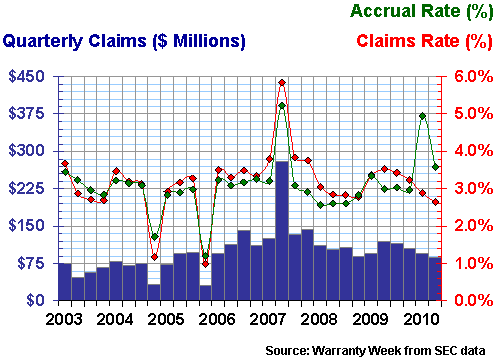
One thing the snapshot doesn't show is a puzzling shift in accrual patterns this year. Whirlpool set aside an uncharacteristically large $165 million sum in first quarter accruals, versus only $81 million in second-quarter accruals. But since its average accrual total for the past 10 quarters has been $106 million per quarter, we'd assume it was just one of those time-shifts rather than a quality crisis.
A similar phenomenon was seen at United Technologies. In the first quarter of 2010, the company set aside $122 million in accruals. But then in the second quarter it cut that total to $67 million. But again, with a 10-quarter average of $102 million, it looks like just some time shifting of accruals.
These time shifts might explain most of the downturn in accruals we saw in the second quarter. Whirlpool was $25 million below trend, and United Technology was $35 million below trend. Add those to the $532 million total seen in the second quarter and you're reasonably close to the industry's $605 million quarterly average.
Buying an HVAC Company
After a quick glance at Figure 6, Ingersoll-Rand may look like a company in trouble. But it's not. Instead, it's a company whose involvement with HVAC and refrigeration extended just to food retail display cases and refrigerated trucks until it acquired Trane late in 2007. And then in 2008, claims and accruals began to climb.
Figure 6
Ingersoll-Rand plc
Warranty Claims & Accrual Rates, 2003-2010
(as a percentage of product revenue)
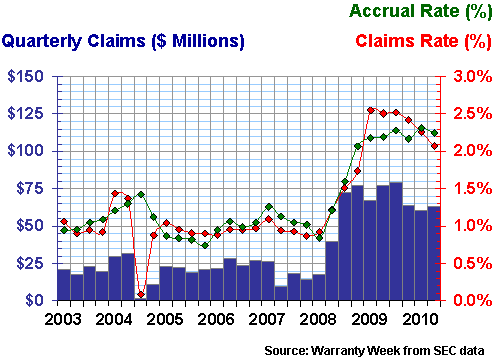
In fact, the company's claims total grew to $40 million in the second quarter two years ago and then to $77 million in the same quarter a year ago. For the past three quarters, however, claims have remained within a range of $60 to $64 million per quarter. and thanks to increasing sales, the claims rate is actually now falling. It peaked at 2.55% early last year, but was most recently down to 2.07%. That's not quite as low as it was before the Trane acquisition, but at least it's no longer climbing.
Cost Climbing Even Faster
Even scarier is the climb seen in the warranty data for Johnson Controls in Figure 7. Instead of rates doubling from the one percent range to the two percent range, as was seen for Ingersoll-Rand, here we see rates climbing from the 0.2% range in 2003-2005 to more than one percent in 2009.
But again, it's an HVAC acquisition. In this case, Johnson Controls acquired York International in 2005. And almost immediately, its claims and accrual rates began to climb.
Figure 7
Johnson Controls Inc.
Warranty Claims & Accrual Rates, 2003-2010
(as a percentage of product revenue)
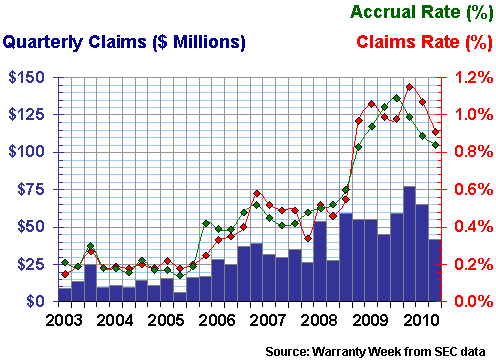
On the one hand, we'd suggest there's nothing to worry about. Even the 1.15% peak in 2009 is fairly low for an HVAC manufacturer. On the other hand, we estimate that only 17% to 20% of the company's total revenue comes from York's HVAC product line. More than half the company's revenue still comes from automotive products such as seating, instrument panels, and batteries. And almost a quarter comes from services.
In other words, that 20% of revenue is responsible for way more than 20% of warranty expense. How much more we couldn't say without making some mighty assumptions. But the point is that the HVAC acquisition explains only 2006, 2007 and 2008. We don't know how to explain the second rise we see in 2009 and 2010.
Hot Water Heaters
Finally, we wanted to spotlight an HVAC supplier that we haven't previously included in our annual industry profiles. A.O. Smith Corp. is perhaps best-known for its residential water heaters. But it also makes electric motors. And in fact, during a rich history that goes all the way back to 1874, the company has made everything from bicycle frames to B-25 bomber parts.
In more modern times, A.O. Smith has seen its warranty costs gradually rise, from a 2.0% average back in 2003 to something above 4.0% in 2009. The good news, though, is that its claims rate has now fallen for five consecutive quarters, and its accrual rate is lower than it's been in a year-and-a-half.
Figure 8
A.O. Smith Corp.
Warranty Claims & Accrual Rates, 2003-2010
(as a percentage of product revenue)
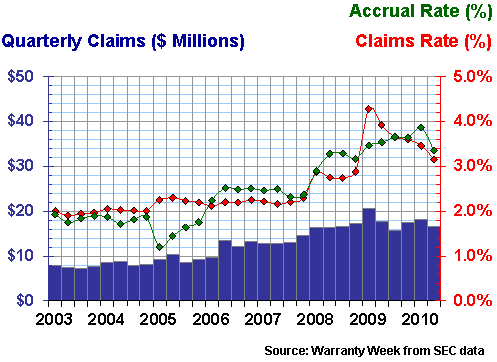
In addition, it looks like the recent rise has more to do with falling sales rates and less to do with rising warranty costs. For instance, in the first half of 2008, claims totaled $32.8 million while sales totaled $1.194 billion, so the claims rate was 2.7%. In the first half of 2009, claims rose to $38.4 million while sales fell to $980 million, so the claims rate was 3.9%. And then in the first half of 2010, claims fell to $34.6 million while sales rose to $1.096 billion, and the claims rate fell to 3.2%.
Victims of Math?
It's probably just the math that's causing the recent rises at Ingersoll-Rand and Johnson Controls as well. Sales go down so the percentages go up, even if quality and reliability remain the same. After all, which industry's sales have been hit harder by this recession than the building trades and automotive? The homes that weren't built didn't get new HVAC systems. And who had the cash to go shopping for new appliances?
Next week, we'll look at new home sales and the associated warranty expenses of the builders. In just glancing at the data, it looks like major builders such as NVR, D.R. Horton, and Beazer Homes are reporting huge sales gains this year. Then again, others such as Lennar, Hovnanian, and Toll Brothers are still showing sales declines. But five of these six have also reduced their claims rates. Which ones? See you on October 14.
Product Warranty Series
This is the third in a series of 11 industry-by-industry newsletters that examine product warranty claims and accrual trends in detail over the past eight years. Links to the others in the series are included below, in case you've missed any.
September 16: Computer Warranty Claims & AccrualsSeptember 23: Data Storage Warranties
October 7: HVAC & Appliance Warranties
October 14: New Home Builders & RV Maker Warranties
October 21: Construction Equipment Warranties
November 5: Aerospace Warranties
November 11: Security Equipment Warranties
November 18: Automotive OEM Warranties
December 2: Automotive Supplier Warranties
December 16: Medical & Scientific Equipment Warranties
December 23: Telecom Equipment Warranties


