New Home Builders & RV Makers:
Even among the survivors of the Great Recession, warranty costs are now rising to alarming levels. And for some builders, home sales are still falling year-over-year. The result is a state of affairs where warranty work is financed from a shrinking pool of reserves.
Besides passenger cars, no industry sector was quite as hard-hit by the recession as was homebuilding. Sales were down for multiple years, and manufacturers were forced to fix last year's models with a declining pool of warranty reserves from this year's sales.
Some didn't make it. In fact, the attrition was especially severe within the subset of companies that made modular and prefabricated homes, mobile homes, and driveable recreational vehicles. And we know of at least 20 site-built home builders who are no longer with us because of bankruptcies and/or mergers. And that's just among the builders that grew large and prosperous enough to become publicly-traded companies.
We're very happy to report that a quick glance at Figures 1 & 2 suggests that the bottom of this housing-centric recession is now behind us. How far behind us is still open to debate, however. The recession didn't officially begin until late 2007, and didn't officially end until the middle of 2009. But the peak in housing sales volumes and unit prices came earlier than that, in late 2006, and that timetable seems to agree with the peak seen in Figure 2.
And then there's the question of when it ended. The quarterly claims totals in Figure 1 hit bottom just recently, with only $106 million in claims paid during the first quarter of 2010. But the quarterly accrual figures charted in Figure 2 hit bottom a full year before, with only $62 million in accruals counted during the first quarter of 2009. Either way, both warranty metrics are up from those lows now.
The Recovery Begins
For the first half of 2010, claims paid by some 26 different homebuilders and recreational vehicle makers totaled $235 million, up 2.9% from $228 million in the first half of 2009. Compared to their respective product revenue totals, their average claims rate actually fell, from 1.7% last June to 1.5% in June 2010. And that's due almost entirely to their collective 29% rise in new home sales revenue.
Figure 1
New Home Builders & RV Makers
Warranty Claims Paid, 2003-2010
(in US $ millions per quarter)

We should note that because of the disappearance of several top manufactured home and recreational vehicle companies such as Champion Enterprises Inc., Fleetwood Enterprises Inc., and Monaco Coach Corp., we're now including warranty data from some leading RV-only companies such as Thor Industries Inc., All American Group Inc., and Winnebago Industries Inc. in the new home category. Readers who would prefer to see the data for just site-built homes should contact the editor at change@warrantyweek.com.
Champion, Fleetwood, and Monaco used to be among the top 100 warranty providers based in the U.S. So was Centex Corp., until it was acquired by PulteGroup Inc. last year. In addition, Beazer Homes and M.D.C. Holdings Inc. have been on and off the top 100 list over the past seven years. Of the RV companies we're adding in to this year's mix, the only top 100 member is Thor Industries.
Sales Are Up
Of the 26 companies we're tracking this year, fully 18 have seen their product sales revenue rise since last June. Only eight have seen their sales totals fall further, and of those eight, only KB Home, Lennar Corp., and Hovnanian Enterprises Inc. are also among the top 100 warranty providers.
Rising sales means rising accruals, and indeed, the data in Figure 2 shows that three of the last six quarters have seen accrual totals above $80 million. However, the fourth quarter 2009 total, at $94.3 million, was about $817,000 higher than the second quarter of 2010.
For the first half of 2010, homebuilding accruals are up 23% in dollar terms, from $131 million in the first half of 2009 to $161 million in the first half of 2010. But because sales are also up, the accrual rate at midyear was up only slightly, from 1.0% in 2009 to 1.1% in 2010.
Figure 2
New Home Builders & RV Makers
Warranty Accruals Made, 2003-2010
(in US $ millions per quarter)

The peak for accruals came in the last quarter of 2005, at a level of $413 million. For claims, the absolute peak came in the third quarter of 2006, at a level of $315 million. Therefore, for both their peaks and troughs, claims lagged accruals by six to 12 months. In other words, homebuilders more or less correctly anticipated the increased or reduced need for funds to pay for warranty work. So when sales fell and there were less homes to repair, there was also less cash on hand to pay for the repairs.
Now, it's quite the opposite effect. Sales are rising so the homebuilders need to plan for an increase in repairs. Among the sales gainers who are also in the top 100, PulteGroup saw a merger-related 93% rise in homebuilding revenue in the second quarter, compared to a year ago. Thor Industries Inc. saw its RV revenue climb by 64%. NVR Inc. is up by 55%, and D.R. Horton Inc. is up by 54%. Each of these sales gains has helped reduce their claims rate.
Accruals Remain Steady
These sales gains shouldn't affect their accrual rates, however, in that accruals should always remain proportional to sales. If the accrual rate was one percent last year, it should still be one percent this year, unless a rise in defects and/or repairs is expected. In fact, the average accrual rate has been fairly stable over the past seven-and-a-half years.
As can be seen in Figure 3, the industry's long-term average accrual rate has been extremely close to 1.1% since at least 2007. The average accrual rate first fell below 1.3% in 2003 and went below 1.2% in 2005. It briefly dipped below 0.9% in the middle of the recession year of 2007. And it once was a bit over 1.3%.
Figure 3
New Home Builders & RV Makers
Warranty Claims & Accrual Rates, 2003-2010
(as a percentage of product revenue)

In contrast, the claims rate has been trending higher since at least the middle of 2006. Part of this percentage increase is related to falling sales, of course, but some of it reflects rising costs. As we shall see in Figures 4 through 8, several of the major builders have seen their warranty claims costs recently rise to new heights. We suspect some of that is related to all the problems they've been having with mold, leaks, and Chinese drywall, among other maladies.
What we can't explain is why in early 2007 the homebuilders allowed claims to outpace accruals, and why they've allowed this to continue for the past ten quarters. In the charts below, we shall see not only a rising claims rate (the red line) but also a widening gap between the claims and accrual rates.
The Renamed PulteGroup
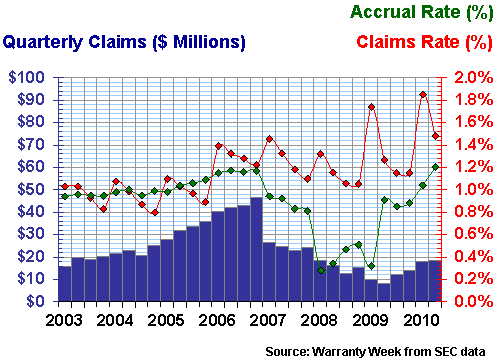
Let's begin our company snapshots with the Pulte Group, the new name (since March) of Pulte Homes. During the years 2003-2006, the company saw claims follow a seasonal pattern while accruals gradually rose. But then in 2007, the seasonal pattern in claims continued while accruals were radically cut. And then in 2009 and 2010 accruals rose while the ever-higher first-quarter peaks in the claims rate continued.
Compared to June 2010, PulteGroup's claims rate has risen from 1.3% to 1.5% over the past year, while its accrual rate has risen from 0.9% to 1.2%. Thanks to the funds it gained through the mergers with Centex and others, however, its warranty reserve has just about doubled in size, from $42 million a year ago to $84 million now.
Figure 4
PulteGroup Inc.
Warranty Claims & Accrual Rates, 2003-2010
(as a percentage of product revenue)
Lennar suffered an even larger increase in its claims rate. A year ago it was 1.9%. Now it's 3.2%. And its accrual rate is still at 1.0%. And sales are down 12%. It's therefore no surprise to discover that Lennar's warranty reserve balance has contracted by $16 million to its current size of $126 million over the past year.
Of the 26 companies we're tracking in this sector, 19 reduced their claims rate from June 2009 to June 2010. PulteGroup and Lennar are two of only seven homebuilders or RV makers to see that rate rise.
Among the same 26 companies, 16 reduced their accrual rates over the past year. Ten saw it rise, including top 100 warranty providers such as PulteGroup, Thor Industries, and NVR Inc.
And within this same group of 26 companies, only 11 allowed their warranty reserve balance to increase over the past year. And amazingly, PulteGroup's doubling was only the second largest, behind Cavco Industries' one-year jump from $5.4 million to $13 million in reserves.
Triple Whammy
Lennar was one of the 15 companies that allowed its warranty reserve to contract, as did D.R. Horton and KB Home. Also, Lennar and KB Home were two of only three companies to see all three warranty metrics go against them: rising claims, falling accruals, and declining reserves. And all three also saw sales fall.
Figure 5
Lennar Corp.
Warranty Claims & Accrual Rates, 2003-2010
(as a percentage of product revenue)
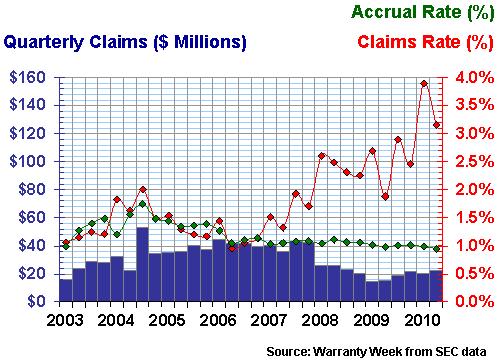
What worries us about the data in Figure 5 is how Lennar saw its claims rate peak at 3.9% at the beginning of this year. It's never been higher. In fact, until this year it was never above three percent. And it's never been so far above the company's accrual rate.
Chinese Drywall Problems?
Look back at Figure 3. There's nothing "normal" about a 3.9% claims rate in the homebuilding industry. But then again, Lennar is one of the few companies to step up and deal with its Chinese drywall problem effectively. So it's possible that by the time the lawyers are all done with the other builders affected by that problem, Lennar's drywall-related costs will be far behind it.
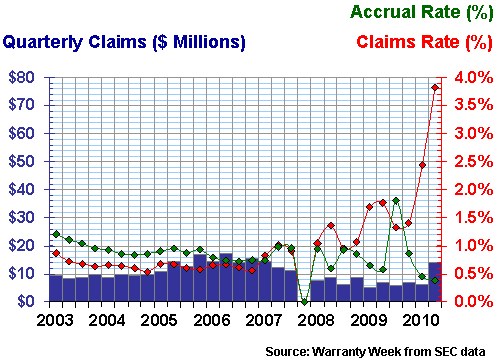
As mentioned, KB Home saw its warranty metrics go against it in the past year. Its claims rate rose from 1.8% to 3.8%. Its accrual rate fell from 0.6% to 0.4%. And its warranty reserves fell from $138 million to $118 million. We should add that sales were also down, but by only 3%.
There was one quarter at the end of 2007, which is clearly visible in Figure 6, in which KB Home made no net accruals and paid no net claims. and, in fact, both its claims and accrual rates have been noticeably more erratic since then. What happened? They'll never tell. But they also now have a claims rate at an all-time high, and an accrual rate at only 0.4% at last check.
Figure 6
KB Home
Warranty Claims & Accrual Rates, 2003-2010
(as a percentage of product revenue)
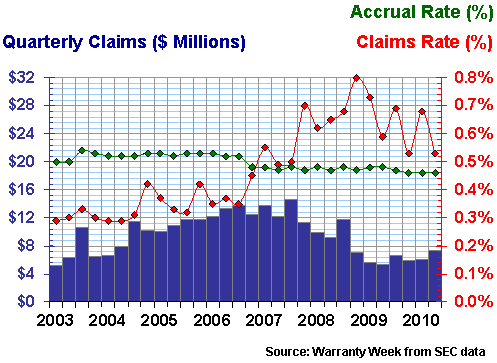
For D.R. Horton, the news is marginally better. Its accrual rate fell only marginally, from 0.48% to 0.46%. And its claims rate fell only marginally, from 0.59% to 0.53%. In Figure 7, it looks as if the company tried its best to keep its accrual rate as close as possible to 0.5%. And then there are four years in which the claims rate was lower, followed by three-and-a-half years where it was higher.
The peak claims rate, of 0.8% in late 2007, is really nothing to worry about. Sales were falling at the time and accruals were always proportional. The only point of concern we can find is that the company has allowed its warranty reserve to contract by $15 million to $49 million over the past year.
Figure 7
D.R. Horton Inc.
Warranty Claims & Accrual Rates, 2003-2010
(as a percentage of product revenue)
Finally, we wanted to include one of the smaller homebuilders, called M/I Homes Inc. Everything seems to be going in the right direction for the company. Sales are up 71%. Its claims rate has fallen from 1.3% to 1.0% during the past year. Accruals are unchanged at 0.9%. And the warranty reserve has grown from $7.5 million to $8.5 million.
What caught our eye was the near straight line for the company's accrual rate during the past two years. D.R. Horton has been consistent for 30 quarters. But M/I Homes has been virtually unchanged for eight quarters in a row. And it's not a math mistake. The accrual rate has oscillated all the way from 0.88% to 0.89%, and once in late 2008 it even hit 0.87%. Clearly, this is a company that knows its costs and plans accordingly.
Figure 8
M/I Homes Inc.
Warranty Claims & Accrual Rates, 2003-2010
(as a percentage of product revenue)
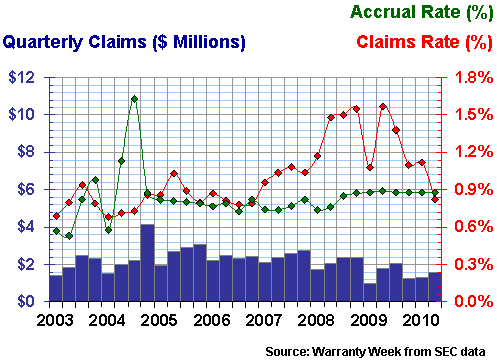
The problem is, M/I Homes' claims cost has only recently fallen below its accrual rate. As is the case with most of the companies in Figures 4 to 7, M/I Homes has allowed its claims rate to soar while keeping accruals low. Maybe it helped them get through the recession? Perhaps it was smart to use up some reserves during an incredibly deep downturn in sales?
At least for M/I Homes, the risk seems to have paid off. Sales are up, claims rates are down, and warranty reserves are once again growing. But what will the charts look like for Lennar and KB Home in a year or two? Right now, they're two of only four companies in this industry sector to suffer from both declining sales and claims rates over three percent.
Product Warranty Series
This is the fourth in a series of 11 industry-by-industry newsletters that examine product warranty claims and accrual trends in detail over the past eight years. Links to the others in the series are included below, in case you've missed any.
September 16: Computer Warranty Claims & AccrualsSeptember 23: Data Storage Warranties
October 7: HVAC & Appliance Warranties
October 14: New Home Builders & RV Maker Warranties
October 21: Construction Equipment Warranties
November 5: Aerospace Warranties
November 11: Security Equipment Warranties
November 18: Automotive OEM Warranties
December 2: Automotive Supplier Warranties
December 16: Medical & Scientific Equipment Warranties
December 23: Telecom Equipment Warranties
Warranties: While sales fell in 2008, warranty claims continued to rise well into 2009. So some of the top construction equipment makers saw their claims rates reach all-time highs last year. In the first half of 2010, however, things seem to be getting back to normal.October 21, 2010


