Construction Equipment
Warranties:
While sales fell in 2008, warranty claims continued to rise well into 2009. So some of the top construction equipment makers saw their claims rates reach all-time highs last year. In the first half of 2010, however, things seem to be getting back to normal.
One would expect the fortunes of construction equipment makers to rise and fall in lock step with the builders of the structures they make. But apparently they're not that tightly coupled.
In last week's newsletter, we detailed how the peak in accruals for the homebuilders came in the last quarter of 2005, at a level of $413 million. For claims paid, the homebuilders' peak came in the third quarter of 2006, at a level of $315 million.
But with just a quick glance at Figures 1 & 2 in this week's newsletter, it's clear that the peak for construction equipment warranty claims and accruals came much later than that, in the last quarter of 2008. That was two to three years after the peak came in homebuilding.
Tracking Yellow Goods
This week, we're tracking around 40 companies that make what some call "yellow goods," as opposed to white goods or brown goods. These are the makers of tractors, cranes, pavers, bulldozers, excavators, forklifts, and other typically yellow-colored vehicles that are used for construction projects, along with some hand-held power tools and other equipment typically found on a construction site.
There's a bit of crossover with industries such as farm machinery and mining equipment, but for the most part, this category is distinct from the makers of building materials, including fixtures, furniture, and appliances. They also have their own warranty costs. But those are the ingredients of a building. These are the tools -- the great, big earth-moving tools as well as the small ones that can fit into a pocket.
In Figure 1, we added together the quarterly claims payments of these 40 companies, along with claims reported by an additional 16 companies that have merged, been acquired, or gone out of business since 2003. Together, their claims totals peaked in the fourth quarter of 2008, at a level of $856 million. They've fallen steadily since that time -- most recently to $634 million per quarter -- but they haven't plummeted and bottomed out the way the homebuilders' figures did in 2009 (see Warranty Week, October 14, 2010).
Figure 1
Construction Equipment Industry
Warranty Claims Paid, 2003-2010
(in US $ millions per quarter)

Claims paid during the first half of 2010 reached $1.294 billion, a decline of 15% since the first half of 2009. The total for claims payments by all construction equipment makers in all of 2009 was $2.949 billion, which represented a slight 1% decline from 2008 levels. So if anything, the decline in warranty claims within this category may still be under way. It could fall further still.
Same Story for Accruals
It's much the same story for warranty accruals. The peak in late 2008 was $896 million. It was followed by a rather steep drop-off in early 2009, but rose to $758 million in late 2009 before falling again. The bottom of the decline may have been at the $503 million level in the first quarter of 2010, or it may still be ahead of us. Claims had their jagged ups and downs in 2003-2008, but have followed an uninterrupted downward trend ever since. Accrual totals continue to go up and down suddenly, following what appears to be a seasonal pattern.
Figure 2
Construction Equipment Industry
Warranty Accruals Made, 2003-2010
(in US $ millions per quarter)

For the first half of 2010, warranty accruals by the makers of construction equipment totaled $1.130 billion, a decline of 7% from 2009 levels. That's less of a fall than was seen with claims, but in this category accruals took an alarming 22% dive in 2009, from the $3.3 billion level in 2008.
Of course, these are merely raw dollar amounts that don't tell the whole story. Claims and accruals rise and fall with sales volumes, and one would hope that these peaks and valleys would flatten out a bit when the raw numbers are compared to sales. In Figure 3, however, we see quite the opposite: a highly seasonal pattern for six years, followed by soaring claims rates in 2009.
This was caused, we believe, by radically declining sales volumes. The products sold in 2007 and 2008, still under warranty, had to be fixed or replaced using a declining pool of 2009 funds. Because of that lag time, the ratio between claims and sales didn't begin to get back to "normal" until this year.
Seasonal Pattern in Construction
In contrast, the accrual rate remained in a highly seasonal pattern, peaking each year in the cold fourth quarter and falling to a low point during the first half of each year. And it remained within a moderately tight range. Even during the recession-bound year of 2009, the accrual rate went no higher than 1.7% and no lower than 1.4%.
Figure 3
Construction Equipment Industry
Warranty Claims & Accrual Rates, 2003-2010
(as a percentage of product revenue)

That late 2009 peak of 1.7% was the highest the accrual rate has ever been. Its lowest point came in early 2006, at 1.2%. Claims, meanwhile, topped out last year at 1.96%, and bottomed out in 204 at 1.09%.
It's no surprise that construction equipment warranty expenses follow the seasons. After all, construction activity itself favors the warm weather. And the colder, darker months are the perfect time to take the equipment offline for repairs. But what is surprising is how dramatically expenses peaked in 2009 -- not only in percentage terms but also in dollars spent -- just as sales were hitting bottom.
That's all behind us now, of course. As companies begin to report their third quarter financial figures, some are reporting sales gains of 50% or more over 2009 levels. For these 40 companies, we're calculating only a 3% gain in overall first-half sales. But nine of them had sales gains over 10% while three suffered sales declines of more than -20%. So there's actually quite a bit more volatility than the averages suggest.
Caterpillar at the Top
These are also some of the largest warranty providers around. Eleven of the top 100 U.S.-based warranty providers are members of this construction equipment category, led by the fifth-largest provider: Caterpillar Inc. In addition to GM, Ford, HP and Dell, Caterpillar is one of only five American companies to ever spend a billion dollars or more on warranty claims within a single year. And while Cat hit that spending level in both 2008 and 2009, it may fall a bit short of that $1 billion mark this year.
In Figure 4, we've charted Caterpillar's warranty claims and accruals for the past 30 quarters, not including the stellar quarterly figures it reported earlier this week. But these figures are stellar in their own way.
After getting a bit out of control in 2009, warranty costs are once again back in the "normal" range in 2010. The claims rate in June 2010 was 2.5%, down by almost a third from June 2009. And the accrual rate in June 2010 was 1.6%, which was also down by almost a third in a year.
Figure 4
Caterpillar Inc.
Warranty Claims & Accrual Rates, 2003-2010
(as a percentage of product revenue)
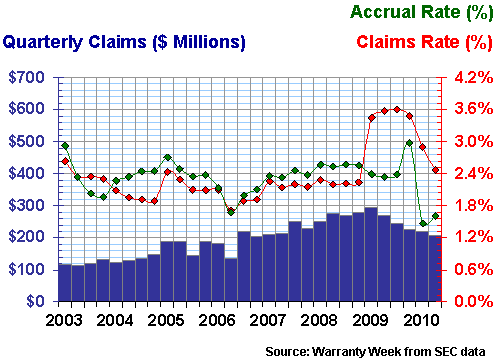
Readers will notice that the same 2009 peak seen in the industry's claims rate in Figure 3 seems to be present in Caterpillar's claims rate in Figure 4. Some might wonder whether Caterpillar is so large that it overshadows the 39 other members of this sector?
The answer is, it depends. In 2010, Caterpillar accounted for 33% of the sector's claims and 25% of its accruals. During the first half of 2009, Cat's claims were 37% of the total and its accruals were 30%. So of course, if the company sees claims spike for four quarters, so will the industry's.
Big Spikes in 2009
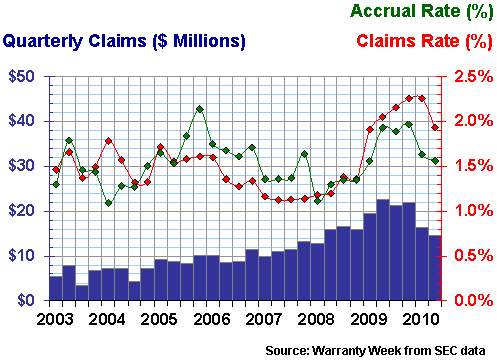
However, there's more to the story than that. Remember, there are 11 construction equipment vendors on the list of the top 100 warranty providers. And others saw the same spike in 2009. For instance, in Figure 5 we see a 2009 claims spike for Terex Corp. In Figure 6 we see a 2009 claims spike for Manitowoc. So it's not just Caterpillar that's moving the average.
Like Caterpillar, both Terex and Manitowoc saw their highest-ever claims rates in 2009, when current sales fell and claims that were left over from the boom years continued to arrive. But also like Caterpillar, things are starting to return to "normal."
Why do we put the word in quotes like that? Because what can be considered "normal" varies from one company to the next. Now that we have 30 quarters of data for each of these companies, we can readily detect when one of their warranty metrics goes well above or well below its typical range. We can't always say why, but we certainly can say who, what, and when. And in Figures 4, 5 and 6, we think we're seeing a recessionary dip in sales followed by a return to "normal."
Figure 5
Terex Corp.
Warranty Claims & Accrual Rates, 2003-2010
(as a percentage of product revenue)
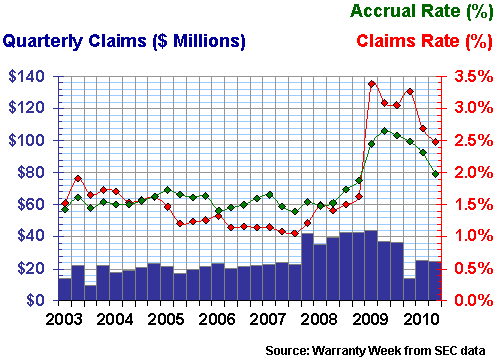
For Terex, one big reason why things have yet to return to "normal" is the continued decline in sales. First-half revenue was down 23% to $2.016 billion. Thankfully, claims were down 38% and accruals were down 42%, so both also rates fell. At midyear, Terex had a claims rate of 2.5% and an accrual rate of 2.0%. Both were still a little above historical averages, however. If we set aside the 2009 and 2010 data for a moment, Terex has a long-term average claims rate of 1.4% and an average accrual rate of 1.6%. It's still a bit above those levels.
Falling Sales, Claims & Accruals
It's much the same story at Manitowoc. Sales fell 22% to $1.6 billion. But claims fell 27% and accruals fell 37%, so both rates also declined. At midyear, Manitowoc has a claims rate of 1.9% and an accrual rate of 1.6%. However, until 2009, Manitowoc's long-term average rate for both warranty metrics was around 1.4% to 1.5%. So it's almost back to "normal" now, in spite of the slow sales recovery.
Figure 6
Manitowoc Company Inc.
Warranty Claims & Accrual Rates, 2003-2010
(as a percentage of product revenue)
And then there's always a few companies that don't follow the trend. Astec Industries saw sales rise 11% in the second quarter. But claims and accruals also rose, to June 2010 rates of 1.9% and 2.0%, respectively, up from 1.6% and 1.3% in June 2009.
What's peculiar about the chart in Figure 7 is how range-bound it seems. Neither Astec's claims nor accrual rate ever went above 2.0% nor below 1.2%. In fact, it's never strayed far from its 1.5% to 1.6% average, including during 2009.
Figure 7
Astec Industries Inc.
Warranty Claims & Accrual Rates, 2003-2010
(as a percentage of product revenue)
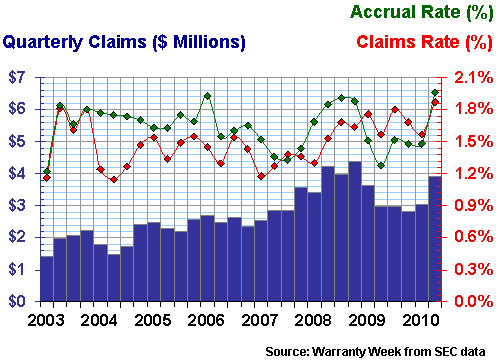
And while Astec's claims and accrual rates are now both at their highest-ever level, the accrual rate was almost as high in 2006 and the claims rate was almost as high in 2003. In other words, while there's not much damage from the recession, there's also not much improvement from an advancing warranty practice. Things are more or less where they've always been.
Sudden Spike in 2010?
Finally, we wanted to include a chart that at first looks a bit scary, but is actually nothing to worry about. The name says it all: Stanley Black & Decker Inc. is the post-merger home of both the Stanley Works and the Black & Decker Corp. So of course warranty metrics are soaring. The merger wasn't completed until the end of the first quarter of 2010.
Figure 8
Stanley Black & Decker Inc.
Warranty Claims & Accrual Rates, 2003-2010
(as a percentage of product revenue)
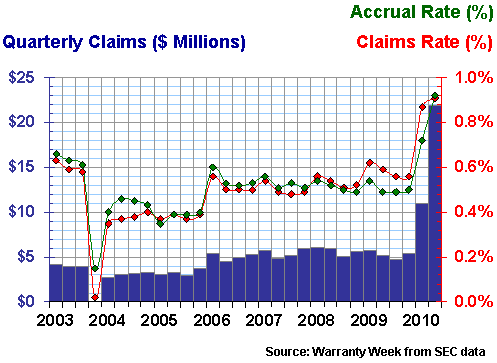
After the merger, Black & Decker became one of the 16 companies that left the list of construction equipment makers, and Stanley Works became a much bigger warranty provider. In the first quarter of 2010, Stanley added $52 million to its warranty reserve because of the merger, almost doubling its warranty reserve balance to $115 million. Last year, Stanley reported $21 million in claims for the entire year. Now, it reported more than that just in the second quarter.
The happy couple's warranty metrics are also a blend of the two companies. Back in 2009, Black & Decker reported claims and accrual rates close to 2.0%, while Stanley Works was closer to the 0.5% to 0.6% range. Now, together they're in the vicinity of 0.9% for both claims and accruals. And their combined sales for the first half of 2010 are up 20% from their separate sales totals for the same period in 2009.
If one didn't know about the merger, these metrics would seem grim. Yes, sales are up 20%, but the claims rate is up by more than half, from 0.6% to 0.9%. And the accrual rate has almost doubled, from 0.5% to 0.9%. And then there's a $48 million jump in the size of the warranty reserve. But taking the merger into account, it's not so bad at all. In fact, the combined companies are actually now spending less on warranty claims -- both in dollars and as a percentage of sales -- than they would if they were still separate.
Product Warranty Series
This is the fifth in a series of 11 industry-by-industry newsletters that examine product warranty claims and accrual trends in detail over the past eight years. Links to the others in the series are included below, in case you've missed any.
September 16: Computer Warranty Claims & AccrualsSeptember 23: Data Storage Warranties
October 7: HVAC & Appliance Warranties
October 14: New Home Builders & RV Maker Warranties
October 21: Construction Equipment Warranties
November 5: Aerospace Warranties
November 11: Security Equipment Warranties
November 18: Automotive OEM Warranties
December 2: Automotive Supplier Warranties
December 16: Medical & Scientific Equipment Warranties
December 23: Telecom Equipment Warranties


