

Truck Warranties:
Unlike passenger cars, the truck OEM isn't usually responsible for the vehicle's entire warranty. Instead, many of the suppliers and component manufacturers issue their own warranties, and pay their own claims.
Trucks are different from cars, not only in terms of size and cost, but also in how their warranties are structured. And this, we think, contributes to the way warranty costs are more evenly split between the OEMs and their suppliers.
This week, we're taking a closer look at a segment of the automotive industry that is usually lumped in with others: commercial, heavy, on-road trucks. We usually combine them with passenger cars, recreational vehicles and motorcycles. And sometimes we combine them with construction vehicles, farm and lawn-care machinery, and even mining equipment (as long as it has wheels).
Just Trucks
This time, we're going to look at just the makers of trucks. Yes, some make other types of vehicles. But we're going to exclude all the heavy vehicle makers who don't make on-road trucks. So that means no John Deere, Textron, or AGCO. And we're not including makers of just recreational vehicles, so no Winnebago or Thor Industries. But we are including Caterpillar Inc., because even though most of its construction vehicles are aimed at off-road applications, its diesel engines were until recently sold to OEMs for use in their on-highway transport vehicles.
We found a total of 27 companies in the "truck" business. Of those, we classified eight as OEMs, and 19 as suppliers. Navistar International Corp. and Paccar Inc. are the leading OEMs, while Caterpillar and Cummins Inc. are the leading suppliers, at least in terms of warranty costs.
Some of these companies could be counted as either an OEM or a supplier. We cannot, however, chop up their reported warranty expenses into OEM and non-OEM portions. Nor can we chop up their reported warranty expenses by product line, or by industry served. It's either all in, or all out.
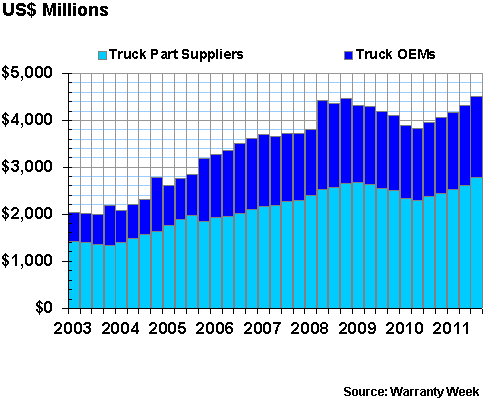
As can be seen in the chart below, claims payments peaked in the truck-building industry in late 2008, at a level of $767 million. That was also the peak period for the truck OEMs, although claims paid by their suppliers kept growing into early 2009. As with all industries, claims peaked after sales did, because there's (hopefully) a bit of lag time between when a product is sold and when it needs repairs.
Figure 1
Warranty in the Automotive Sector
Claims Paid by U.S.-based Truck Makers
(in US$ millions, 2003-2011)
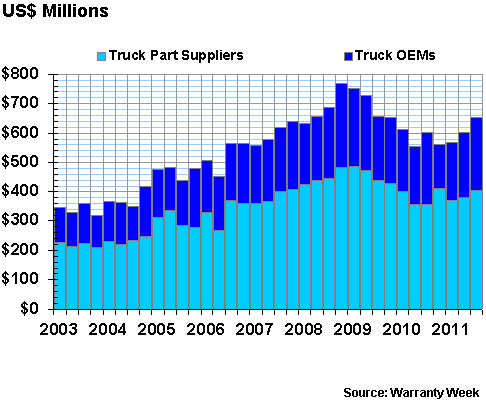
Note that after the peak, claims payments continued to decline well into 2010. But so far in 2011, the trend has been up. Let's not get too excited about this -- after all, we're tracking the cost of failures here -- but it does suggest that activity in this industry segment is indeed picking up after the end of a severe economic downturn.
Multiple Warranties per Vehicle
As in the aerospace industry that we detailed in last week's newsletter, the amount of claims paid by the truck OEMs is dwarfed by the claims payments of their suppliers. This, we believe, is caused by the traditional structure of warranties in the truck industry.
In the passenger car and personal computer industries, the OEMs put their names on the product and they are the only brands facing the consumer. As far as the buyer knows, there's only one warranty: the OEM's.
Problems with the disk drives or the engines? Those go through the OEMs first, and then the OEMs pursue their suppliers for reimbursements. And those reimbursements aren't always so easy to get. So in those industries, the brand-name, consumer-facing OEMs end up paying upwards of 80% of the total warranty cost.
But in the commercial aerospace and on-road truck industries, the customer is usually another business, not a consumer. And the engine manufacturers and some of the other major component manufacturers issue a separate warranty directly to the buyer. So if there's an engine warranty claim, the engine manufacturer handles it. If there's a problem with the avionics or the entertainment system, the OEM isn't going to pay the claim and then seek reimbursement from the supplier.
In fact, one of the challenges of fleet management is figuring out which warranty goes where. The OEM's name may be on the product, but they're directly responsible for only a small portion of the vehicle's warranty. So if it's an engine problem, the fleet manager first has to figure out whose engine is in the truck, when it was made, whether it's still under warranty, and how to contact that engine manufacturer.
With both planes and trucks, the OEMs therefore end up paying much less than 100% of the claims. In Figure 1, the OEMs are generally paying only about 35% to 40% of the total bill, while their suppliers are paying 60% to 65%.
This is around the same ratio as was found in the aerospace industry in last week's newsletter. So we think we're onto something here: with both planes and trucks, suppliers seem to pay two-thirds, while OEMs pay one-third of the total claims volume.
The ratio between the OEMs and their suppliers was at its most lopsided in late 2010, and was closest to balanced in late 2005. So it's not always 60/40 or 65/35. But we can't find any cause for the timing of either of those extremes, except perhaps unusual claims payment patterns for some of the larger manufacturers.
Accrual Split More Variable?
The story is much the same with warranty accruals. The OEMs account for only about 35% of the total industry's accruals, while their suppliers account for an average of 65%. But the extremes have been even greater than with claims. Suppliers accounted for more than three-quarters of accruals at the end of 2010, and in late 2004 the OEMs actually accounted for slightly more than half the total during one unusual quarter.
The peak also came a bit sooner with accruals than it did with claims. There were three quarters in 2008 in which the industry's accruals exceeded $700 million. And there was one quarter in 2009 where the total reached $723 million. But the really exciting news is that according to the data in Figure 2, truck manufacturers accrued more in the third quarter of 2011 than ever before.
Figure 2
Warranty in the Automotive Sector
Accruals Made by U.S.-based Truck Makers
(in US$ millions, 2003-2011)
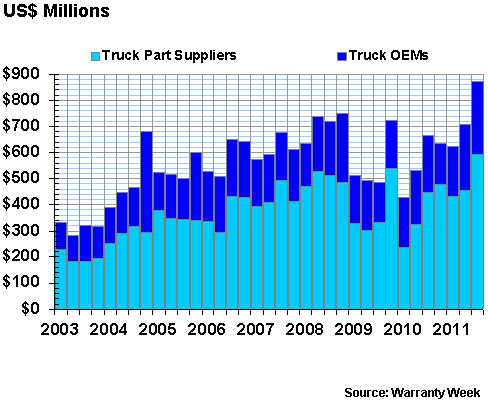
What does this mean? Conveniently, accruals are closely tied to sales. And fortunately, sales are up! For the OEMs, the year-over-year sales growth rate was 10% as of September 2011. And for their suppliers, the growth rate was an incredible 40%, year-over-year. For both groups together, product sales grew by 28%. Sales gain leaders included Paccar (+65%), Caterpillar (+47%), Cummins (+44%), and BorgWarner Inc. (+30%).
Therefore, of course their accruals are reaching new heights. So are their sales. They're rising proportionally. As can be seen in Figures 3 and 4, their accruals as a percentage of sales are about the same as they've been for years.
Warranty Cost as a Percent of Sales
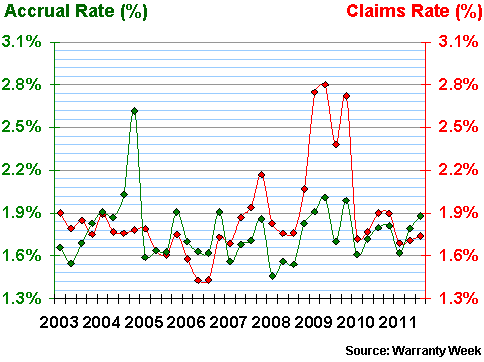
The percentage data for the suppliers is in Figure 3. The percentage data for the OEMs is in Figure 4. And they both tell the same general story: had it not been for the recent recession, there really wouldn't be much change in either claims or accrual rates over the past nine years.
Figure 3
U.S.-based Truck Parts Suppliers
Average Warranty Claims & Accrual Rates
(as a % of product sales, 2003-2011)
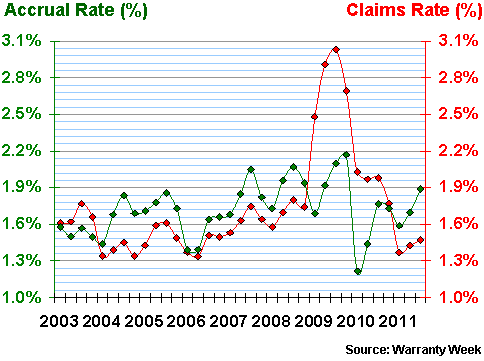
One can see the same recent spike in claims rates in the supplier data (above) and the OEM data (below). The four quarters of 2009 were real bad for the claims rate, but that was primarily because sales were real bad. And if you scroll back to Figure 1 for a moment, you'll also see that 2009 was the peak in terms of claims payments. And that's a recipe for a spike in the ratios: high expenses and low sales.
Figure 4
U.S.-based Truck OEMs
Average Warranty Claims & Accrual Rates
(as a % of product sales, 2003-2011)
The only period that doesn't seem to follow the script is the fourth quarter of 2009. As can be seen in Figure 2, accruals were much higher (for at least the suppliers) in that quarter than they were during the quarters before or after. And as can be seen in Figure 3, the accrual rate for truck parts suppliers hit a new high of 2.2% during that same quarter. This was somewhat overshadowed by the even larger spike in their claims rate. But still, what happened?
We think it was caused by Caterpillar, which for some reason made an unusually large accrual of $348 million in the final quarter of 2009 -- more than 4.8% of their product revenue at the time. The only other time they've ever set more money aside as a warranty accrual was in the most recent quarter ($412 million). And because sales growth has been so strong lately, that amount was only 2.7% of the third quarter's product revenue total.
It just goes to show that in a well-consolidated industry with a small number of large players, unusual changes by just one big company can show up as unusual changes for the industry as a whole. We don't always know the cause of these anomalies. However, because we now have nearly nine years of warranty data on hand, we can readily identify both the timing and at least the company causing these anomalies in the averages.
Another Anomaly
In Figure 5, the trend in warranty reserve fund balances suggests another of these anomalies. In the middle of 2008, the reserve balance for the truck manufacturers as a group suddenly jumped by $600 million, from $3.8 billion to $4.4 billion. And this time, it looks like it was caused by an OEM.
Figure 5
Warranty in the Automotive Sector
Reserves Held by U.S.-based Truck Makers
(in US$ millions, 2003-2011)
Fortunately, in this instance we can pinpoint not only the timing of the anomaly and the name of the company that caused it, but probably also the cause. It was Ingersoll-Rand plc, which saw its warranty reserve balance jump from $148 million at the end of March 2008 to $633 million at the end of June 2008. And that was caused by nothing more than its acquisition of Trane Inc. at the beginning of June 2008.
Faster Recovery?
The real news in Figure 5 is the mid-2010 bottoming-out of the industry total, followed by five quarters (and counting) of growth. We've all been told that the recession ended in 2009. But in the truck-making industry, at least, the three major warranty metrics -- claims, accruals, and reserves -- all seem to have bottomed-out later than that, in 2010.
And in 2011, they've each bounced back significantly, which would seem to contradict the generally-accepted narrative about this being a slow recovery. In fact, truck manufacturing activity, like rail freight volumes and tanker rental prices, would seem to be a leading economic indicator. And the indicators are up.
In September 2011, at the end of the third quarter, truck OEMs carried a combined warranty reserve fund balance of $1.7 billion, while their suppliers carried a balance of $2.8 billion. That's a little higher than their historical 60/40 split. But it's also a new record high total for the industry: $4.5 billion.
It's not, however, a new high in relative terms. Yes, truck manufacturers have more reserves than ever before. But they're also bringing in more revenue than ever before and making more accruals than ever before. And claims, while still below their pre-recession peak, are nevertheless on the upswing from a clear bottom.
Therefore, instead of measuring reserves just in dollars, let's also measure them as a multiple of claims. So if a company has a $24 million reserve fund, and it is paying claims at a rate of $1 million a month, one could say their reserve fund has a capacity of 24 months. If their reserves dropped to $20 million but their claims payments dropped to $800,000 a month, their reserve capacity would rise to 25 months. If reserves rose to $30 million but claims rose to $1.5 million a month, the reserve capacity would be 20 months.
As can be seen in Figure 6, the average reserve capacity for this industry has actually been somewhere between 18 and 24 months for most of the past nine years. It's actually been a bit higher at times for the OEMs, and indeed for most of the past six years the dark blue line has been a little higher than the light blue line. But in the third quarter of 2011, they were almost the same.
Figure 6
Truck OEM vs. Supplier Warranties
Reserves Held by U.S.-based Truck Makers
(in $ millions & months, 2003-2011)
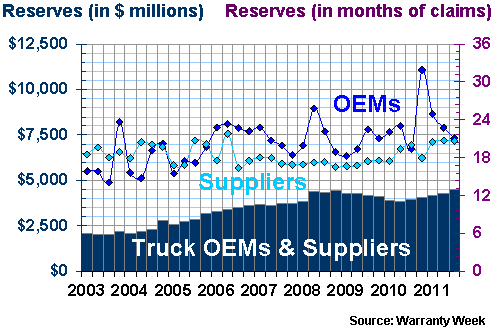
What does this mean? It probably doesn't mean much. The gap was much wider in aerospace (Figure 6 in last week's newsletter), and is traditionally much wider in both the computer industry and the automotive industry as a whole. It's probably closer in this case because two of the largest suppliers and one of the largest OEMs are making truck engines, which generate OEM-like levels of warranty expense all by themselves.
In other words, as far as warranty expense levels go, there's not much difference between making a whole truck and making just a truck engine. Navistar pays around 3% of revenue in claims, and so does Cummins, Paccar and Caterpillar.
Crossing Over
In addition, a few companies are suppliers in one segment and OEMs in others. For instance, Navistar International makes trucks, buses, recreational vehicles, and construction equipment. But it also sells engines for both its own and other OEMs' vehicles. And major suppliers such as BorgWarner Inc., Dana Holding Corp., and Wabco Holdings Inc. are not making parts for just heavy trucks. They're also supplying the passenger car and light truck manufacturers.
Several of the others are major players in multiple warranty-intensive industries. For instance, Eaton and Textron are in aerospace. Ingersoll-Rand and Wabash National Corp. are in HVAC. Cummins, Caterpillar and Navistar make diesel generators used for backup electrical power applications.
In other words, the borders around just the truck-making industry aren't as defined as they are elsewhere. There are multiple crossover points to other industries, and other segments of the wider automotive industry.
Still, some trends hold true. First, like in aerospace and unlike in computers, the suppliers dominate the warranty metrics this industry segment. And second, unlike with passenger cars or personal computers, in truck-making there are multiple brands and multiple warranties facing the customer. So there's more of a balance between the warranty expense levels of the OEMs and their suppliers.


