


Power Generation Equipment Warranties:
Harnessing multiple energy sources from coal to solar, the makers of electrical power generating equipment are a diverse bunch. While much of what they make also fits into other product categories such as automotive, appliances or semiconductors, this week we've brought them all together.
Power generating equipment used to mean generators and turbines. Now, it also encompasses all sorts of solar and battery power systems, as well as wind-powered turbines and several other types of non-traditional power sources.
The companies making power generating equipment and backing them with product warranties are an equally diverse bunch. Some do nothing but power generation. But others make everything from bulldozers to lawn mowers.
This week, we tabulated the warranty expense data of 21 companies whose product fit primarily into the power generation business, and 72 others whose products fit partially into the power generation business.
Top Manufacturers
The top warranty providers whose products are primarily in the business include General Electric Co.; Power-One Inc.; Dresser-Rand Group Inc.; Capstone Turbine Corp.; and Active Power Inc. They make everything from wind-powered turbines to natural gas-powered generators, not to mention rechargeable batteries, solar panels, flywheels, and fuel cells.
And then there are the many companies whose product lines are partially in the power generation business, such as the generators made by Caterpillar Inc., Cummins Inc., Itron Inc. and Briggs & Stratton Corp. And there are several semiconductor manufacturers that also make solar panels. Several automotive suppliers are working on the batteries for electric cars and hybrids. And then there are several companies that make electric motors, such as Regal-Beloit Corp.; Ametek Inc.; and Franklin Electric Co. Inc.
The bottom line is that power generating equipment is made by at least 93 different U.S.-based companies, and we've combined the warranty data of all of them to generate the charts in Figures 1 through 4. And then in Figures 5 through 9 we've spotlighted some of the representative companies in the business.
Because we've included some fairly giant warranty providers such as GE, Caterpillar and Cummins, some of the figures may appear especially large. Of course, that means there will be a lot of overlap with industry figures detailed in previous newsletters, as warranty expenses in the automotive, semiconductor, appliance and other industries are double-counted. We just felt that in this case it was better to include everybody that's in the business rather than just those who are in this business only.
Claims Payment History
In Figure 1, the 10-year claims payment history of the 93 companies is detailed. And it looks as if the decade can be split neatly in half: claims rose for five years from 2003 to 2008, and then remained fairly flat from 2008 to 2012.
Figure 1
Power Generation Equipment
Claims Paid by U.S.-based Companies
(in US$ millions, 2003-2012)
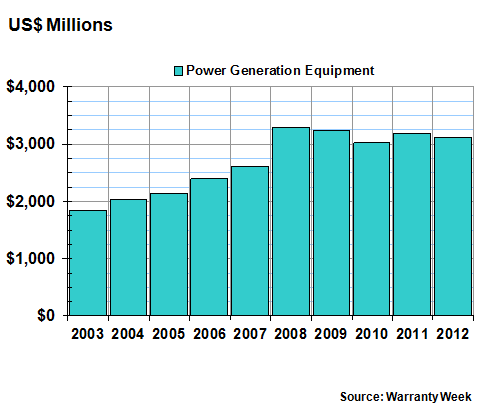
The peak came in 2008, when power generating equipment manufacturers paid out $3.3 billion in claims. The annual claims total remained above $3 billion throughout the economic slowdown (what recession?) and last year came in around $3.1 billion, down -2.5% from 2011 levels.
Choppy Record for Accruals
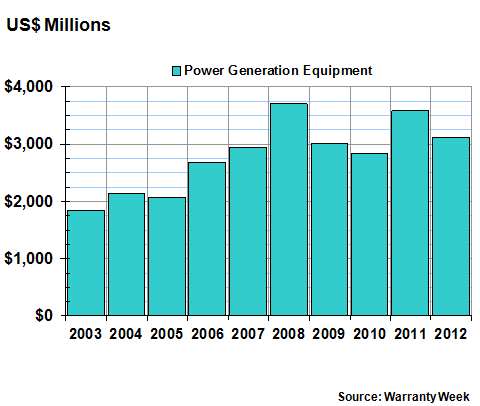
Warranty accruals have seen a bit more choppiness over the past 10 years. Except for 2004-2005, there has also been a general upward trend with accruals during the first half of the decade. But then 2009 and 2010 both saw decreases, while 2011 was up and 2012 was down again.
Once again, the peak year was 2008, when manufacturers set aside $3.7 billion in warranty accruals. But that was about $410 million more than claims payments that year, an excess of accruals that would be more or less repeated in 2011. In 2009 and 2010, accruals exceeded claims by about $200 million each year. And then in 2012, claims and accruals were virtually identical at $3.1 billion.
Figure 2
Power Generation Equipment
Accruals Made by U.S.-based Companies
(in US$ millions, 2003-2012)
Those who want to skip ahead can take a quick look at Figure 4 to see what happens when one warranty metric exceed the other. In both 2008 and 2011, the green accrual rate is above the red claims rate. In 2009 and 2010, the opposite is true. And then in 2012, the two lines are virtually on top of each other.
The thing about warranty accruals is that they're generally much more responsive to changes in sales volume. The warranty claims total depends upon when a product needs repairs. But the warranty accrual total should always remain proportional to sales, unless there's been a change in product reliability or the cost of repairs.
And indeed, there seems to have been a change for the better in terms of reliability. Warranty accruals were down by -13% in 2011-2012. But product sales were up by +6%. That would imply a big change for the better in the accrual rate, since it is calculated by dividing accruals by sales. And again, a quick peek ahead to Figure 4 shows the accrual rate hitting a new low at the start of 2012, plunging by more than 0.4% in a single quarter.
Longer Warranties Mean Larger Reserves
Before we get to that, however, let's take a quick look at the combined warranty reserve fund balances of the 93 power generating equipment makers. In Figure 3, two things stand out: First, during the past decade, the trend has been solidly upwards, with only three annual declines and six annual increases in the balances. Second, the balance is always greater than either claims paid or accruals made, suggesting the duration of these product warranties is almost always longer than a single year.
Figure 3
Power Generation Equipment
Reserves Held by U.S.-based Companies
(in US$ millions, 2003-2012)
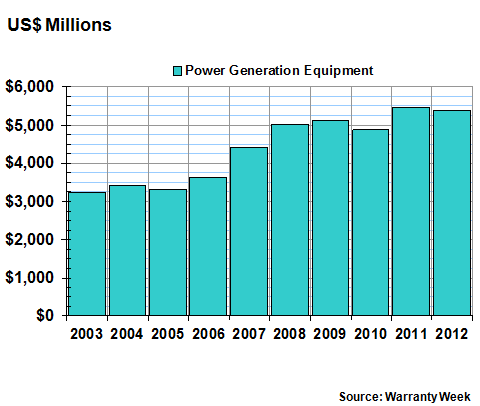
In a future article, we'll spotlight just the solar power industry, where 25-year-long warranties have become the norm. If companies follow the accrual method correctly, that means funds will sit in the warranty reserve for up to 25 years from the time of product sale, so of course the balance would exceed any one year's claims or accrual total. SunPower Corp., for instance, is keeping a reserve fund balance that's more than 18 times as large as its annual claims total.
But even in the more traditional sectors of the power generation industry, manufacturers tend to remain conservative with warranty reserve balances. Foster Wheeler, which manufactures entire power plants, keeps 14 years' worth of reserves on hand. Cummins is a little over two years, while GE is a little under. However, we'd suggest that this has much to do with the shorter warranties to be found elsewhere in their product line, outside of generators and turbines.
Warranty Expense Rates
In Figure 4, we've taken the totals listed in Figures 1 and 2 and divided them by the corresponding product sales totals. As was mentioned, the new lows seen in 2012 are spectacular. It's only the second time in the past 10 years that the industry's claims rate has dipped below one percent. And warranty expense rates have never been lower than they were during the first quarter of 2012.
Figure 4
Power Generation Equipment
Average Warranty Claims & Accrual Rates
(as a % of product sales, 2003-2012)
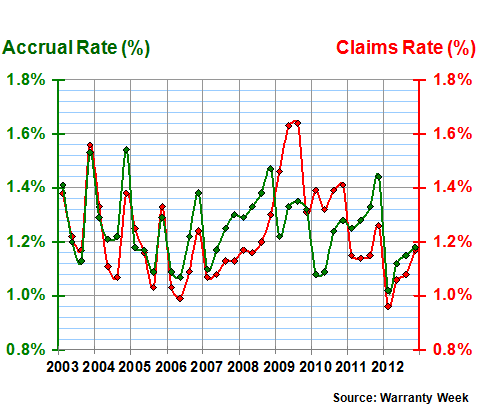
The problem is that the trend seems to be this: expense rates fall for three or four years, then rise for three or four years, then fall again for three or four years. We're now in the fourth year of the latest downswing in rates. So does that mean expense rates are due to begin increasing again next year? Or will this decline stick?
GE Leads the Market
Now, let's look at some of the individual companies in the power generation equipment market. General Electric makes everything from medical equipment to jet engines. As we've noted numerous times, it details its warranty expenses only once a year, which we then convert to a quarterly format. But whenever the company gave any details about its warranty expenses, it usually attributed them primarily to GE Power Systems.
GE has kept its claims and accrual rates fairly close to one percent over much of the past decade. However, back in 2003 and 2004 its warranty expense rates were much higher. The reason? It has nothing to do with claims or accruals. Instead, it's the result of the way GE segments its revenues.
Back then, we were getting a clean data point for just GE Power Systems' product revenue. But beginning in 2005, that unit was folded into GE Energy, and its revenue was bundled into the much larger GE Infrastructure. Now, instead of looking just at turbine and power generation equipment revenue, we have to compare GE's warranty expenses to a much wider slice of its product line. As a result, the company's claims and accrual rates fell from 4% or 5% of a small pie to around 1% of a much larger pie.
Figure 5
General Electric Co.
Average Warranty Claims & Accrual Rates
(as a % of product sales, 2003-2012)
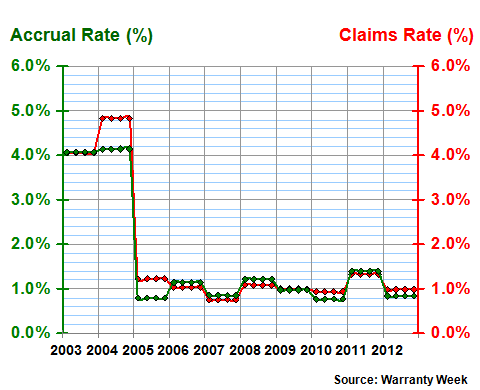
In 2012, GE was the seventh-largest warranty provider in the U.S., just behind Caterpillar and just ahead of Cisco Systems Inc. It also has the seventh-largest warranty reserve fund in the U.S., with a year-ending balance just shy of $1.4 billion. The good news is that GE's warranty expense rates continue to remain fairly stable. Only one percent of GE Infrastructure's revenue was spent on warranty claims in 2012, and only 0.8% of its revenue was set aside as warranty accruals. Those figures are right about in the middle of the range of expense rates seen for GE since 2005.
Another Turbine Company
Dresser-Rand, a much smaller competitor that is also engaged in the construction of diesel, natural gas, and alternative fuel power plants, also currently sees its warranty expense rates around one percent. However, its expense rates have varied from 0.8% to 2.4% over the past decade, and that's not merely because of the changing labels assigned to its business units.
The good news is that expense rates have remained low for seven consecutive quarters, with none of the sudden spikes seen in years past. Dresser-Rand seems to have found stability for its warranty expense rates around one percent of revenue. It came close to hitting that level three times before, but rates always went back up. This time, the low rates may continue for more than two years.
Figure 6
Dresser-Rand Group Inc.
Average Warranty Claims & Accrual Rates
(as a % of product sales, 2004-2012)
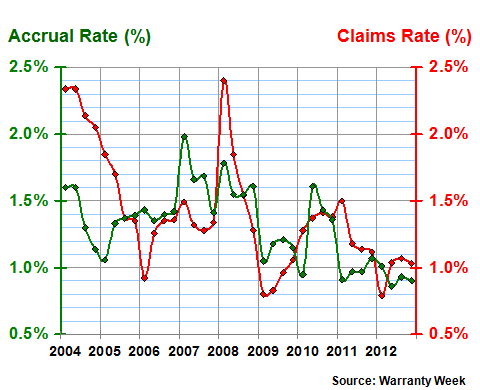
Like GE, Dresser-Rand makes much more than turbines. Its products are heavily used in the oil and gas industry, by chemical producers, for air conditioning and ventilation, and in various "green" energy initiatives. But its core product line is comprised of products that help its clients generate electricity.
Solar Power Warranties
Our next two companies are more squarely focused on solar power generation products. First Solar, an Arizona-based manufacturer of photovoltaic modules, has in recent years focused on the utility companies as customers, as opposed to individual residences or office buildings. For instance, it has two solar farms under construction in California, each capable of producing 550 Megawatts of power (enough to power 160,000 homes).
In Figure 7, we see an initial year where First Solar set aside an incredibly large portion of its product revenue to fund future warranty expenses. The company accrued $1.9 million in a year that saw sales of $13.5 million. And that in turn tabulates into a 14.1% accrual rate for the year, among the highest ever seen.
However, if you think of it as merely an initial down payment, or perhaps as seed money, it begins to make sense. It demonstrates the company's commitment to its warranties, and its intent to pay claims, even far off into the future. First Solar's claims rate has generally remained low ever since, except for the second half of 2012.
Figure 7
First Solar Inc.
Average Warranty Claims & Accrual Rates
(as a % of product sales, 2004-2012)
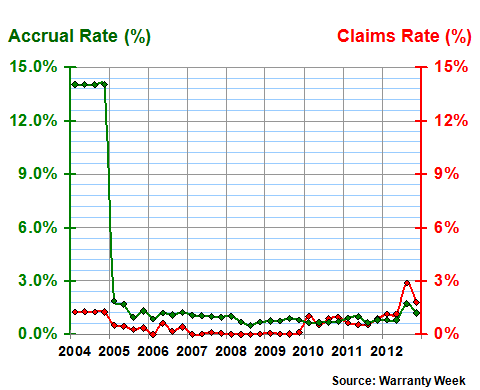
With extremely long warranties, the accruals are always going to exceed the claims, especially when the products are new and young. Over time, the solar panels will generate claims expenses, but if the accruals were done properly way back at the time of sale, the funds will be there to pay the claims.
Typically, sales volumes are going to ramp up quite quickly, so that a smaller and smaller portion of the installed base will be what one would call old. Meanwhile, the rising sales volumes call for rising accrual amounts, so the warranty reserve becomes flush with money that's not needed for years.
First Solar, for instance, allowed its warranty reserve fund balance to exceed $10 million in 2008. In 2010 its reserves passed $25 million. They doubled again in 2011. At the end of 2012, First Solar had a warranty reserve balance of $182 million. That's more than three times as much as it paid in claims last year. That demonstrates credibility to the customer, and gives them peace of mind.
Finding the Right Level
SunPower Corp. is just as credible as First Solar, as can be seen in Figure 8. Thought the company's accrual rate has varied from 0.5% to 4.6% within a single year, its constant accruals demonstrate its intent to pay claims far off into the future.
Like First Solar, it didn't begin to accrue for warranty expenses until 2004. Unlike First Solar, its initial few accruals were always well under the five percent danger line. But also like First Solar, the company's accrual rate seems to have settled down once some actual claims emergence data was available.
Figure 8
SunPower Corp.
Average Warranty Claims & Accrual Rates
(as a % of product sales, 2004-2012)
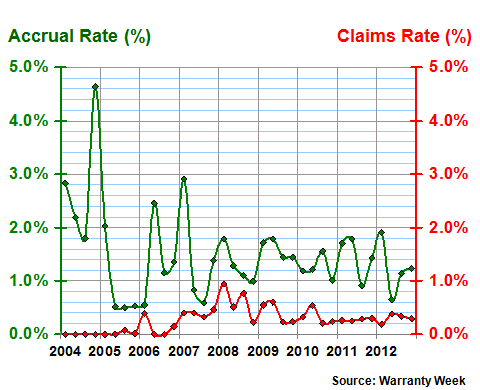
Notice that the claims rate in Figure 8 was at or near zero for much of the first few years. That's what makes it so difficult to choose a correct accrual rate for solar power products. In the early years, there's so few installations, and they're still so new and shiny. Who can say in 2004 or 2005 what shape those installations will be in decades from now?
But by 2008 or 2009, they have four or five years of data to work with, and probably some accelerated lifecycle testing to supplement the actual data. They can begin to make accurate predictions of whether they should accrue 1% or 2% of revenue for warranty expenses. Five years later, they'll know if 1.2% or 1.5% is correct. And so on, until finally some of their oldest installations go out of warranty.
Neutralizing the Naysayers
Last but not least, we're including a snapshot of the warranty expense rates of electric car manufacturer Tesla Motors, which was previously part of the data delivered in the Automotive Warranty Report on April 4. In that newsletter, however, Tesla was merely number 23 on a list of 50 automotive OEMs. This week, it's the only electric vehicle maker on our list (Caterpillar and Briggs & Stratton have decidedly oil-powered product lines, and are part of this week's list for their generators, not their vehicles).
Also, during the intervening eight weeks, two remarkable things happened. First, Tesla reported its first-ever profit for the first quarter of 2012: 12 cents per share after selling more than 5,000 Model S sedans at prices north of $70,000 per unit. Second, Tesla's common shares of stock began to soar. They stood at $42 on April 4. Then they passed $50 on April 22. By May 13 shares were over $87, and Tesla was worth more than Fiat S.p.A. And on Tuesday of this week they hit $110.
Think about that for a second. Tesla is worth more than Fiat and Chrysler put together. And Tesla became the second U.S. automotive OEM to repay its government loans. The Model S is becoming the new Prius. And it's time to take Tesla seriously as a viable automaker for the long term.
Therefore, though it's perhaps eight weeks late, below is a snapshot of Tesla's warranty expense rates for the years 2008 to 2012. Like the solar panel makers, the company starts with a high accrual rate and a low claims rate, as it guesses its way through warranty accounting routines. Then, with more claims emergence data on hand, accrual rates are adjusted accordingly.
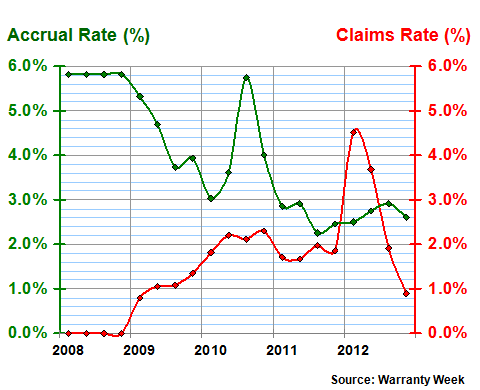
Back in 2008, the company's planners thought 6% was a good accrual rate. By 2011, they'd settled on a range of 2.2% to 3.0%. Notice also that in early 2012, despite Tesla's claims rate soaring to 4.5%, it stuck with its accrual projections.
That in itself is a sure sign of growing maturity. Most neophyte warranty financial planners would have hit the panic button and doubled accruals. Instead, Tesla held its course, and now for the full year its claims rate is down below one percent.
Figure 9
Tesla Motors Inc.
Average Warranty Claims & Accrual Rates
(as a % of product sales, 2008-2012)
Time will tell whether the stock can remain above $100 a share. Some say the rapid rise was what's called a "short squeeze," when the naysayers are caught betting on a share price decline when the good news breaks. That can turn an uptrend into a doubling or tripling, especially when there are relatively few shares for sale.
But one thing is clear. After the Nissan Leaf and the Chevrolet Volt, there is now a third viable all-electric vehicle nameplate in the market. And as with other all-electric and hybrid units, warranty is going to be a major issue, though we hope it turns out to be a minor expense.
Tenth Annual Product Warranty Reports
As we begin to wrap up our annual survey of U.S.-based warranty providers, here are some links to the online editions of all the previous parts of this series:
- Top 100 Warranty Providers of 2012
- Tenth Annual Warranty Report, Totals & Averages
- Computer Warranty Report
- Automotive Warranty Report
- Supplier Recovery
- New Home Warranties
- Telecom Equipment Warranties
- Semiconductor Warranty Report
- Aerospace Warranty Report
- Appliance & HVAC Warranties
- Medical & Scientific Equipment Warranties
- Power Generation Equipment Warranties
- Security Equipment Warranties
- Food Service Equipment Warranties
- Farm & Lawn Equipment Warranties
- Mining Equipment Warranties


