

Warranty Accruals per Vehicle:
The German OEMs still have the highest warranty costs worldwide, but the Japanese carmakers are no longer unopposed at the bottom. Both Fiat and Ford are cutting their warranty costs to within range of longtime low-cost leader Honda. And Toyota is well on its way to getting back to normal.
Most of the top passenger car manufacturers continue to reduce their warranty expenses, as calculated by the size of the expense per vehicle and as a percentage of their automotive revenue.
The good news spreads across Europe, Asia, and North America, as we reckon that six of the top eight automotive OEMs saw decreasing warranty expenses in their most recently completed fiscal years.
The bad news is that for some brands, particularly those from Germany, warranty costs remain stubbornly high. And while costs are down from years past, the warranty accrual on a Volkswagen Golf or a Mercedes-Benz C 200 is still four to five times as large as it is on a Honda Accord.
Traditionally, we run this article during the week of the Fourth of July, when all our American readers have retreated to the beaches and lakes for their Independence Day holiday, and all our European and Asian readers are wondering why it's so quiet. But last week, the Fourth of July was on a Thursday, so even the Warranty Week offices were closed.
We have to wait until early July because the two top Japanese automotive OEMs -- Toyota Motor Corp. and Honda Motor Co. Ltd. -- don't file their annual reports until late June. That's because both are on fiscal years that end on March 31, so they're three months behind their European and American cousins. Nissan Motor Company Ltd., we should note, has never publicly revealed its warranty expense data.
We track warranty accruals because those funds are set aside at the time of sale, to finance expected claims later on. Claims, on the other hand, come later, after the car has been driven a while. The amount of accruals per vehicle is essentially a company's best guess of the total cost of its warranty, over the life of its warranty. So when that amount changes, the company is signaling that the cost of warranty has also changed, because quality has changed, repair costs have changed, or some other factor has changed.
The Missing OEMs
In Europe, we track Daimler AG, Fiat S.p.A., the Volkswagen Group, and BMW AG. Chrysler was included in the Daimler data until 2007, was completely absent from the charts from 2008 to 2010, and is part of the Fiat data for 2011 and 2012.
None of the French auto manufacturers report their warranty expenses publicly, so they have never been part of the charts. Neither has Hyundai Motor Co., Mitsubishi Motors Corp., Subaru, Isuzu Motors Ltd., or Aston Martin Lagonda Ltd. Also, Tata Motors Ltd., the owners of Jaguar Land Rover, are on an even more delayed annual report publishing schedule than either Honda or Toyota, so the latest data we have for them is from more than a year ago.
In the U.S., General Motors Corp. became General Motors Company in 2009, so its data is technically from two different companies. And then of course the Ford Motor Company has remained part of these warranty expense charts since their inception -- lucky, in a way, that its financial crisis hit years before the Lehman panic. Ford's warranty costs began declining in 2006, and kept declining throughout the recession.
And then, as a special bonus, we're including a third American OEM in the charts. No, it's not Chrysler Group, which is now part of Fiat. It's electric car manufacturer Tesla Motors Inc. In 2008, Tesla began reporting its warranty expenses in its financial statements, though its production volumes have been orders of magnitude smaller than either GM's or Ford's.
So these are the eight leading OEMs (or ten counting Chrysler and Tesla) that currently report their warranty expenses publicly. Most have done so since 2002 or 2003. In the charts below, what we have done is taken the amounts they reported as warranty accruals, and divided them by two other financial metrics. In Figures 1, 3 and 5, we have divided accruals by auto revenue, to find the percentage of sales set aside to pay for warranty expenses. In Figures 2, 4, 6 and 7, we have divided accruals by the number of vehicles sold, to calculate the size of the warranty expense per vehicle.
In Figure 1, we charted the accrual rates of the four European automotive OEMs since 2002. Volkswagen didn't begin reporting its accruals until 2003, so they're one year shorter than the others. In 2012, its accrual rate was 4.5%, calculated by dividing its 7.8 billion euro accrual by its 173 billion euro total for automotive product revenue.
Declining Warranty Costs
Notice than in 2012, the accrual rates for all four OEMs were down slightly. This is very good news, because the accrual rate should change only if there's been a change in the predicted cost or frequency of warranty repairs. So what all four OEMs are essentially saying is that they expect to pay a smaller share of their 2012 revenue on warranty work than they did in 2011. Or in even simpler, advertisement-ready words, their cars are getting better!
Figure 1
Four European Auto OEMs
Warranty Accrual Rates, 2002-2012
(as a % of product sales)
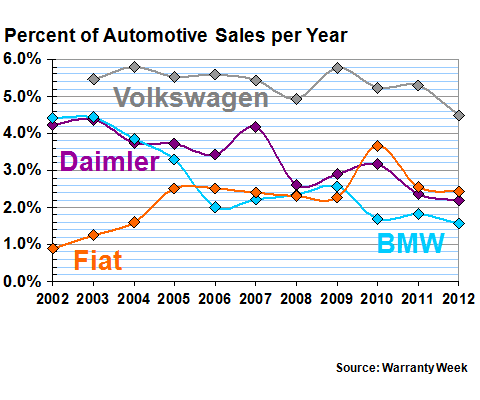
Now, let's compare the amount each of the European OEMs accrued for warranty expenses to the number of vehicles they sold. Daimler, for instance, sold 2.2 million vehicles and accrued 2.2 billion euros in 2012, so its accrual rate per vehicle was a little over 1,000 euros. Its vehicles cost more to buy than VW's, so the accrual rate per euro is lower. But per vehicle, the accrual rate is higher.
This gets a bit confusing, so let's use some real numbers. Worldwide, the average cost of a Volkswagen model sold in 2012 was 18,500 euro, including all those millions of low-cost vehicles sold in China. The average accrual per vehicle was 833 euro. For Mercedes, the average unit cost was 48,844 euro, and the average accrual per vehicle was 1,077 euro.
Therefore, Mercedes set aside more money per unit sold. But the money it set aside to cover warranty costs was only 2.2% of the vehicle's price. For VW, the accrual rate was 4.5%, even though the actual amount per vehicle was lower. So in Figure 1, VW has the highest warranty cost as a percentage of revenue. But in Figure 2, Daimler has the highest warranty cost per vehicle.
Figure 2
Four European Auto OEMs
Warranty Accruals per Vehicle, 2002-2012
(in euro per vehicle per year)
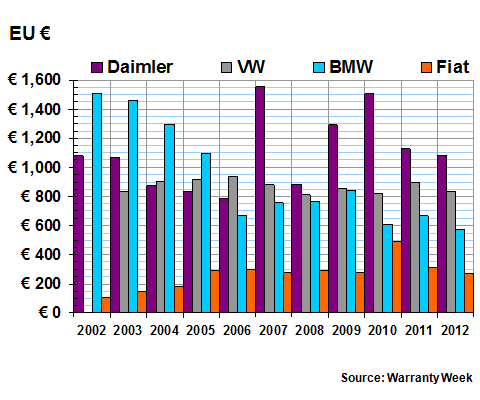
Daimler has actually set aside the most accruals per vehicle for the past six years running. Volkswagen topped the list in 2006, and BMW was at the top from 2002 until 2005. But BMW has done a remarkable job of reducing its warranty costs over the past decade, as can be seen by the nearly constant downward slope of its data in both Figures 1 and 2.
Notice that Daimler also recorded the highest accrual per vehicle ever, in 2007. That was coincidentally the year it sold most of its stake in Chrysler. At the time, the Daimler people said the high cost came from the Chrysler product line, while the Chrysler people said it came from the Daimler truck product line. Whatever the real reason was, that year the company set aside 1,554 euro per vehicle -- the most by any manufacturer in any year.
Measured against that, 2012 was a really good year. Daimler's accruals were down to 1,077 euro per vehicle, and even Fiat was getting back down to its pre-Chrysler levels. BMW cut its accrual rate by 92 euro per vehicle, and VW cut its accrual rate by 66 euro per vehicle.
VW's Warranty Cost-Cutting
As for recent press reports that VW's warranty costs are down 28% since a year ago and 40% since 2010, we can't find any numerical corroboration of that claim. Accruals per vehicle were down 7.4% from 2011 to 2012, and the accrual rate as a percentage of sales was down by 15% over the same period. But the total for claims paid rose faster than unit sales, although revenue rose faster than both these metrics.
If the reports referred to just Volkswagen America, then it would not be possible for an external observer to verify. The Volkswagen Group provides just one set of warranty figures for all its nameplates across all its markets worldwide. The statistics in Figures 1 and 2 are based on this worldwide data.
We're keeping the comparisons in each manufacturer's native currency, for now, so that we are sure that we're making apples-to-apples comparisons. As we shall see in Figure 7, exchange rates can either magnify or mask the differences between all eight companies, depending on which way the currencies are moving that particular year.
In Figures 3 and 4, the currency is the Japanese yen, which has been as high as 82 yen to the dollar and as low as 133 yen to the dollar over the past decade. So if we were to convert to dollars, the shape of the curves would be significantly different.
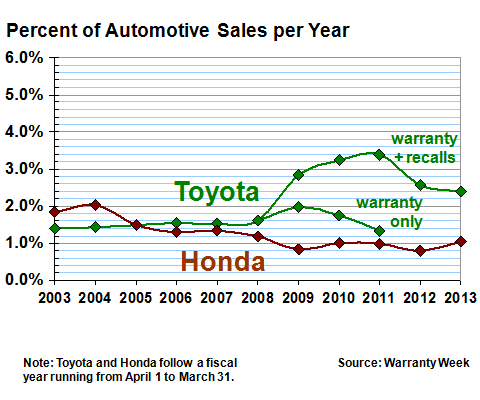
In Figure 3, we can see that Toyota's accrual rate was down in the fiscal year ended March 31, 2013, while Honda's rate was up. It's the second year in a row of reduced warranty expense for Toyota, while it's the first increase for Honda since 2009-2010.
For Toyota, we've also included two different measurements. For the fiscal years 2009, 2010 and 2011, Toyota released expense figures for both warranty and recalls together, and warranty only. From fiscal 2003 until 2008, the figures were for warranty only. In fiscal 2012 and 2013, the figures were for warranty and recalls together.
Figure 3
Two Japanese Auto OEMs
Warranty Accrual Rates, 2003-2013
(as a % of product sales)
In Figure 4, we charted just the Toyota warranty and recall figures for the fiscal years 2009 to 2013. Readers who wish to see both sets of figures for 2009-2011 should contact the editor.
The big news in Figure 4, however, is that Honda set aside the most accruals per vehicle since fiscal 2008, while Toyota set aside the least since fiscal 2008. The difference between them is still huge, but it's closing. And while Honda remains the worldwide warranty cost leader (a position it has held since fiscal 2005), the gap between the leader and the number two is now the thinnest it's been in six years (when Toyota was number two).
Figure 4
Two Japanese Auto OEMs
Warranty Accruals per Vehicle, 2003-2013
(in yen per vehicle per year)
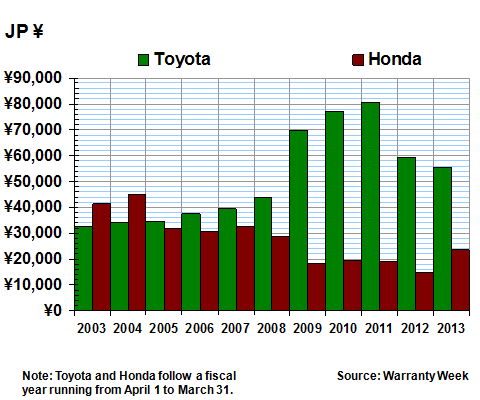
In U.S. dollars, Toyota set aside $589 per vehicle in fiscal 2013, while Honda set aside $250. Readers often ask how we choose our conversion rates for yen-to-dollars or euro-to-dollars. The truth is, we don't. We depend on the manufacturers themselves to make the conversions in their annual reports, and then we adapt their conversion rates to the warranty expense figures.
At the outset of this newsletter, we said that six of the top eight automotive OEMs saw decreasing warranty expenses in their most recently completed fiscal years. So if Honda is the seventh, who is the eighth?
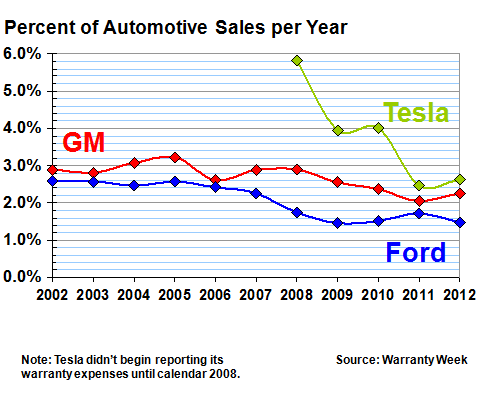
In Figure 5, we can see that while Ford reduced its warranty expense rate in 2012, GM's actually rose slightly. So did Tesla's, but it will take a few million more unit shipments before we're ready to call them one of the world's largest OEMs. But that's the other piece of news here: both Honda and GM saw their warranty expense rates rise in their most recent fiscal years.
Figure 5
Three American Auto OEMs
Warranty Accrual Rates, 2002-2012
(as a % of product sales)
It wasn't a tremendous increase. In fact, if we look at the warranty expense per unit sold, the increase was only $26 per vehicle, from $339 in 2011 to $365 in 2012. Furthermore, GM's average price per vehicle was down by $311 -- almost back down to 2009-2010 levels, when the accrual per vehicle was slightly higher than last year.
But the most amazing piece of news is that this is the fourth year in a row in which both GM's and Ford's average warranty accrual expense per vehicle has remained under $400. In Figure 6, the difference is obvious: it's about $500 per vehicle or more from 2002 to 2007, then the recession hits, then it's under $400 from 2009-2012.
Figure 6
Two American Auto OEMs
Warranty Accruals per Vehicle, 2002-2012
(in US dollars per vehicle per year)
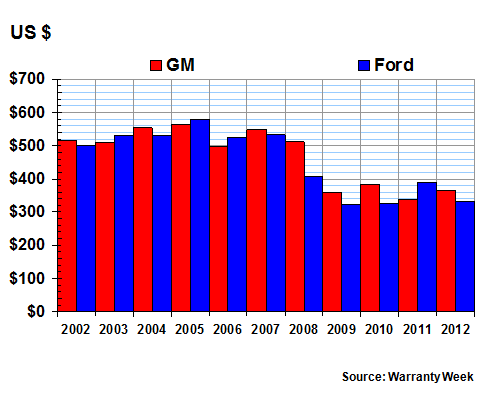
We're not saying the recession is responsible for the reduced accrual rate per vehicle. Or are we? Actually, the recession may be the main reason why the OEMs pushed so hard to reduce all their expenses, warranty included. But the systems the OEMs put in place to monitor warranty expenses, to make earlier detections of quality problems, and to reduce the scope of recalls, are the reason the expense rates have remained low ever since.
During the recession, the OEMs made fewer cars, but they also made better cars. Every year, they set aside les per vehicle, and a smaller percentage of revenue, to cover warranty expenses. Honda and GM slipped back a little in 20123, but for the others this is a continuing trend.
Now, here is the biggest surprise of all. We took the accrual rates per vehicle for all eight OEMs, and for the four European and two Japanese OEMs we converted those figures into U.S. dollars. Once we did that, we realized that Ford had the second-lowest accrual rate per vehicle, and that GM and Fiat were almost in a tie for third.
Figure 7
Eight Top Worldwide Auto OEMs
Warranty Accruals per Vehicle, 2002-2012
(in US dollars per vehicle per year)
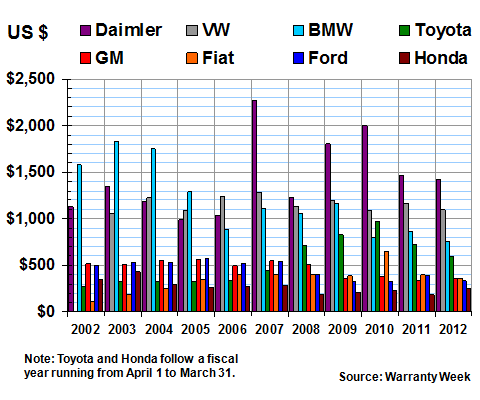
In Figure 7, as we mentioned, we used the same currency conversion rates as the manufacturers, so we defer to them for their methodologies. Do you take an average, measure it at the end of the year, or in the middle? It's up to them. We used their numbers.
If we converted all eight figures into yen, or all eight into euro, some OEMs might swap places, while the gaps between others might widen or close. But the basic trends would remain.
For instance, Daimler's painful year of 2007 would now equate to an accrual of US$2,269 per vehicle. Toyota's most painful year would remain 2010, when it accrued 80,490 yen per vehicle sold. But the dollar was low in 2007 and the yen was low in 2010, so these figures sound worse in one currency than they do in another.
Global Presence
And in this modern world, most automotive OEMs sell globally. For instance, VW is one of the largest passenger car makers in China. Ford and GM have a significant presence in Europe. Toyota, Honda, and Volkswagen manufacture vehicles in the U.S., so they're not just importers. Mercedes-Benz, BMW, Rolls-Royce, Maserati, Ferrari, Acura, Lexus, and Bentley are luxury nameplates know all around the world, and they're all owned by one of these leading OEMs.
So the biggest nuggets of news here are that 1) all of the European OEMs plus Ford and Toyota managed to successfully reduce their warranty expense rates in their most recent fiscal years, 2) Honda is back over $250 per vehicle for the first time in five years, though it still has the lowest vehicle warranty expense rate in the world, 3) Ford has the second-lowest vehicle warranty expense rate in the world, 4) Fiat once again has its warranty expenses under control, and 5) Toyota is now fifth out of eight, after holding second place from fiscal 2002 to 2006, but continues to recover from the massive recalls of 2009 and 2010.


