

Semiconductor Industry Warranty Report:
In no other industry is the factory machinery so costly, and so expensive to maintain. And nowhere else does the output of the factory have such low warranty expense rates, compared to the machinery used to make it. It's as if the factory owners have shifted much of their warranty costs onto their equipment suppliers.
In the semiconductor industry, there's been a peculiar shift of warranty expenses from the manufacturers themselves to the makers of the capital equipment that they use in their factories. The makers of the sophisticated and expensive semiconductor fabrication equipment seem to have much high warranty expense rates than their customers who do the actual manufacturing.
It's a different dynamic than what is found in the automotive industry, where the companies putting their names on the vehicles and selling them to end users suffer much higher expense rates than the companies making parts and components such as engines, brakes and seats. Here, in contrast, it's the factory machinery that needs all the warranty work, so the output of the factory doesn't need much. Keeping the machinery in perfect working order is expensive. But as long as it's kept in top shape, the output it produces is nearly flawless.
We began our comparison with a list of 169 U.S.-based companies with a significant stake in the semiconductor manufacturing industry. Of them, 24 were making the machinery that was used to manufacture semiconductors and printed circuit boards, and 145 were making the actual chips and devices themselves. So we split the entire group into two groups.
Then, for each of those 169 companies, we collected three essential warranty metrics and one sales metric from each of their financial reports. The warranty metrics we collected were claims paid, accruals made, and reserves held, while the sales metric was product revenue. The data has been collected every quarter since the beginning of 2003, though in this week's newsletter we're presenting the data in an annual format covering the past 11 years.
Higher Warranty Expenses
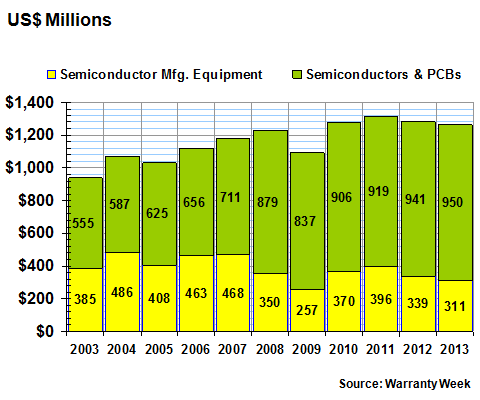
The manufacturers of the production equipment seem to have much higher warranty expense rates than do their customers. Despite being outnumbered by more than six-to-one, it's clear from Figure 1 that there's a more even split between the two groups in terms of the amount of claims they pay each year. In fact, except for the recessionary years of 2009 and 2010, the ratio between the claims paid by each group has remained very close to 50/50.
Figure 1
Semiconductor Manufacturing Industry
Claims Paid by U.S.-based Companies
(in US$ millions, 2003-2013)
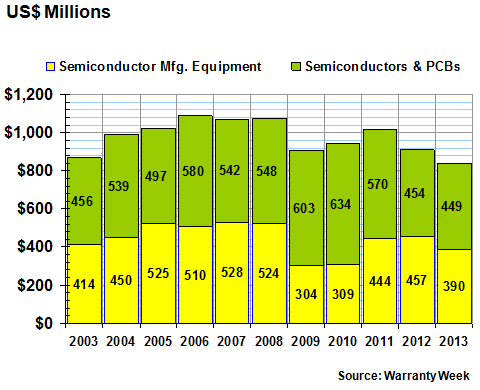
In 2009 and 2010, something very strange happened. The claims payments of the semiconductor manufacturing equipment makers fell significantly, while the claims payments of their customers -- the actual semiconductor manufacturers -- hit a new record high. So the overall total didn't fall by very much.
It would seem as if the equipment makers somehow found a way to shift some of their claims burden onto their customers. But that's not quite what happened. Everybody's sales fell, and almost everybody's claims fell too.
As we'll see in Figure 6, the exception was Nvidia Corp., a manufacturer of graphics processing units for laptop computers. In 2009 and 2010, the company spent a small fortune fixing defective products under warranty, more than making up for declines by other device makers such as Sanmina Corp., Teradyne Inc., and Cypress Semiconductor Corp. Were it not for Nvidia's soaring claims cost, there would be a much deeper notch in the 2009-2010 claims data.
The good news is that Nvidia recovered, and the others kept cutting costs until 2013, which saw the lowest-ever claims total for the device makers, and the third lowest-ever total for the manufacturing equipment makers. And their combined total claims payments of $839 million in 2013 is their lowest since 2003.
Accruals Rise Slightly
The warranty accrual totals of the 169 companies were actually up a bit in 2013, though that was entirely due to the device manufacturers. The makers of the capital equipment set aside $7 million less in 2013 than they did in 2012. However, device manufacturers such as Advanced Energy Industries Inc. and Roper Industries Inc. set aside significantly more in 2013 than they did in previous years. And that drove up the overall total to $481 million.
Figure 2
Semiconductor Manufacturing Industry
Accruals Made by U.S.-based Companies
(in US$ millions, 2003-2013)
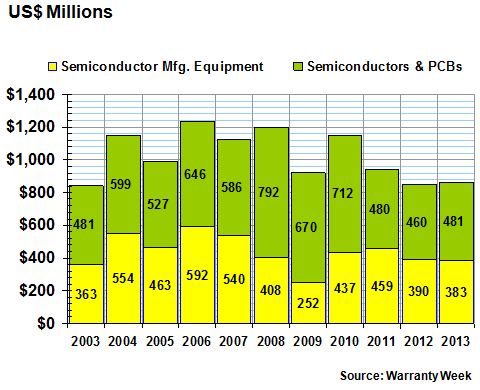
Ironically, despite the increase, 2013 still saw the third smallest accrual total of the past 11 years for the device makers, with 2012 remaining the record low and 2011 coming in at number two (the 2003 total was marginally higher than 2013's). And because the device makers' sales were up a bit (+0.2% in 2013), this means they're reducing expense rates, not selling less product.
In contrast, the makers of the capital equipment saw sales fall almost 10% in 2013. So all things being equal, their accruals should have also fallen by 10%. But they didn't. They fell by only $7 million, from $390 million to $383 million. That's only two percent. And that means their expense rates are rising.
Warranty Expenses Compared to Sales
In Figures 3 and 4, we've taken the data from Figures 1 and 2 and compared it to sales, to calculate expense rates for claims and accruals. As can be seen in Figure 3, the average claims rate of the 24 manufacturing equipment makers is up significantly in 2012 and 2013 from where it was in 2010 and 2011. But it's still at the bottom end of the range it traveled from 2003 to 2009.
Figure 3
Semiconductor Manufacturing Equipment
Average Warranty Claims & Accrual Rates
(as a % of product sales, 2003-2013)
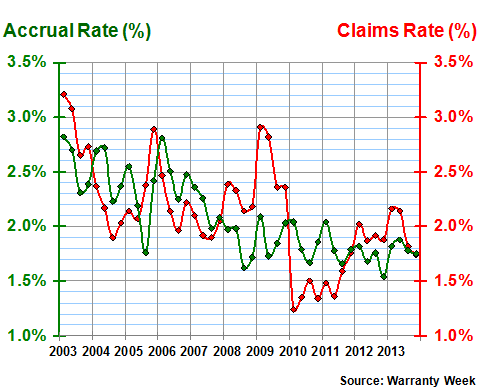
It's hard to say why the claims rate hit bottom in 2010. Claims were down significantly for companies such as Cymer Inc. and KLA-Tencor Corp. But claims were up significantly for the likes of Lam Research Corp. and Coherent Inc. The key seems to have been a massive recovery in sales, which pushed down the claims rate even as claims payments rose.
The End of Cost-Cutting?
Accrual rates are up a bit in 2013 for the capital equipment makers from where they were in 2012. But once again, the average is still below the trend line seen in the past decade. However, the year-ending accrual rate of 1.75% is far from the lowest-ever. So what we think we're seeing is the end of annual expense rate declines.
In Figure 4, it's the same basic trend for the device makers. Note that much of the chaos in the center of the chart, during the period from the middle of 2008 to early 2011, is due to Nvidia. Once that situation stabilized, so did the average expense rates of this industry segment.
Figure 4
Semiconductors & PC Board Manufacturers
Average Warranty Claims & Accrual Rates
(as a % of product sales, 2003-2013)
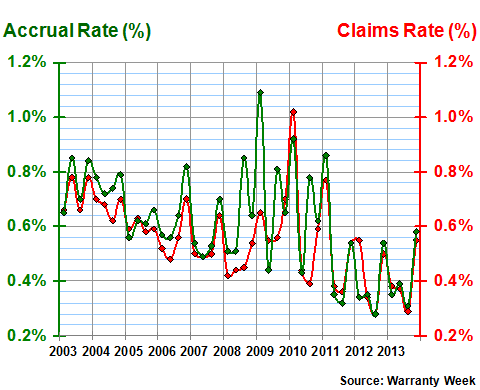
Then again, expense rates were a bit lower for this group in 2012 than they were in 2013. Are manufacturers loosening up a bit on their warranty cost-cutting? Or is the reliability of their products slipping a bit? It could be a bit of both, or perhaps it's something else. But in chart after chart, in multiple industries, we're finding the same trend: 2012 was the best year in terms of warranty expense rates.
Notice, however, the incredible difference between the average expense rates of the companies in Figure 3, and the companies in Figure 4. The capital equipment makers have cut their costs from two-to-three percent of sales revenue to the 1.5%-to-2.0% range. But their customers have rarely paid out more than one percent and for multiple years have remained in a range of 0.3% to 0.6% of sales revenue.
That's an average gap of 1.7% before the recession and 1.3% since. And that's almost as bad as the average gap between the warranty expense rates of the OEMs and their suppliers in the automotive industry. Except, in this case, the makers of the capital equipment are the suppliers, and the device makers are the OEMs, in the sense that it's their names on the devices, not Novellus or Applied Materials.
Rising Warranty Reserves
Our third warranty metric is the balance in the warranty reserve funds of all the companies in the industry at the end of each year. In Figure 5, we can see that while the balance from 2003 to 2007 was close to 60/40, it has since swung even further towards the side of the device makers, ending 2013 at a 75% to 25% ratio.
Figure 5
Semiconductor Manufacturing Industry
Reserves Held by U.S.-based Companies
(in US$ millions, 2003-2013)
Why is this happening? As was noted in Figure 4, the actual device makers don't spend a very high percentage of their revenue on warranty expenses. Yet in Figure 5, they're keeping all this money in their reserve funds.
The reason, we believe, is because we're counting many of the solar energy companies as semiconductor device manufacturers. And when they sell a new system with a 20 or 25-year warranty, they have to set aside a good amount of money that just sits there upspent for decades. And that drives up the overall balance of the industry's warranty reserves, as solar sales continue to rise.
For instance, First Solar Inc. ended 2013 with $189 million in its warranty reserve. At the end of 2004, it had only $2.4 million on reserve. SunPower Corp. ended 2013 with $126 million in its reserve fund. It ended 2004 with just $180,000 set aside.
Then again, outside of the solar energy companies, which tend to be counted as device makers, the companies with the biggest reserve balances tend to be the capital equipment makers, such as Agilent Technologies Inc., Lam Research, Coherent, and KLA-Tencor. And they and the 20 other companies in the capital equipment category accounted for only a quarter of the $1.262 billion in reserves counted for all 169 companies last year. The solar companies accounted for about 36%.
Warranty "Market Share"
Finally, we've mentioned several times the warranty calamity that befell Nvidia from late 2008 to early 2011. Rather than write another thousand words about it, we thought we'd include one last chart that shows it as a picture.
Figure 6 tabulates the "market share" of the top dozen or so semiconductor industry warranty providers. Note that companies such as Intel Corp. and Texas Instruments Inc., which report no warranty expenses at all, are not part of this chart. But imagine that each year, all the claims paid by all 169 companies that did report their warranty expenses represented 100% of the market share.
In most years, no one company reached a 20% market share of claims payments. Applied Materials came closest, paying 15% to 19% of the industry's total bill in most years. But then along came Nvidia, represented by the red section in Figure 6. In 2009 their market share hit 21% and in 2010 it rose to 22%.
Figure 6
Semiconductor Manufacturing Industry
Claims Paid per Year
(as a % share of the total in Figure 1)
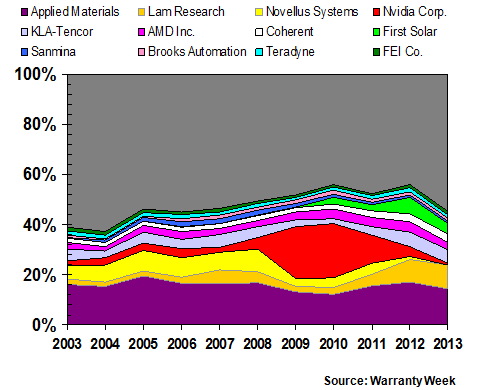
Now, everything is back to normal, and Nvidia accounts for less than one percent of total claims paid. But for several years, the defective graphics boards and the cost of replacing them were a very big deal for Dell, HP, Apple, and their laptop-owning customers.
A Half-Billion-Dollar Defect
Nvidia spent about $555 million on warranty expenses from 2008 to 2011 -- more than three times as much as it did during the other seven years of the 11-year time period we're looking at this week. At one point at the peak of the manufacturing crisis, it had to divert 23% of its sales revenue to pay warranty expenses, which in turn produced a whopping operating loss for the quarter ended Aug. 1, 2010. Thankfully, that whole episode is now behind the company. But what a calamity it was!


