

Auto Parts Supplier Warranty Report:
Compared to the automotive OEMs, the suppliers have kept their warranty costs low and ytheir expense rates stable. And while some saw costs drift upwards last year, on average the group remained about the same, as they have for the last few years.
While the makers of passenger cars and heavy trucks get all the headlines as their safety recall and warranty costs spiral upwards, the suppliers they depend upon get hardly any notice.
Years ago, the top car manufacturers tried to push a larger share of their warranty expenses back onto their suppliers. But last year, their attention was diverted to multiple large and costly recalls that left little time for supplier recovery efforts.
Now, the automotive parts suppliers are enjoying their lowest-ever warranty expense rates, slowly declining claims payments, rising sales, and steady warranty reserve levels. By multiple measures, these are the good times, as far as warranty costs go in the automotive supplier sector.
We began with a list of 157 companies that manufacture parts or components for cars and trucks. Most of them focus exclusively on the automotive industry, but some such as Johnson Controls, Eaton Corp., and A.O. Smith, also have significant operations in other industries such as aerospace and heating/air conditioning. And since we can't break out a company's warranty expenses by product line, the totals and averages below include some non-automotive quantities.
The warranty expenses of the automotive suppliers tend to be overshadowed by the OEMs they count as customers, because those OEMs typically end up paying much larger amounts, and at much higher rates compared to their product revenues. So being as we covered the truck and passenger car OEMs in detail in the March 26 newsletter, this week we will focus on their suppliers.
Falling Claims Payments
In Figure 1 we've totaled up the amounts they've paid in warranty claims each year since 2003. Amazingly, as the data shows, this total has been falling every year since 2006. Back then, it could be passed off as a sign that sales had peaked, but the trend has continued even as sales recovered. So there must also be an element of cost savings, achieved through more efficient warranty processes, higher product reliability, reduced payouts to OEMs, and other factors.
Figure 1
Worldwide Warranty Claims
of U.S.-based Auto Parts Suppliers
(claims paid in US$ millions, 2003-2014)
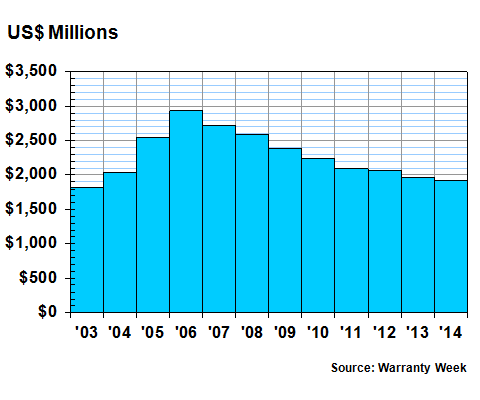
Last year, the industry total was $1.93 billion in claims paid, down from $1.97 billion in claims paid in 2013. The peak year was 2006, when $2.94 billion was paid out in claims. So the industry has achieved savings of more than a billion dollars in eight years -- a remarkable achievement that frequently gets overshadowed by the OEMs' own highly successful warranty cost-cutting efforts.
In monetary terms, Johnson Controls cut its annual claims cost by $28 million while Cummins reduced its annual payout by $23 million from 2013 to 2014. But in percentage terms among the larger suppliers, TRW Automotive Holdings was the clear winner, reducing its claims cost by 15%, from $47 million to $40 million. Also, Delphi Automotive and Allison Transmission each cut their claims cost by 10%.
At the other extreme, engine filtration product manufacturer Clarcor Inc. saw claims soar from $500,000 in 2013 to $5.87 million in 2014. A big part of the reason has to do with several acquisitions the company made, which brought it additional reserves and, yes, additional claims payments too.
Meanwhile, Goodyear Tire & Rubber Co. saw its annual claims bill rise from $22 million in 2013 to $39 million in 2014. And that in turn helped return Goodyear to the ranks of the top 100 warranty providers in the U.S., a group it was also part of from 2005 to 2009.
Other large warranty providers that saw their annual claims bill rise in 2014 included BorgWarner Inc. (up from $37 to $42 million), Dana Holding Corp. (up from $34 to $41 million) and Eaton Corp. (up from $99 to $120 million).
While there is no single huge and dominant industry player in the auto parts warranty category (like GM is among the OEMs or like Boeing and United Technologies are among the aerospace companies), it's worth noting that 19 of the 157 companies we're tracking in this category are among the top 100 warranty providers across all industries. And, as was detailed in the March 12 newsletter, Johnson Controls, BorgWarner, Goodyear and LKQ Corp. also figured among the most active members of the top 100.
Steady Accrual Totals
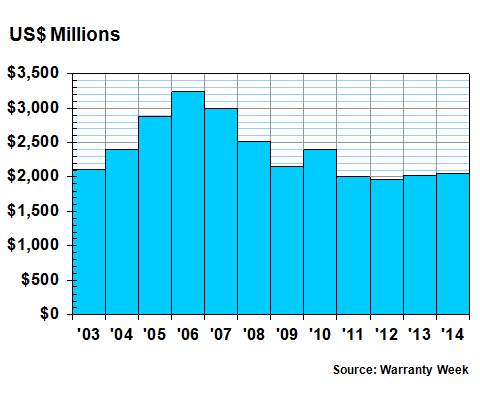
In Figure 2 we're tracking the accruals made by all the automotive parts and component suppliers each year from 2003 to 2014. Again, the trend is generally down from a peak in 2006, but with this warranty metric there aren't gradual reductions in each and every year since the peak.
Accruals were actually up a slight bit last year, from $2.02 billion in 2013 to $2.05 billion in 2014. And it's worth noting that the only year in which the industry's accruals fell short of the $2 billion mark was in 2012.
Figure 2
Worldwide Warranty Accruals
of U.S.-based Auto Parts Suppliers
(accruals made in US$ millions, 2003-2014)
Unlike warranty claims, the amount these manufacturers set aside in warranty accruals each year is entirely voluntary on their part. They're supposed to make their best prediction of future warranty costs, and set aside enough to cover that amount. So it should rise and fall in proportion with product sales, unless the manufacturer has detected a change in failure rates or repair costs that will impact future warranty expenses.
Product sales for the parts manufacturers rose 5.8% in 2014. The fact that accruals rose at only a fraction of that rate means that the manufacturers must believe their products are more reliable and will generate less warranty expense in the future than they did in the past.
Cummins again takes the top slot, reducing its annual accrual total by $20 million in 2014. But in relative terms, the reductions were larger by Delphi, TRW, and A.O. Smith.
There were many more accrual increases than decreases, however. One of the biggest was by Goodyear, which increased its accruals from $19 million in 2013 to $36 million in 2014. Eaton and Wabco Holdings also raised their accruals significantly last year, and Westinghouse Air Brake Technologies Corp. increased their accruals by almost half, from $23 million in 2013 to $34 million in 2014.
Flat Reserve Balances
In Figure 3, we're tracking another warranty metric: the ending balance in the collective warranty reserve funds of the 157 automotive parts suppliers from 2003 to 2014. Compared to claims and accrual totals, where the difference between the peak and the trough is a billion dollars or more, the totals for warranty reserves have been more stable in recent years. Since the peak of $4.21 billion in 2007, reserves have dropped by $380 million to the $3.83 billion total seen at the end of 2014.
Figure 3
Worldwide Warranty Reserves
of U.S.-based Auto Parts Suppliers
(reserves held in US$ millions, 2003-2014)
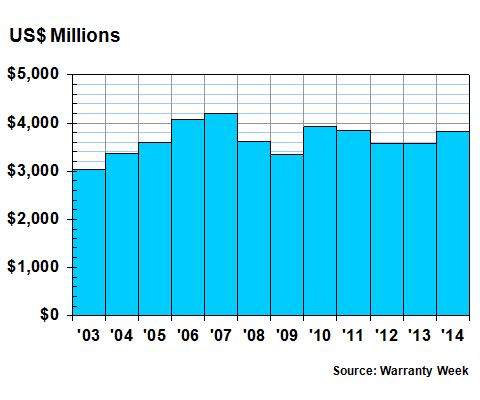
In both 2012 and 2013 the industry total was close to $3.57 billion, though the total was slightly higher in 2013. But with these plus 2010 and 2011 we've had five years of relatively stable warranty reserve levels among auto parts suppliers.
That doesn't mean there haven't been some large changes at individual companies. For instance, even though Cummins reduced both its claims and accruals in 2014, its reserves grew by $154 million, because the company also made some large upwards adjustments to compensate for lower-than-actual estimates in the past.
Then again, Cummins is the only company in this industry category with more than a billion dollars in warranty reserves. There are six companies with $100 to $200 million in their reserve funds, and two with between $200 million and $1 billion in them.
BorgWarner let its warranty reserve grow from $73 million at the end of 2013 to $132 million at the end of 2014. Johnson Controls raised its balance from $274 million to $315 million. And Westinghouse Air Brake raised its reserves from $61 million to $88 million. At the other end of the spectrum, Dana took $7 million out of its reserve fund; Meritor took out $9 million; Brunswick Corp. took out $10 million; and Delphi took out $14 million.
Declining Expense Rates
In Figure 4 we're comparing the claims and accrual data in Figures 1 and 2 to product sales figures, to calculate the percentage of sales being spent on warranty. Obviously, as the claims and accrual totals decline, so will the percentages. But the calculations are equally sensitive to changes in sales volumes.
As mentioned, though, the sensitivity should be primarily on the side of the claims rate, since you're essentially repairing last year's products with this year's money. In contrast, accruals should rise and fall in proportion with sales, and therefore that percentage rate should remain unchanged. A good example of this effect is boat engine maker Brunswick Corp. Sales were up 6%. Accruals also grew modestly, from $61 million to $65 million. But the accrual rate remained unchanged at 2.1%. Meanwhile, claims payments fell from $64 million to $55 million, so the claims rate fell from 2.2% to 1.8%.
The opposite effect was seen at Wabco Holdings. Sales were up 5%, and claims payments were up 6%, so the claims rate remained unchanged. But accruals grew from $21 million to $27 million -- rising at a much faster rate than sales -- so the accrual rate jumped from 0.8% to 1.0%.
Figure 4
All U.S.-based Auto Parts Suppliers
Average Warranty Claims & Accrual Rates
(as a % of product sales, 2003-2014)
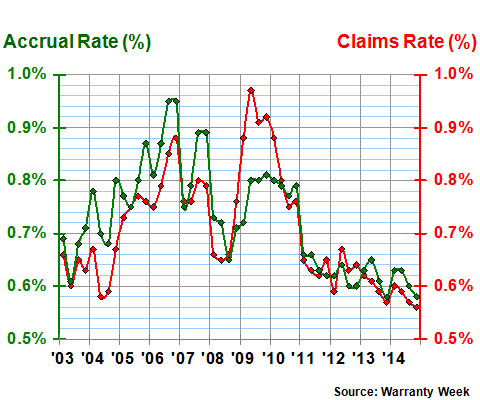
Overall, the 157 auto parts suppliers saw their average claims and accrual rates remain close to 0.6% for the fourth year in a row, as can be seen in Figure 4. The claims rate hit a high of just under one percent in the recessionary year of 2009, thanks to a spike caused by the drop-off in sales. The accrual rate rose almost as high back in 2006, which as a look back at Figure 2 will remind us, was also the peak year for accruals in terms of dollars set aside.
As was mentioned, LKQ Corp. earned a place in one of the Top 10 lists in the March 12 newsletter because of its relatively large claims rate reduction. However, there are several auto parts suppliers that just missed out on that list, including Brunswick, Allison Transmission, TRW Automotive, Cummins, and Delphi.
None of the parts suppliers made it onto the Top 10 list for accrual rate reductions, but again, there were a handful of near-misses, including LKQ, A.O. Smith, Delphi, Dana, Allison Transmission, Cummins, and O'Reilly Automotive.
At the other extreme, Goodyear and Johnson Controls were among the unfortunate companies to make a Top 10 increase list. In fact, Goodyear saw both its claims and accrual rates rise dramatically in 2014. But those who just missed the cut-off included Sherwin Williams, Dana, and Eaton on the claims side, and both Wabco and Standard Motor Products on the accrual side. All saw their expense rates rise by more than perhaps they would have liked.
Then again, since 2011 the overall expense rates across this group have been relatively stable, meaning that on average all the big increases have been balanced out by big decreases. Note that there are 32 data points between the start of 2011 and the end of 2014, and they are all between 0.56% and 0.67%.
Compared to the OEMs
Note that the vertical scale in Figure 4 is deliberately stretched in order to show the greatest possible variation in the claims and accrual rates. But in reality, there's not really that much range to the figures over all 12 years. Unlike in the OEM part of the automotive industry, the totals and averages among the parts suppliers don't change by all that much over time.
To demonstrate this, in Figure 5, we've added in the same two average expense rates for the automotive OEMs, which make everything from scooters and motorcycles to on-highway trucks and construction equipment. To get both pairs of averages on the same chart, we had to flatten out the vertical scale, which in turn flattens out the supplier data tremendously.
Figure 5
U.S.-based Automotive OEMs vs. Suppliers
Average Warranty Claims & Accrual Rates
(as a % of product sales, 2003-2014)
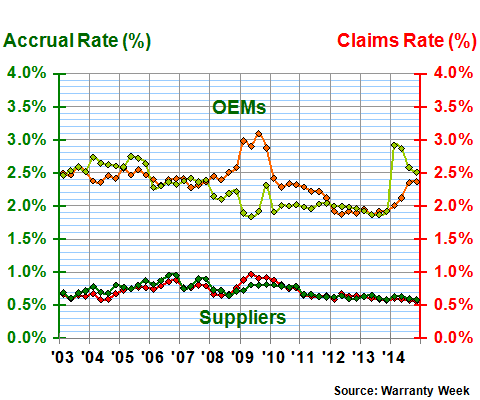
There are two points to make here. First, the supplier data is more uniform, and the OEM data is more erratic. Even though both show a recessionary bulge in 2009 claims rates, it's much more pronounced on the OEM side. And in 2014, as we detailed in the March 26 newsletter, the big story for the passenger car makers is the soaring cost of the numerous safety recalls. That shows up in the OEM data of Figure 5, but not in the supplier data.
The second point to be made is the relative width of the gap between the two pair of lines is once again widening. From 2003 until 2009, the average size of the gap between the two pair of lines was about 1.7%. And then, from 2010 to 2013, the gap narrowed to around 1.4%. But in 2014, as the OEM expense rates soared, the gap widened to around 1.9%.
Also, from 2003 to 2013, the gap was always more pronounced on the claims rate side than on the accrual rate side. But in 2014, that trend also reversed. The average gap in 2014 was 1.6% on the claims side but 2.1% on the accrual side.
Diminished Supplier Recoveries?
We think the narrowing of the gap from 2010 from 2013 coincides with the peak of success for the OEMs in terms of recovering reimbursements from their suppliers. And in 2014, once again the effect of the safety recalls comes into play, severely walloping some of the OEMs, but having little impact on the suppliers.
In fact, as is clear in Figure 4, in terms of low expense rates, from the declining claims seen in Figure 1, and the recent trend seen in Figures 2 and 3, in terms of steady numbers, these are the good times for the automotive suppliers. For the suppliers as a group, warranty expense rates are at a low point, sales are rising, claims are falling, and the OEMs are becoming preoccupied with their own soaring consumer-facing warranty costs.


