

U.S. & Asian Auto Warranty Report:
Almost every passenger car manufacturer is reporting rising warranty expense rates, thanks to soaring recall costs. But while some OEMs are seeing their costs per unit rise by a third or even by half, a few are reporting only small increases.
While lengthy and all-inclusive warranties are advertised as if they are a proxy for quality and reliability, in truth the actual cost of passenger car warranties doesn't seem to correlate that well with the reputation of the manufacturers.
This is Part Two of a series of newsletters on automotive warranty expenses. In last week's newsletter we covered the top European automotive OEMs and detailed both their warranty claims rates as a percentage of revenue and their accrual rates per vehicle sold. This week we'll do the same for the top Asian and American OEMs. All told, we're now up to 13 automotive OEMs reporting their warranty expenses, accounting for roughly two-thirds of global passenger car and light truck production and three-fourths of U.S. sales.
Last week, we looked at the warranty data of five European OEMs: Daimler AG; the Volkswagen Group; Fiat S.p.A.; BMW AG; and PSA Peugeot Citroen. This week, we will look at four Asian OEMs: both Honda and Toyota Motor Corp., as well as Hyundai Motor Co. and Tata Motors Ltd., and at four American OEMs: General Motors Co.; Ford Motor Co.; FCA US LLC (formerly Chrysler); and Tesla Motors Inc.
Out of that baker's dozen, which company would you say has the highest warranty costs? And which would you say has the lowest? Perhaps, before reading further, you could mentally sort those 13 OEMs into one of two groups: those you think have above-average warranty costs and those with below-average warranty costs. And then at the end of this newsletter, you can compare your perceptions against the reality.
What seems to be the reality is that good warranties are expensive. In other words, the manufacturers that always try to take care of the customer, that usually honor claims, and never try to skimp, seem to have the highest costs. Or to put it more plainly, the luxury brands have costly warranties. Sure, the frequency and severity of the warranty work is also a factor, but the luxuriousness of the brand seems to correlate more closely with its true warranty cost.
The passenger car OEMs still missing from our list include Nissan, Renault, Suzuki, Mazda, Mitsubishi, and Volvo Car Corp., among others. They simply do not report their warranty expenses to the public, nor are they required to. But it's possible some warranty data has made its way into the public domain at some point. Readers who have seen it are invited to alert us of its existence.
Welcome Tata & Hyundai
In Figure 6 we're welcoming two more OEMs into the mix: Tata Motors of Mumbai, India, and Hyundai Motor Co. of Seoul, South Korea. Tata Motors has been making passenger cars since 1991, but has been making trucks and train locomotives since 1945. For most of the past few decades, its passenger cars have had relatively brief warranties whose cost was typically under $100 per unit sold.
But then in 2008, Tata acquired the Jaguar Land Rover luxury nameplate from the Ford Motor Co., and the effect that event has upon its warranty expense rates is clearly shown in the chart below. Suddenly in 2009, its claims rate jumped to 3.4%, from a range of 0.7% to 1.3% before the acquisition. The claims rate has since then settled down a bit, ending fiscal 2014 at just under 2.5%.
Figure 6
Four Asian Auto OEMs
Warranty Claims Rates, 2003-2015
(as a % of product sales)
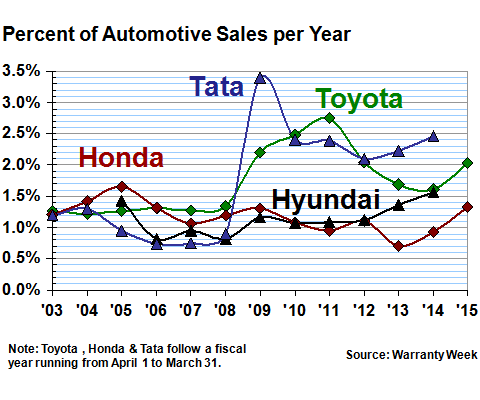
We should note that Tata, Toyota, and Honda all end their fiscal years on March 31. Readers with sharp eyes will note that there's no fiscal 2015 data for Tata in Figure 6. That's because while Toyota and Honda publish their annual reports in June, Tata doesn't do so until much later in the calendar year. In the past, this is why we've never included Tata in the round-up. This year, we'll simply mark them late.
The other new member of the Asian OEM warranty expense chart above is Hyundai, which has been making passenger cars since 1968 and whose U.S. subsidiary revolutionized the warranty industry in 1998 with its 10-year powertrain coverage. We can't find any 2003 or 2004 warranty data for the company, but as Figure 6 shows, the company has remained competitive with Honda in terms of always-low warranty expense rates.
Hyundai is on a calendar year financial schedule, though, so its 2014 claims rate of 1.6% is actually for the calendar year ended Dec. 31, 2014, while Toyota's 2014 claims rate of 1.6% is for the fiscal year ended March 31, 2014. Toyota's claims rate increased to 2.0% in fiscal 2015. Meanwhile, Hyundai's claims rate for the first quarter of calendar 2015 (not included in the chart) dropped to 1.3%.
Meanwhile, as we detailed in the July 2 newsletter, Honda's claims rate jumped from 0.9% in fiscal 2014 to 1.3% in fiscal 2015, primarily because of the expense of all the airbag recalls. So while Tata, Toyota, and Honda's warranty costs are generally rising in recent years, Hyundai's expense rates were rising, but are now falling. And as we shall see, its expense rates per unit sold have always been low.
Expense Rates per Vehicle Sold
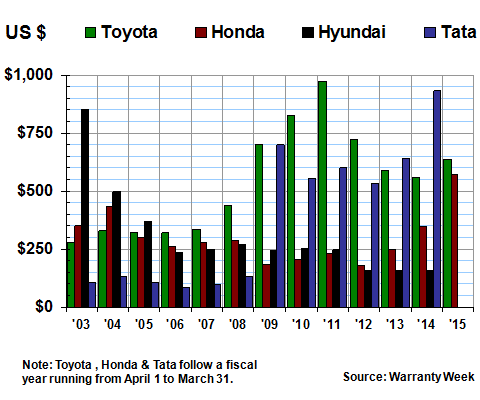
In Figure 7, we're taking the amount of accruals reported by each of the four Asian OEMs, and dividing those totals by the number of vehicles sold per year. This results in a warranty metric that forecasts the projected cost of that vehicle's warranty over the life of its warranty: accruals per unit sold.
Accruals are made at the time a vehicle is sold, so by deciding on an amount each company is telegraphing its own best estimate of the amount of claims it expects to pay for those vehicles. The accrual rate should not go up or down unless there's a projected change in parts cost, labor cost, or the frequency of repairs. So when it does go up or down, the company itself is revealing its own predictions and expectations.
Once again, as with the claims rate, in Figure 7 it's clear for Tata where the line before and after Jaguar Land Rover should be drawn. Not only did its claims cost skyrocket, but also its accrual rate per vehicle.
However, because the sales price of a Jaguar XE or a Range Rover is so much higher than most of Tata's own nameplates, the accrual rate as a percentage of revenue did not take as big a jump as the accrual rate per unit sold. In other words, as we said earlier, luxury warranties are costly.
Figure 7
Four Asian Auto OEMs
Warranty Accruals per Vehicle, 2003-2015
(in US$ per vehicle per year)
But again, as we said last week, the warranty expenses of these OEMs really shouldn't be compared to each other directly, because of all the factors besides product reliability that can impact warranty expense rates. Instead, it's more appropriate to compare the figures of a single company to itself over time.
However, it's also important to consider when a company gains or loses cost leadership, and when a company's costs are declining when everyone else's are rising. In other words, it's important to note that Tata went from least to most costly from 2007 to 2009. But it's also important to know why.
Rising Dollar Meets Rising Recalls
As a final step in our calculations, we converted the Japanese yen used by Toyota and Honda, the South Korean won used by Hyundai, and the Indian rupees used by Tata into U.S. dollars. This of course introduces its own layer of bias into the data, because currencies of course rise and fall independently of warranty costs. Merely picking one can put companies that report in other currencies at a disadvantage. However, many of these OEMs have an active presence in the U.S. market (and in China, whose currency is pegged to the dollar), so the rise and fall of the dollar is more than just a theoretical pain in their side.
So what happens, for instance, when U.S. safety recalls rise, and the dollar rises at the same time, is that accrual rates reach record heights, as happened to Toyota in fiscal 2011. Because of all the U.S. recalls, the company had to set aside almost 80,500 yen per vehicle sold. And because the exchange rate was down to 83 yen to the dollar, that meant its cost was equal to US$973 per car. Bad luck meets bad timing.
However, not everything can be blamed on exchange rates. Tata, you'll notice, set aside the equivalent of US$932 per vehicle in fiscal 2014. That's based on the accruals it made for the combination of 589,000 Tata-branded vehicle sales and 432,000 Jaguar Land Rover vehicle sales. We don't know how much was accrued for each brand, but almost 57 billion rupees were accrued for all of them. And that's twice as much as was accrued by Tata on a company-wide basis in fiscal 2011, and an incredible 18 times as much as was accrued by the company in fiscal 2008. Total unit sales are actually down from 2011 levels, though Jaguar Land Rover sales have almost doubled since then. Like we said, luxury warranties are costly.
And finally, look at the way Honda's accrual rate per vehicle has climbed over the past few years. From fiscal 2009 to 2011, Honda had the lowest accrual rate per vehicle in Asia, and probably the world. But that title passed to Hyundai, whose accrual rate remained steady as Honda's accrual per vehicle rate climbed to $250 in fiscal 2013, $346 in fiscal 2014, and $571 in fiscal 2015.
The Warranty Doghouse
The overriding message of Figure 7, however, is that everybody gets a turn in the doghouse sooner or later. It happened to Tata when it acquired a luxury brand with astronomical warranty costs. It happened to Toyota with the unintended acceleration recalls. It happened to Honda with the airbag defects. And as we're about to see in the American OEM charts, it happened to GM with the ignition switch recalls.
In Figure 8, all four American OEMs have seen their claims rates rise since the end of 2013. GM's rose the most, from 2.1% to almost 2.9%. But Ford was also up, from 1.7% to 2.1%. And FCA US, the American arm of Fiat Chrysler Automobiles, was up from 2.2% to 2.5%.
Figure 8
Four American Auto OEMs
Warranty Claims Rates, 2002-2014
(as a % of product sales)
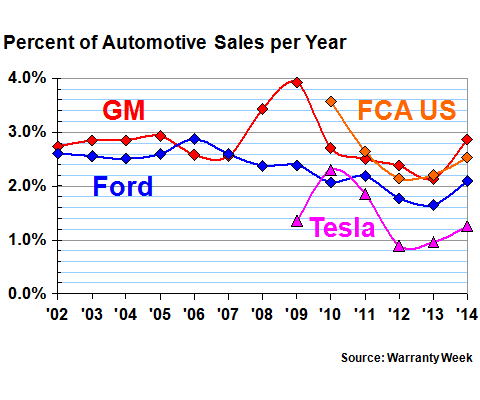
Tesla, meanwhile, presents its own puzzle. Its claims rate was below one percent in 2013. And while it rose to 1.25% in 2014, it was still the lowest of these four companies, as it has been for four solid years in a row. Yet its accrual rate per vehicle sold is astronomical -- the highest in the world, at least for passenger cars. How can a company with such low claims costs per dollar earned have such incredibly high accrual costs per unit sold?
The Detroit Three
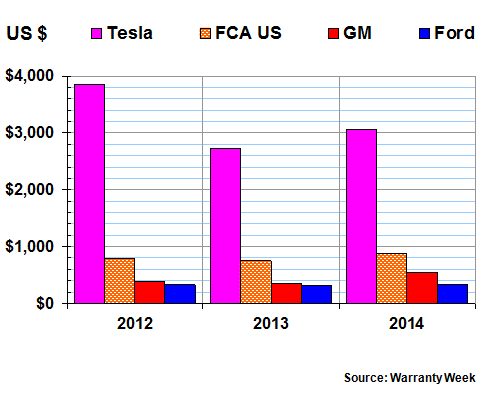
In Figure 9, we're not including Tesla because its accrual rate per vehicle sold is three or four times as high as the others, and its inclusion would disfigure the vertical axis of the chart below. Plus, we only have three years of electric car sales data to work with anyhow. So we bumped that Tesla data into a separate chart, in Figure 10.
What Figure 9 show us is that Chrysler has always been setting more aside per vehicle sold than either GM or Ford. The latter two enjoyed declining accrual rates from 2007 to 2009, despite the recession, which ironically means their reliability was improving just as sales deteriorated. But they kept the low accrual rates from 2009 to 2013, for the most part, before it was GM's turn to go into the doghouse in 2014.
Figure 9
Three American Auto OEMs
Warranty Accruals per Vehicle, 2002-2014
(in US$ per vehicle per year)
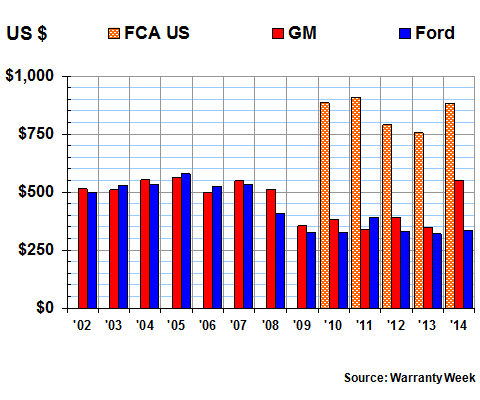
We estimate that GM's accrual rate per vehicle jumped from $350 in 2013 to $550 in 2014, while Ford's rose from $320 to $333 per unit sold. Those are worldwide averages, of course, so there's no way to say for sure which nameplate or what market accounted for the increases. FCA US was also up, from $754 in 2013 to $883 in 2014. But its accruals in 2010 and 2011 were even higher per unit than they have been recently.
The point is, there are distinct patterns in the data, which illustrate the warranty expense trends of these companies over time. GM and Ford were once setting aside roughly $500 per vehicle sold, before increased reliability and reduced warranty expenses allowed them to push that cost per unit below $350. Chrysler has been significantly and consistently above the $700 level for years, without any evidence of warranty cost reductions. And GM has not been able to keep its costs low, while Ford has avoided entering the warranty doghouse (so far).
Apples and Oranges
And then there's Tesla. As is clear in Figure 10, Tesla's electric cars are really in a different product category when it comes to warranty costs. First of all, the company is setting aside between $2,700 and $3,800 when a vehicle is sold, suggesting that it expects to incur at least that much cost over the life of its warranty. Second of all, that's between 3-1/2 and 11 times as much as the others accrue per unit when they sell a combustion-engine-powered vehicle.
That's an astonishing difference. It's almost as if we're comparing cars and trucks here. It's like we're noting that Paccar Inc. or Navistar International are setting aside thousands of dollars for every truck they sell, and comparing that to the $350 or $500 that Ford and GM are accruing per car they sell.
It's just not the same product. They can't be compared, at least not on the basis of warranty cost per unit. The units have to be similar enough to make the comparison meaningful. When we compare warranty expense rates based on revenue, the unit of comparison is the dollar or the euro, or the currency of the manufacturer. And then it makes sense to say that one percent is low while five percent is high, whether the product is an airplane or an air conditioner. But comparing an electric car to a gasoline engine? Proceed at your own risk.
Figure 10
Four American Auto OEMs
Warranty Accruals per Vehicle, 2012-2014
(in US$ per vehicle per year)
If we had warranty data just for the Nissan Leaf, the Chevrolet Volt, and the Toyota Prius, perhaps then we could make some valid comparisons between Tesla and similar products. But in terms of warranty costs, the Tesla cars are not just alt-fuel luxury cars. Their warranty footprint is fundamentally different from the Mercedes and BMW luxury models we looked at last week, not to mention the Jaguar Land Rover luxury product line that's raising Tata's warranty costs so noticeably in this week's calculations. You simply don't spend $3,000 on a warranty for a traditional passenger car and expect to do so for very long.
However, the Tesla Model S is not a traditional passenger car. In the future, the divergence will become even more noticeable. The battery is such a large part of an electric car, and its potential replacement under warranty is a huge cost factor. But what if future designs allow a fully-charged battery to be hot-swapped for one with no charge, under some sort of electric vehicle service contract? What if most repairs become replacements, and a good warranty becomes more important than a good mechanic? At that point, $3,000-per-vehicle warranty costs might be typical.
Ranked In Descending Order
In Figure 11, we're simply putting together all the figures from last week and this week into a single chart that tracks accruals per vehicle. All the data points have been calculated by dividing the number of vehicles sold into the total amount of accruals made. It's not the customary way to measure warranty costs. But isn't it amazing to see that the latest figures range all the way from the $159 per vehicle accrued by Hyundai to the $1,445 accrued by Daimler?
Figure 11
Twelve Top Worldwide Auto OEMs
Warranty Accruals per Vehicle, 2013-2014
(in US$ per vehicle per year)

For the previous year, the same OEMs were at the top and bottom: Hyundai had the lowest accruals at $155 per vehicle while Daimler had the highest at $1,432 per vehicle. Some of that is due to movements in currency exchange rates, of course. And some of it has lots to do with tax rates, labor costs, shipping costs, and other factors outside the control of the OEMs.
In terms of what the OEMs can control, clearly the accrual rate per vehicle is related to the average selling price per vehicle and the level of luxury the customer expects. Those free donuts at the dealership aren't really free. Nor are the free loaner cars, the free drop-offs, or the other comforts of the luxury warranty repair experience.
Still, isn't it curious that the three German OEMs came out on top? They're the only three OEMs setting aside more than $1,000 on average per vehicle sold. Of course, they don't have the worst reliability records. So why the high costs? Daimler can blame their trucks. BMW can blame their Minis and motorcycles. VW can blame China. And they all can blame the euro.
And then in the middle are the rest of the Europeans: the French PSA, the Italian Fiat, the Italian-American FCA, and the British-Indian Tata, are each between $700 and $1,000 per vehicle. Their rank in the queue changes a bit from 2013 to 2014, but basically you have the Germans at the high end and the rest of Europe in the middle of the pack.
Then you have the three companies currently in the recall doghouse: Toyota, Honda, and GM. All three were between $500 and $700 in 2014. In 2013, Honda had about the same accrual-per-vehicle cost as GM and Ford. In 2014, it was between Toyota and GM, at $571 per vehicle.
And then at the bottom, you have Ford and Hyundai. In 2014 they were the only OEMs with accrual-per-unit figures below $500. Those that came in under that threshold in past years -- Tata, PSA, Fiat, Toyota, Honda, and GM -- were well above it in 2014.
So let's divide the dozen into three sections, based on warranty cost per unit. The low section runs from $0 to $500, and is currently populated by just Ford and Hyundai. The high section is over $1,000, and is currently populated by Daimler, BMW and VW. And then the rest are in the middle, which is undoubtedly where the worldwide average also lies.Allowing for Exchange Rates
Convert all the data into either euro or yen and the descending order doesn't change much, though some of the extremes are moderated somewhat. That's because some of the European OEMs, for instance, do most of their business in Europe, so they sell in euro, accrue in euro, and pay claims in euro. The strength of the dollar therefore isn't much of a factor in real terms, though it is in these charts.
Still, no matter which currency is used, eleven of these 12 OEMs saw their accruals-per-vehicle rates increase from 2013 to 2014, with the sole exception being Volkswagen. Three of them saw relatively small annual increases: Daimler, Ford, and Hyundai. Among the remaining eight, two saw moderate increases in their accruals per vehicle: Toyota and FCA US. And then an incredible six OEMs saw their accrual rates per vehicle shoot up by a third or more: BMW, Fiat Europe, GM, Honda, PSA, and Tata.
We know why Honda and GM are on that list: they're in the doghouse. So it's no shock to discover that their accrual rates rose the fastest in 2014. But who knew both BMW and Tata increased their accruals per vehicle by roughly 50% last year? As we've said repeatedly, those accrual rates shouldn't change by much unless there has been a big change in predicted warranty costs. So if it's not tax rates or currency exchange rates, it must have something to do with either the predicted cost or frequency of warranty work.


