


U.S. Automakers' Warranty Expenses:
Because there were so many big recalls in 2014, the amount spent on warranty soared. Last year, things began to get back to normal, but expense rates are still at elevated levels. Nevertheless, unit sales totals smashed a 15-year-old record in 2015.
Despite what the gyrating stock market might be saying this week, these are the good times, at least for the auto market. According to sales data released this week by the U.S.-based automakers, there were more new cars and trucks sold last year in their home country than in any other year. The final industry tally topped 17.47 million, finally surpassing the old record of 17.35 million units sold in the year 2000.
General Motors Co. sold about 3.1 million vehicles in the U.S. last year, up 5% from 2014. Ford Motor Company sold about 2.6 million units in the U.S. last year, also up 5% from 2014. Fiat Chrysler Automobiles US LLC sold 2.2 million units in the U.S. last year, up 7% from 2014 levels. And Tesla Motors Inc. sold 50,580 cars worldwide, a jump of almost 60% from 2014 levels.
However, in another sign of how much things have changed in the past 15 years, while prices are up, so is product reliability, and warranty costs are down both as a percentage of revenue and on a per-vehicle basis. And according to early reports from the dealerships and vehicle service contract administrators, their sales have never been better either.
Waiting for Annual Reports
It will be at least another month before we get to see the accompanying sales revenue and warranty expense figures for each of these OEMs, so we can calculate expense rates per vehicle and per dollar of revenue. And it will be another few months before we can compare that U.S. data to the annual reports of the top European carmakers that also disclose their warranty expenses.
But why wait? We already have nine months of 2015 data, at least for GM, Ford, FCA and Tesla. We ended our 2015 run of newsletters with snapshots of the high-tech hardware market leaders Apple Inc. and Microsoft Corp. Why not change gears, if you'll pardon the pun, and start this year with a look at the U.S.-based automotive OEMs?
In November, we collected six essential metrics from the financial reports of each of these four OEMs: the amount of claims they paid during the year to date, the amount of accruals made, the amount of adjustments made for under-accruals made in previous years, the balance in their warranty reserve funds, the number of vehicles sold, and the amount of automotive revenue that those sales generated. What follows are some calculations based on all of those metrics.
Let's start with the claims rate, which is calculated by dividing the amount of claims in dollars by the amount of automotive sales revenue. It results in a percentage, which has ranged from the 5% level reported by FCA in 2009 to the under-one-percent levels reported on several occasions by Tesla.
The data in Figure 1 is quarterly, unlike the annual data included in the July 16, 2015 newsletter. That's because in July we were making comparisons to European and Asian manufacturers whose data is annual-only. But this week, all four companies report their warranty expenses quarterly, so why not use all the data?
Figure 1
Four American Auto OEMs
Warranty Claims Rates, 2003-2015
(as a % of product sales)
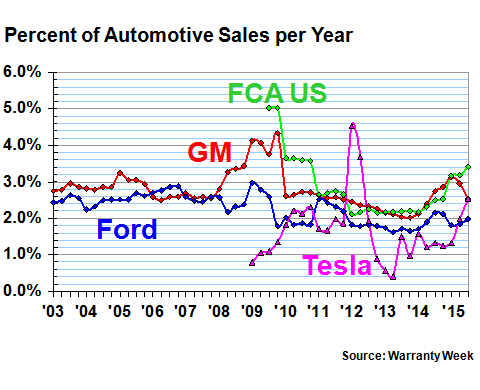
Tesla didn't begin reporting until 2008. FCA didn't begin reporting until 2009. Chrysler's warranty data was included in Daimler AG's financial reports until 2007. From then until mid-2009, we are missing Chrysler's data.
Claims rate data, especially with cars and light trucks, can be misleading, because the rate of sales is changing independently of the cost and frequency of warranty work. Basically, you're fixing last year's sales with this year's money. So some of the spikes and troughs in Figure 1 could be exaggerated by the lag time between when a vehicle is sold and when it needs repairs.
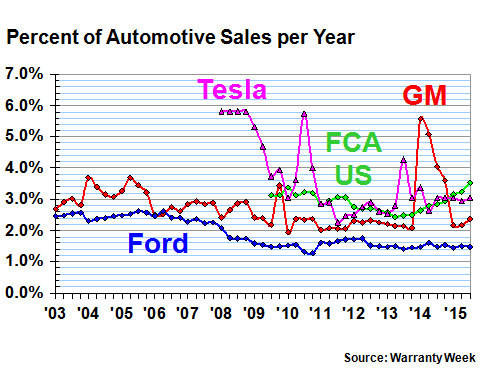
In contrast, warranty accruals are made at the time of sale. So they should rise and fall in step with sales. So if the percentage rate changes, it's primarily because of a change in the cost and frequency of warranty work. In other words, it's a more accurate and less fallible measure of the relative cost of warranty than claims, especially when the warranties last for multiple years.
Conventional Accrual Rates
In Figure 2, we've compared the warranty accrual totals for the four OEMs to their corresponding automotive sales revenue figures. We have to subtract all the finance, service, and investment revenue from the calculation, leaving only the product revenue behind. That way, when the percentage is three percent, we know that it means the company is setting aside three percent of its product revenue to cover product warranty expenses.
But there's a problem: ever since its ignition switch problem became public, GM has listed two different types of current accruals: "Warranties issued and assumed in period – recall campaigns and courtesy transportation," and "Warranties issued and assumed in period – policy and product warranty." We're going to count both together as simply "accruals." In fact, that's the main reason for the 2014 spike in GM's data in Figure 2, and for the massive decline in that rate in 2015.
The recall accrual expense for the first nine months of 2015 was $685 million, down sharply from $2.658 billion in the same period in 2014. But GM's regular accruals were also down: $1.742 billion in 2015 versus $1.904 billion in 2014. Therefore, total accruals -- regular and recalls -- were $2.427 billion in the first nine months of 2015, down from $4.562 billion in 2014. So the accrual rate plummeted.
Figure 2
Four American Auto OEMs
Warranty Accrual Rates, 2003-2015
(as a % of product sales)
However, there's also a problem with the way we're measuring accruals: manufacturing companies frequently discover that their past-year accruals were too high or too low, so they adjust the balance with a change of estimate. These adjustments can be upwards or downwards. If they are upwards, they add to accruals, in the sense that they become an additional way to add to the balance in the warranty reserve fund. If they are downwards, they add to claims, in the sense that they become a second way to reduce the balance.
In the past two years, all of these auto OEMs have made only upwards adjustments. So we should add those amounts to accruals. But we won't recalculate the accrual rates in Figure 2. Instead, we'll make a separate set of charts.
GM calls its changes of estimates "Adjustments to pre-existing warranties," in order to differentiate them from current-year accruals. For now, we'll simply mention their size: an added $1.095 billion in the first nine months of 2014, and $132 million in the first nine months of 2015.
Ford lists only one type of claims, and one type of accruals, for vehicles sold in the current year. So the calculation of its warranty expense rates in Figures 1 and 2 is rather straightforward.
However, Ford also made some adjustments to its accrual totals for past-year sales, what it calls "Changes in accrual related to pre-existing warranties." Those amounted to $1.522 billion in the first nine months of 2014 and $495 million in the first nine months of 2015.
FCA US, the Fiat business unit that reports Chrysler's warranty expenses, also lists just one type of claims and one type of accruals. But it also makes adjustments for past years -- what it calls "Net adjustments to pre-existing warranties."
However, unlike GM and Ford, those adjustments didn't decline precipitously in 2015. In fact, they soared last year. The adjustment in the first nine months of 2014 was $407 million. In 2015 it rose to $1.351 billion.
Tesla, meanwhile, was among the OEMs that significantly reduced its past-year warranty adjustments in the first nine months of 2015. The adjustment, which Tesla calls "Net changes in liability for pre-existing warranties, including expirations," was an upward $24.270 million in the first nine months of 2014 and an additional $12.635 million in the same period last year.
One-Time Charges?
Normally, these adjustments are usually dismissed by most Wall Street analysts, who call them one-time charges, and who therefore discount them from year-over-year earnings comparisons. We think that's a mistake, because a company could intentionally and repeatedly underestimate its true warranty expenses, and make net income look better than it really is. Then, down the road, the corrections are overlooked because they're expected to be an isolated incident.
Likewise, such a system wouldn't register the positive impact of situations where the company overestimated its warranty costs in the past, artificially depressing earnings, which it corrects by a downward change of estimate and thus and ends up with spare cash it recognizes as net income. Indeed, sometimes these change-of-estimate adjustments can be decreases, in the sense that manufacturers are taking money out of their warranty reserve. And sometimes there are no adjustments at all, because claims were exactly in line with expectations and accruals were sufficient to cover them.
In the pie chart below, we're counting both the regular accruals of the OEMs during the first nine months of 2014 and the adjustments they made, which we can do only because all four made upwards adjustments in both years. Had any of them instead made downward adjustments, we would have to include them with claims as two different types of decreases.
In Figures 3 and 4, we're using the same color scheme for the OEMs as we did for the accruals in Figure 2. But we're adding a second slice for each, in a related color, that shows the relative size of their change-of-estimate adjustments. Figure 3 is for the first nine months of 2014, and Figure 4 is for the first nine months of 2015.
Figure 3
Four American Auto OEMs
Accruals + Adjustments, First 9 month of 2014
(in US$ per company)

Combined together, GM's regular accruals, recall accruals, and upward adjustments added up to $5.657 billion in 2014. As is apparent in Figure 3, this means GM accounted for more than half the U.S.-based industry's $10.85 billion total accruals during that time period.
Ford's accruals plus adjustments added up to $3.028 billion. And as the chart shows, the company's "regular" accruals and the adjustments were comparable in size. In other words, the accrual rate in Figure 2 should have been twice as high in 2014.
FCA US had regular accruals of $1.706 billion and adjustments of $407 million in the first nine months of 2014, for a total of $2.113 billion. And then Tesla's total for accruals plus adjustments was $50.204 million, which barely registers as a sliver in the chart above.
As mentioned, all but FCA US made massive reductions to their accruals and adjustments in the first nine months of 2015. GM fell by more than $3 billion to $2.559 billion. Ford fell by more than $1 billion to $2.018 billion. And Tesla fell to $38.661 million. However, FCA US rose dramatically to $3.656 billion, consisting of $2.305 billion in regular accruals and the aforementioned $1.351 billion in upward adjustments.
Figure 4
Four American Auto OEMs
Accruals + Adjustments, First 9 month of 2015
(in US$ per company)
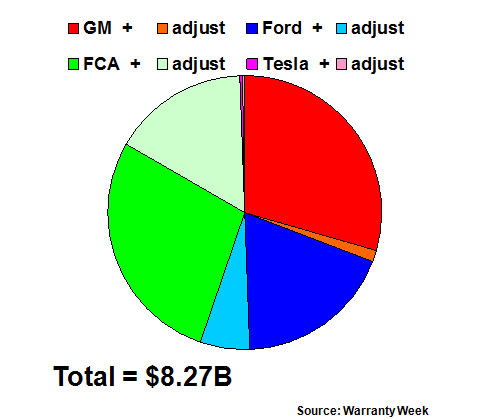
These adjustments are not included in the percentage calculations for claims rate and accrual rate in the charts above. But that doesn't mean they don't count at all. If we were to add the traditional accruals and the adjustments together, and then divide by sales, the accrual rate as of September 2014 for GM would have been 5.0% instead of 4.0%; 3.0% instead of 1.5% for Ford; and 2.4% for Tesla instead of 1.2%. More recently, it would have been 3.5% for FCA instead of 2.8% as of September 2015. So their absence from the calculations does have an impact, especially because of the way the accounting is done for the massive recent recalls.
The industry total fell to $8.27 billion. For anyone keeping score at home, that's an unprecedented 24% decrease in outlays. If we look at just GM, Ford, and Tesla, the drop was 47% -- a $4.12 billion decline from one year to the next!
Warranty Cost Per Vehicle
The other way to measure accruals is per vehicle sold. This is possible because accruals are supposed to be made at the time a vehicle is sold, in an amount sufficient to pay for all claims until the warranty expires. We don't know how many warranties will expire on time and how many will expire on mileage, or indeed, how many cars will be wrecked, flooded, or stolen. But we don't need to know. That's a problem for the actuaries who work at the automakers to solve.
Obviously, by the looks of the errors detailed in Figures 3 and 4, they haven't been too accurate with their predictions for the past few years. And again, in a way we're not penalizing them for those errors, because the adjustments that closed the gaps between predicted and actual expenses aren't included in Figures 5 or 6. Nevertheless, let's see what we have so far.
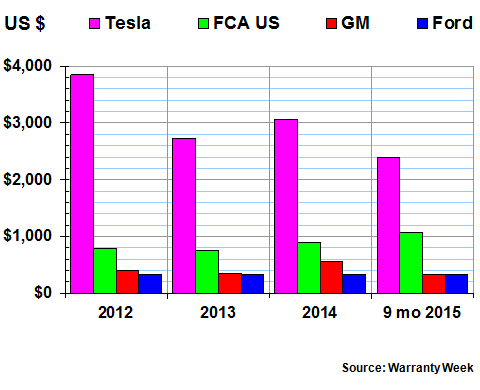
Most of the data in Figures 5 and 6 was already published in the July 16, 2015 newsletter. So we're simply adding on our estimates for 2015, using nine months of sales data and nine months of accrual data. We're not including Tesla in Figure 5 because its accruals-per-vehicle rate is dramatically different from the others, as is its product.
Figure 5
Three American Auto OEMs
Warranty Accruals per Vehicle, 2002-2015
(in US$ per vehicle sold)
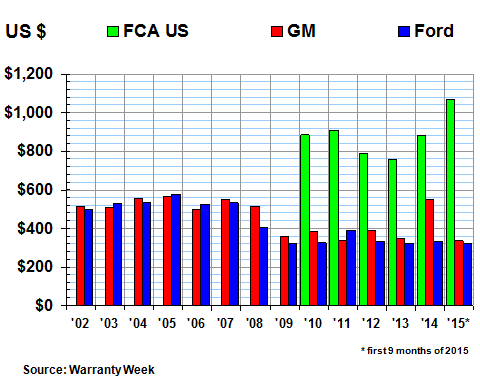
Basically, what Figure 5 shows is that GM and Ford are now back down to their post-2009 averages after a tough 2014. But for Chrysler, per-vehicle accrual rates are now over $1,000, up more than 20% from 2014 levels.
Tesla's Rising Sales
And then there's Tesla, with its all-electric cars, where the health of the battery is the major warranty worry and the warranty cost of old electric cars is still largely unknown. Back in Figures 1 and 2, there was a noticeable gap between Tesla's low claims and much higher accrual rates, which is caused by the company's tendency to put more aside for the tail end of its warranties than it does for the first few years of their lifespans. That's a recognition that the massive cost of battery replacements, if required, will arise when these vehicles are not so new.
Unlike the other U.S.-based OEMs, Tesla doesn't include unit sales figures in its financial statements. It does, however, issue periodic press releases and shareholder letters containing that crucial piece of data. In April, the company said it delivered 10,045 vehicles in the first quarter of 2015. Then it announced 11,532 Model S deliveries in the second quarter of last year. In the third quarter, Tesla said it delivered 11,603 vehicles, including both Model S and Model X units.
So that's 33,180 unit sales in the first nine months, subject to "small changes to this delivery count (usually well under 1%), as Tesla only counts a delivery if it is transferred to the end customer and all paperwork is correct."
Tesla delivered 31,655 vehicles in 2014. For the full 12 months of 2015, Tesla just this week announced deliveries of about 50,580 Model S and X vehicles, representing a 60% increase over 2014 totals. However, we still don't have 12-month warranty data, so we'll have to default to nine-month data.
In Figure 6, we're adding a new data point for Tesla to the previously-published July 2015 newsletter data. Based on $79 million in accruals and 33,000 vehicles delivered in the first nine months of 2015, we estimate the accrual rate per electric vehicle to be $2,391. That's radically down from the rate in previous years. However, it's still dramatically higher than the accrual rate per vehicle seen at GM, Ford, or FCA.
Figure 6
Four American Auto OEMs
Warranty Accruals per Vehicle, 2012-2015
(in US$ per vehicle sold)
Finally, in Figure 7 we're combining the warranty reserve fund balances of the four OEMs as of the end of September 2015, which they each reported in their quarterly financial statements in November 2015. GM reported $9.253 billion in reserves; Ford had $4.575 billion; and FCA US was at $6.046 billion. Tesla was an order of magnitude smaller at $170 million. In the chart below its slice is barely visible.
New Record for Warranty Reserves
All told, the four OEMs have set aside just over $20 billion to pay claims for all vehicles sold through the third quarter of 2015, which is a new record. In late February or early March we'll find out their year-end balances, which may be even higher.
Figure 7
Four American Auto OEMs
Warranty Reserves as of 30 September 2015
(in US$ per company)
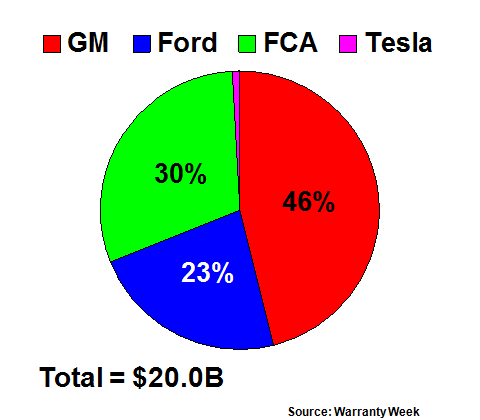
For comparison's sake, a year ago in September 2014, their combined balance was $19.2 billion, and at the end of 2014 it was $19.25 billion. When the recalls began in earnest in early 2014 the balance was $17.2 billion. From 2011 to 2014 it was relatively stable, somewhat above or below $14 billion. So it's up around 40% to 45% since then. And once again we're talking about multiple billions of dollars.
We don't know exactly how many vehicles under warranty that amount of money is meant to cover, because warranties also expire due to heavy usage or wreckage, and the simple fact that not every vehicle these companies sell gets exactly the same warranty in every country. There are still lots of places where only one or two years of coverage is common. After all, it's not that long ago that even in the U.S., the standard factory warranty was only 12 months or 12,000 miles.
In conclusion, while GM and Ford are now returning to their 2009-2013 averages, following dramatic "manufacturing excursions" in 2014, FCA is still having trouble keeping its warranty costs under control. However, because of the size of some change-in-estimate adjustments, the accrual rates per dollar and per vehicle don't tell the full story. Meanwhile, Tesla's warranty data, while still higher than its combustion-engine peers, is at least headed in the right direction.


