

Automotive OEM Warranty Report:
There were some big declines in warranty costs last year, but it was more a case of getting back to normal after a bad 2014 filled with recalls. Still, the carmakers set a new low for their expense rates, and many of the heavy truck and construction equipment companies also continued to push warranty costs lower.
Whether it's big vehicles or small vehicles, the automotive industry is the most warranty-intensive of all. Automotive manufacturers take the biggest share of the warranty pie and have some of the highest warranty expense rates of all. The good news is that some of the well-known truck and car manufacturers that ran into headline-grabbing warranty problems in 2014 largely recovered from their misfortunes in 2015.
In this year's report, we're going to split the automotive OEMs into two groups for comparison: large vehicles and small vehicles. Included with large vehicles are all the manufacturers of on-highway trucks, buses, recreational vehicles, heavy construction equipment, farm machinery, fire trucks, garbage trucks, and railroad boxcars. Included with the small vehicles are pickup trucks, passenger cars, SUVs, motorcycles, snowmobiles, ATVs, forklifts, riding lawn mowers, scooters, and golf carts.
Out of a population of 49 automotive OEMs, this results in an almost even split, with 25 large vehicle OEMs led by Caterpillar Inc.; Deere & Co.; Paccar Inc.; Navistar International Corp.; AGCO Corp.; Thor Industries Inc.; Terex Corp.; and Oshkosh Corp.; and 24 small vehicle OEMs led by General Motors Co.; Ford Motor Co.; Harley-Davidson Inc.; Polaris Industries Inc.; Tesla Motors Inc.; Toro Co.; Hyster-Yale Materials Handling Inc.; and Arctic Cat Inc.
We're counting the worldwide warranty spending of these U.S.-based companies. We are not counting the warranty spending of internationally-based companies and importers. And because FCA US LLC has now stopped reporting its U.S. warranty expenses, we are counting it retroactively as an international firm owned by Fiat Chrysler Automobiles N.V. We'll get to them later, alongside VW, BMW, Daimler, and a few other European OEMs.
Totals and Averages
For the past 13 years, Warranty Week has collected four basic metrics from each company: claims paid, accruals made, reserves held, and products sold. By dividing one of these metrics into another, we've created three more metrics: the claims rate (claims divided by sales); the accrual rate (accruals divided by sales); and the warranty reserve capacity (reserves divided by claims). We'll present these metrics in the following six charts.
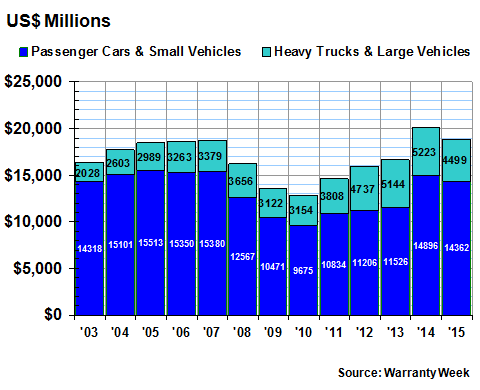
In Figure 1 you'll find the annual claims totals for the large and small vehicle makers. Notice that the small vehicle makers dominate, accounting for roughly 70% to 75% of the annual totals. This is because of the multi-billion-dollar claims payments of GM and Ford, which along with Apple Inc. are the largest U.S.-based warranty providers of all.
Figure 1
Automotive OEM Warranties
Claims Paid Worldwide by U.S.-based Manufacturers
(in US$ millions, 2003-2015)
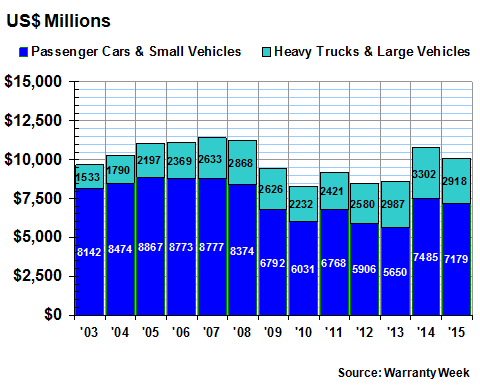
Ford and GM usually pay out $3 and $4 billion per year, respectively, while smaller manufacturers such as Harley, Tesla, and Polaris pay out between $20 and $100 million. But GM actually paid out $339 million less in 2015 than it did in 2014, as it wrapped up the impact of the ignition key recall. Harley paid out $22 million more, Tesla paid out $13 million more, and Polaris paid out $9 million more. Ford and Toro remained about the same. Overall, the car and small vehicle makers cut their claims cost by about 4% in 2015.
Among the large vehicle makers, there were big cuts in claims payments. Caterpillar paid out $197 million less in 2015 than it did in 2014. Navistar cut its claims payments by $120 million. Paccar was down by $46 million. AGCO was down by $19 million. And Deere was down by $13 million. That goes a long way towards explaining the 12% overall reduction in their claims payments in 2015.
Warranty Accruals
In Figure 2, warranty accruals are tabulated for the past 13 years. Once again, the passenger car accruals dominate, accounting for roughly 70% of the total. And once again, Ford and GM dominate the charts overall, setting aside $2 billion and $3.3 billion, respectively, in 2015.
Figure 2
Automotive OEM Warranties
Accruals Made Worldwide by U.S.-based Manufacturers
(in US$ millions, 2003-2015)
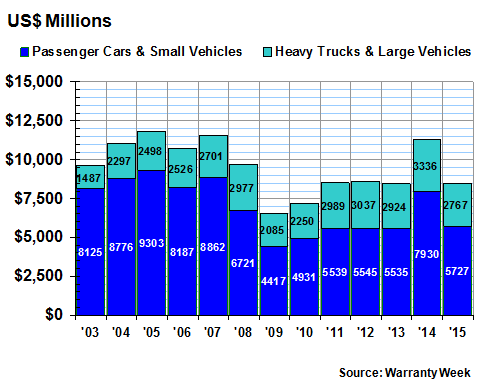
The most notable feature of the chart above is how consistent the overall accrual total has been at the $10 billion level in four of the past five years. The exception is 2014, and that's the year in which GM had to radically increase its accruals to fund the costs of the ignition key recall.
In 2015, GM cut its accruals by an astonishing $2.1 billion, easily eclipsing the changes by all other automotive OEMs. Ford reduced its accruals by $62 million. Polaris increased its accruals by $12 million. And Tesla increased its accruals by $6 million.
On the truck and heavy equipment side, Caterpillar reduced its accruals by $328 million. Navistar and Paccar each made a $112 million reduction. AGCO cut its accruals by $62 million. Deere, however, raised its accruals by $13 million. Overall, the large vehicle makers cut their accruals by 17%, but GM helped the small vehicle makers achieve a 28% accrual reduction in 2015.
Warranty Expense Rates
It's one thing to raise and lower your claims and accrual totals from one year to the next. It's something entirely different to do so in response to changes in product sales volumes. Normally, the situation suggested in Figure 2 should prevail: absent a major change in repair cost or frequency, or a major change in sales volumes, the level of accruals should remain about the same from one year to the next.
Clearly, the downturn in accruals in 2009 and 2010 was a response to the recession. And the jump seen in 2014 was driven by a spike in recalls. But from 2011 to 2015 the industry's total accruals remained close to $10 billion.
If we take the amount of accruals and divide it by sales, the percentage rate reflects the proportion of sales going towards paying for warranty costs. We can do the same with claims and sales to calculate the claims rate. In Figure 3, using quarterly data from 2003 to 2015, we have calculated the average claims and accrual rates for the entire group of passenger car and small vehicle makers.
Figure 3
Passenger Car & Small Vehicle Makers
Average Warranty Claims & Accrual Rates
(as a % of product sales, 2003-2015)
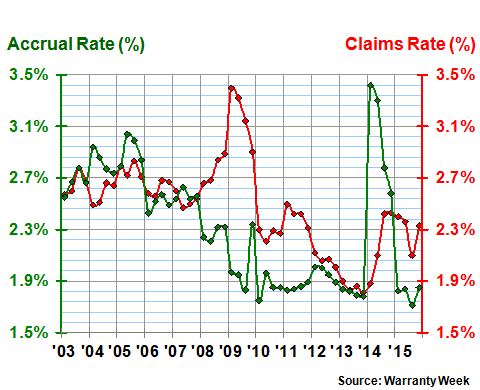
This shows the impact of the recession and the recalls even more clearly. The 2009 spike in the red line is caused not so much by a jump in claims as it is by a decline in sales. That's what happened in the recession: sales fell dramatically but claims fell less dramatically. And then the 2014 jump in the green line is caused by the recalls: accruals were boosted above their normal rate to prepare for the expected jump in claims payments.
Besides those spikes, notice that from 2003 to 2008 the expense rates were generally in the 2.5% to 3.1% range. From 2010 to 2015 they've generally been in the 1.7% to 2.5% range. That's a dramatic change in an industry where warranty costs arise at rates in excess of $1 million an hour. For an even better look at the impact of lower rates on the manufacturers, take a peek at Figures 6 & 7 in the February 25 newsletter. Savings of $200 per vehicle times millions of units equals billions in warranty cost reductions.
Truck Expense Rates
In Figure 4, the truck and heavy equipment manufacturers saw the same recession-related spike in claims in 2009, but the impact of recalls wasn't as dramatic in recent years. Yes, Navistar hit a rough patch, but many of the others did not, so the industry's average expense rates stayed in the 2.0% to 2.3% range.
Figure 4
Heavy Truck & Large Vehicle Makers
Average Warranty Claims & Accrual Rates
(as a % of product sales, 2003-2015)
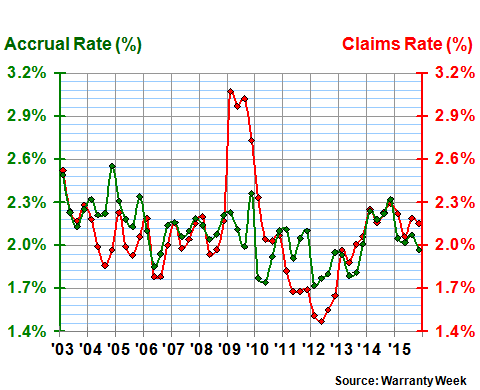
Notice that while the average accrual rate of the small vehicle manufacturers hit a new low of 1.7% in the summer of 2015, the large vehicle manufacturers set their record lows back in 2012. And while the expense rates of the small vehicle manufacturers were generally lower in 2010-15 than in 2003-08, the large vehicle makers have generally been about the same for most of the past 13 years (except for 2009 and 2012). In other words, the small vehicle makers are improving their warranty expense rate status while the large vehicle makers are about the same.
GM and Navistar featured prominently on our top 10 accrual reduction list in the March 17 newsletter, while Tesla, Thor Industries and Caterpillar just missed out, each with accrual rate reductions of 15% to 20%. Oshkosh did make it in, but for an accrual rate increase, not a reduction. Outside of the top 100 warranty providers, Arctic Cat cut its accrual rate from 3.8% to 2.3%, and cut its accrual total in half to $12 million.
Warranty Reserve Totals
In terms of warranty reserve fund balances, the entire industry's total slipped by 6% to $18.9 billion by the end of 2015. Once again, the passenger car and small vehicle makers accounted for three-quarters of the overall total. But the contraction was more evenly split, with $534 million coming out of the small vehicle total and $724 million coming out of the large vehicle total.
Figure 5
Automotive OEM Warranties
Reserves Held Worldwide by U.S.-based Manufacturers
(in US$ millions, 2003-2015)
GM and Ford reduced their reserves by $367 million and $228 million, respectively. But because of the sheer size of their warranty reserve funds to begin with, those were only 4% and 5% reductions. More significant was the $203 million reduction by Navistar (-17%), or the $54 million reduction by AGCO (-19%), or even the $12 million reduction by Terex (-14%).
And then there were also some big increases. Tesla led the league with a $52 million increase, equivalent to a 40% rise. Thor Industries added $10 million to its reserves, a little over 10% of its starting balance. Winnebago added $2.5 million, but that was a 27% gain for the RV maker.
Warranty Reserve Capacity
There's another way to measure reserves, though. Rather than a dollar amount, the balance can be expressed as a capacity to pay claims. In other words, if a company is paying claims at a rate of a million a month and it has a $12 million balance in its reserve fund, its capacity to pay is equal to 12 months of claims. If claims suddenly drop to $500,000 a month, the capacity would rise to 24 months. If claims jumped to $2 million a month, capacity would fall to only six months.
Theoretically, if companies are accruing exactly enough to pay the cost of warranty at the time a product is sold, then the capacity of the reserve fund should be equal to the typical length of their warranties. So if the warranties are one year long, and claims are being paid at a rate of $1 million a month, then a $12 million warranty would be exactly sufficient.
For Figure 6, what we've done is to divide the warranty reserve balance by the monthly claims-paying rate, to arrive at a capacity in months. And we've plotted that against the corresponding accrual rate, for each of the 52 quarters of the past 13 years.
So there are 104 data points on this chart -- 52 for the cars and 52 for the trucks. Many are virtually on top of each other so there are numerous clusters. The thick black lines represent the latest average for all manufacturers: 1.3% accrual rate and 19 months warranty reserve capacity. All data points to the right of that intersection have above-average accrual rates. And all data points above that intersection have above-average warranty reserve capacities.
Those two outlying points in the upper right corner turn out to represent the first and second quarters of 2014, when GM was racing to fund the ignition key recall effort. Accruals soared, and reserves soared, in ways that are also visible in the charts of Figures 2, 3 and 5. This chart shows just how unusual that was, compared to all the data points before and after that half-year.
Figure 6
Warranty Reserves vs. Accruals
Large vs. Small Vehicle Manufacturers
(in months of claims & % of sales, 2003-2015)
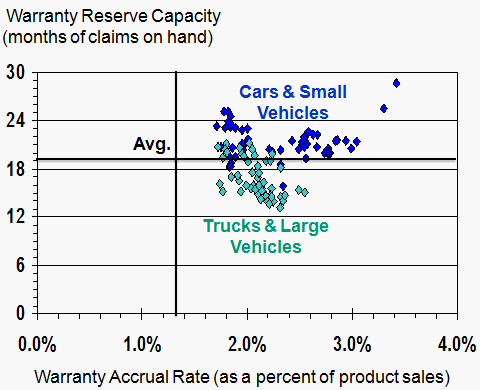
Notice that almost every one of the passenger car data points is above average for both metrics, meaning that passenger car manufacturers typically accrue at above-average rates, and maintain above-average reserve balances. However, most of the truck data points are below the average for reserve capacity, meaning they keep a leaner balance than is typical, even though their accrual rates are comparable.
Some of the individual manufacturers have chosen to keep their reserve capacity far above or far below the industry average. For instance, when Tesla let its warranty reserve balance rise to $181 million at the end of 2015, it was eq ual to 259 times its monthly claims cost. Navistar is at 41 months. Toro was up to 38 months in early 2015. Arctic Cat got up to 30 months later in the year.
At the other extreme, some of these OEMs run very lean operations. Polaris ended the year at 9 months. Harley was at 8 months. Astec Industries was as low as 8 months before bringing its capacity up to 10 months by year's end. Terex and Thor were both at 12 months.
Nobody's going out of business, but imagine if someone did. If they're issuing two- or three-year warranties, they're not going to have enough in their reserve funds to pay off all those claims until the last warranty expires. Or to put it another way, they're not accruing the full cost of warranties at the time a product is sold.
Or to put it more realistically, they're using favorable assumptions when they set their accrual rates, which turn out to be too optimistic, making unscheduled additions necessary in the future. And the truck manufacturers are more optimistic than the car manufacturers, and they've been that way for most of the past 13 years.


