


Telecom Equipment Warranty Report:
Is most of the warranty cost reduction now behind them? Several parts of the industry, such as the Internet and data communications equipment makers, have seen their expense rates climb a bit in recent years. Others are letting their reserves run low, or cutting their accrual rates even as their claims payments increase.
There is not much progress to report in the telecommunications equipment warranty sector. Most of the declines in expenses come from production shifting overseas. Only a few of the big names are left, and their cost-cutting days seem to be behind them.
To tabulate this week's results, we first started with a list of 205 U.S.-based companies manufacturing telecommunications equipment and reporting their warranty expenses in their financial statements. We then broke the list into four smaller groups:
- Internet/Datacomm/LAN Equipment (65 companies)
- Telephone/Mobile Phone Equipment (59 companies)
- Broadcast/Cable TV Equipment (48 companies)
- Satellite/Microwave Equipment (33 companies)
Each telecom equipment company was placed into one and only one of the smaller groups, even if they could have qualified for two or more. In those cases, the group that accounted for the largest share of their revenue was chosen.
The Datacomm Group was led by companies such as Cisco Systems Inc.; Netgear Inc.; Juniper Networks Inc.; and Extreme Networks Inc.; and in past years by 3Com Corp. (which HP acquired). The Phone Group was led by companies such as Ciena Corp.; Valmont Industries Inc.; and Plantronics Inc.; and in past years, by a myriad of other telco suppliers that are now departed.
The TV Group was led by companies such as Arris International; SPX Corp.; Infinera Corp.; Polycom Inc.; and until recently, by Broadcom Corp. (which was acquired a few months ago by Avago Technologies). And the Satellite and Microwave Group was led by companies such as Garmin Ltd.; ViaSat Inc.; Iridium Communications Inc.; Orbcomm Inc.; and Harris Corp.
Warranty Metrics
We then gathered four essential metrics for each of the 205 companies over the past 13 years: the amount of claims paid, the amount of accruals made, the amount of warranty reserves held, and the amount of products sold. The last metric excluded all service and finance revenue, and other non-warranted revenue sources.
Although comparable in terms of the number of members, the four groups were by no means the same in terms of totals or averages. In Figure 1, it's evident that while the warranty claims payments of the Datacomm Group continue to grow, the totals for the other three groups have virtually collapsed. From 2012 to 2015, only the TV Group was large enough to allow us to get a label in there.
Figure 1
Telecom Equipment Warranties
Claims Paid by U.S.-based Companies
(in US$ millions, 2003-2015)
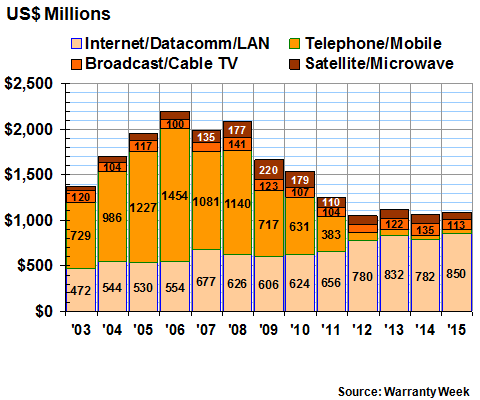
The Phone Group, meanwhile, went from spending well over a billion dollars on warranty claims in each of the years from 2005 to 2008, to only $45 million in 2015. That's because of two trends: first, during and after the recession, many of the top manufacturers went out of business or were acquired (Motorola, Lucent, Avaya, Nortel, etc.), and second, as the phone business shifted from landline to mobile, equipment manufacturing shifted to Asia and Europe.
We should possibly count Apple Inc. as a phone manufacturer because of the iPhone, but first that would skew the categories in the other direction. And second, we'd still be missing data from Samsung, Nokia/Microsoft, LKG, Lenovo, and Sony, so it wouldn't be an accurate measurement of the mobile phone handset industry. And third, that would mix a consumer market (smartphones) with these decidedly commercial telecom markets (switches, routers, multiplexers, transmitters, etc.). Readers' thoughts would be appreciated on this issue.
Among the largest manufacturers that are included, Cisco, Infinera, and Arris International saw their claims totals rise by 10% or more in 2015. Netgear, Harris, and Juniper saw slight increases, and Garmin and Polycom saw slight decreases. Ciena, SPX Corp., and Valmont Industries Inc. cut their claims cost significantly.
Warranty Accruals
The same kind of collapse is visible in Figure 2, which tracks 13 years of warranty accruals. Once again, all the market departures have caused the Phone Group to fall from well over a billion dollars to too-small-to-label. However, with this metric, now the TV Group has also slipped below $100 million. So the only group that makes a large amount of accruals in Datacomm, and that's dominated by Cisco, Netgear, and Juniper Networks.
Figure 2
Telecom Equipment Warranties
Accruals Made by U.S.-based Companies
(in US$ millions, 2003-2015)
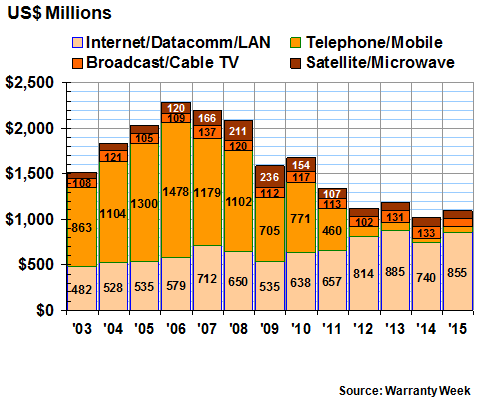
There are two companies that saw their accruals soar, however. Valmont Industries, which makes utility poles and towers, had to record a $17 million accrual in the fourth quarter of 2015 for what it said was "a commercial settlement with a large customer that requires ongoing quality monitoring." That more than doubled its 2015 accrual total, compared to 2014. And Infinera, which makes optical networking equipment for cable TV operators, had to increase its accruals by more than a third -- but for a very good reason: product sales were up by 34%.
There were also a few accrual reductions worth mentioning. Polycom, Arris International, and SPX each cut their accruals by a quarter or more. Unfortunately, all three also saw sales fall. Ciena cut its accruals by $4.2 million while its sales rose by 8%. The result is a somewhat lower accrual rate: 0.9% in 2015 versus 1.2% in 2014.
Warranty Expense Rates
Product sales put the rise and fall of claims and accrual totals into perspective. When a company such as Valmont has to increase accruals but sales fall, the accrual rate, which is calculated by dividing the expense by revenue, soars. In Valmont's case, it rose from 0.4% at the end of 2014 to 1.1% at the end of 2015. The opposite happened for Ciena: sales rose and accruals fell. And when a company such as Infinera increases accruals but sales rise even faster, the accrual rate can still decline.
The dollar amounts don't matter as much as the proportion they represent of sales. In fact, the accrual rate should remain constant unless there's been a change in the product mix, repair costs, or frequency of failures. In other words, if the accrual rate was one percent last year, it should be one percent this year as well.
The claims rate, meanwhile, rises and falls not only because of changes in product quality, but also because a product is a hit or the economy goes into recession. Infinera, for instance, saw its claims payments soar, but its products are selling well, so its claims rate hardly changed. Ciena's claims payments dropped by $2.2 million buy sales rose, so its claims rate fell from 1.2% to 1.0%.
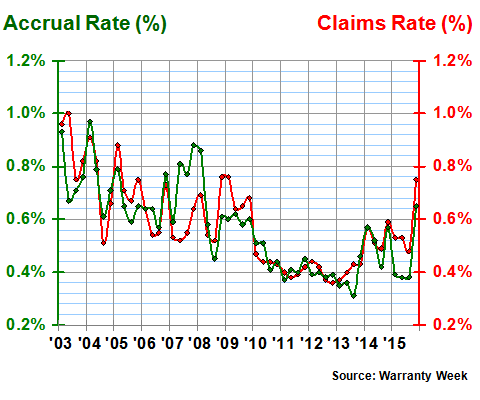
In Figures 3 through 6, we're talking the claims and accrual totals from Figures 1 and 2 and dividing them by product sales, to calculate the rates of spending. Notice that the Datacomm Group dramatically cut its warranty expense rates from 2003 until 2011, then let them creep back up from 2012 to 2015. In this respect, the group is following a wider trend seen in other industries, which are also seeing their warranty expense rates drift higher in recent years.
Meanwhile, the dip we observed at the end of 2014, which we also remarked upon in last year's Telecom Equipment Warranty Report, turned out to be a short-lived anomaly, rather than the beginning of a new downward trend. The Datacomm Group's claims and accrual rates fell to 1.4%-1.5% in the fourth quarter of 2014, but were right back up to 1.5%-1.8% in the first quarter of 2015.
Figure 3
Internet/Datacomm/LAN Equipment
Average Warranty Claims & Accrual Rates
(as a % of product sales, 2003-2015)
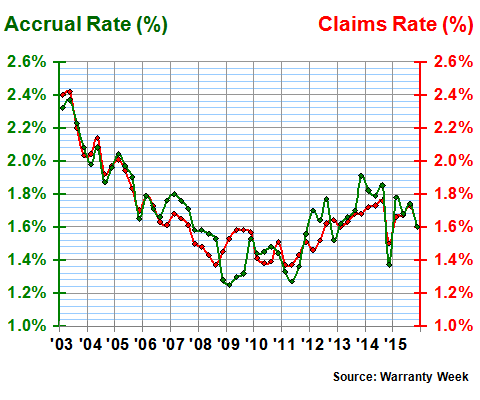
Cisco, Netgear, and Extreme Networks are among those seeing their expense rates rise. Netgear, for instance, let its accrual rate rise from 4.5% at the end of 2014 to 6.2% at the end of 2015. Extreme Networks let its accrual rate rise from 1.5% to 2.8% during the same time span. However, it's not as bad as it was at the end of 2013, when this group's accrual rate hit a recent high of 1.9%.
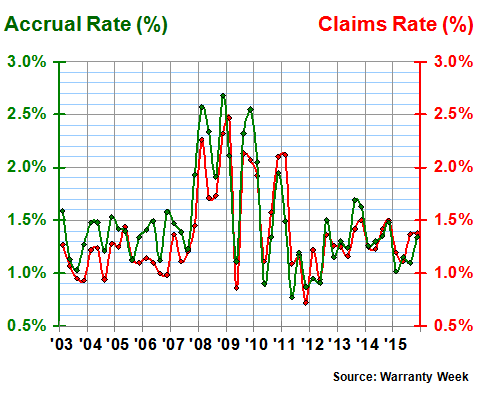
The Phone Group has also seen its expense rates rise in the last few years. At the end of 2013 the average claims and accrual rate for this group was 0.3%. Now it's 0.7% for the claims rate and 0.9% for the accrual rate. As was mentioned, Valmont is the culprit, raising its accruals from $13 million in 2014 to $29 million in 2015, and letting its accrual rate rise from 0.4% to 1.1% in the process.
Figure 4
Telephone/Mobile Phone Equipment
Average Warranty Claims & Accrual Rates
(as a % of product sales, 2003-2015)
The TV Group saw an even more prominent jump in its warranty expense rates at the end of 2015. But with this group it's easier to spread the blame around. All four of the leading warranty providers in this group saw their claims rates rise at the end of 2015, though further down the list there were some claims rate reductions by Viavi Solutions Inc.; Avid Technology Inc.; Checkpoint Systems Inc.; and CalAmp Corp.
Figure 5
Broadcast/Cable TV Equipment
Average Warranty Claims & Accrual Rates
(as a % of product sales, 2003-2015)
The satellite and microwave equipment companies, meanwhile, remained about the same in 2015, with their warranty expense rates still mostly in a range between 1.0% and 1.5%. Among the largest warranty providers there were lots of contradictions. ViaSat saw its claims rate soar while its accrual rate plummeted. Garmin saw a modest drop in its claims rate but raised its accrual rate slightly. Harris and CPI International Holding Corp. saw modest increases in both their expense rates.
Figure 6
Satellite/Microwave Equipment
Average Warranty Claims & Accrual Rates
(as a % of product sales, 2003-2015)
The net effect of these individual shifts is minor upon the entire telecom equipment industry. Expense rates remain around 1.3% to 1.4%, where they've been for most of the past seven years. But that's significantly below the 1.6% to 1.8% range the expense rates were in for most of the 2003-to-2006 period.
Warranty Reserves
The total amount of funds kept in the warranty reserves of these telecom equipment manufacturers has also been declining for most of the past decade. But that's due mainly to companies such as 3Com, Motorola, and Lucent getting acquired and taking their reserves with them, either to companies in other industries, to companies that don't report their warranty expenses, or to companies based in other countries. In other words, the money is still out there somewhere, but it's no longer being counted here.
Figure 7
Telecom Equipment Warranties
Reserves Held by U.S.-based Companies
(in US$ millions, 2003-2015)

The total reserves held by those remaining at the end of 2015 slipped under the $1 billion mark for the first time ever. From 2003 to 2005 it was more than twice as much. As recently as 2011 it was still above $1.5 billion. But as was mentioned, it's got more to do with the attrition caused by acquisitions than it does with individual companies keeping less in their warranty reserve funds.
Cisco still has the largest warranty reserve in the industry, even though it let its balance decline a bit last year. Netgear has the second-largest, but only because its balance rose by $12 million last year. Ciena remains in third, and has kept its warranty reserve balance relatively unchanged for the past four years. Meanwhile, Arris International used to have the second-largest reserve in 2014, but it fell to fourth place in 2015 after taking out $25 million from the fund.
Warranty Reserve Capacity
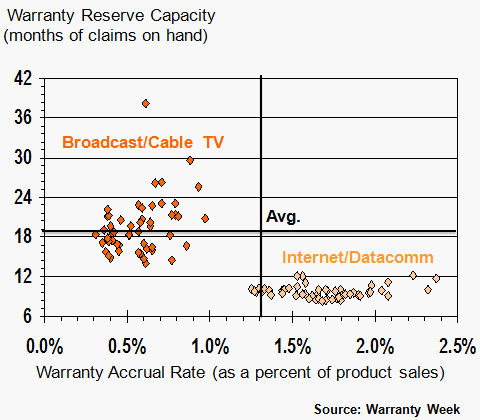
But again, as with the claims and accrual totals detailed in Figures 1 and 2, the raw numbers don't tell the full story. And so, in Figures 8 and 9, we're taking the warranty reserve totals from Figure 7 and dividing them by the amount each company is paying per month in claims, to measure each company's capacity to pay claims. Therefore, if a company has a reserve of $40 million and is paying $4 million per month in claims, its capacity is 10 months. If the balance rises to $50 million and the claims-per-month total falls to $2 million, the capacity would shoot up to 25 months.
What we found by trial and error was that two of these four groups are very consistent, and two are highly scattered. In the chart below, we've included the two consistent groups: TV and Datacomm. And in Figure 9, we've included the two inconsistent groups: Satellite and Phone.
In each chart, we've also included lines that represent the averages for all manufacturers in all industries. At the end of 2015, all manufacturers set aside an average of 1.3% of their product revenue as warranty accruals. And their average reserve capacity was 19 months, meaning they had enough in their warranty reserve funds to continue to pay claims for just over a year and a half.
In Figure 8, we can see that the Internet and datacomm equipment manufacturers are very consistent about keeping a balance equal to 8 to 12 months of claims. This is significantly below the all-industry average. In fact, it's very similar to the range seen with the computer OEMs in the April 21 newsletter.
Meanwhile, the TV Group is more variable, keeping 12 to 18 months of reserves in some periods and 18 to 24 months of reserves in others. In fact, in the middle of 2004, when their expenses temporarily dropped, the ratio went as high as 38 months. And a few times, it's dropped below 15 months. But most of the time it's been between 15 and 24 months.
Figure 8
Warranty Reserves vs. Accruals
Internet/Datacomm vs. Broadcast/Cable TV Equipment
(in months of claims & % of sales, 2003-2015)
Compare and contrast this with the widely dispersed data points in Figure 9. They're all over the place. Companies in these two groups have seen their accrual rates rise above 2.5% and fall below 0.5%. And they've seen their reserve capacities rise as high as 39 months and fall as low as 9 months. However, there is a good cluster around 1.5% and 16 months.
Figure 9
Warranty Reserves vs. Accruals
Telephone/Mobile vs. Satellite/Microwave Equipment
(in months of claims & % of sales, 2003-2015)
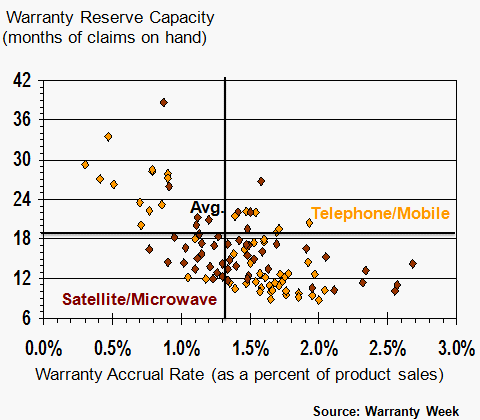
For these two groups, then, the typical company has a slightly above-average accrual rate and a slightly below average reserve capacity. Although there's not a perfect correlation between the average length of warranties and reserve capacity, the data here suggests warranties lasting for one to two years are typical.
However, there is a lot of variance among the individual companies. And that's why we say there's not a perfect correlation. There are companies that like to live dangerously, keeping just enough money in their warranty reserve funds to get by. These companies include Cisco, Garmin, Netgear, and Polycom, which each ended 2015 with the equivalent of less than 10 months of claims in their reserve fund, despite issuing warranties that last one to three years.
A Thicker Cushion?
Then there are the conservative companies that like to keep upwards of two years' worth of claims in their reserve funds. These companies include Ciena, Harris, Infinera, Valmont, and ViaSat, whose reserve capacities range from 24 to 31 months.
And then there is the group in the middle, that are keeping their reserve capacities close to the telecom industry average, in a range of one to two years. These companies include Arris, Extreme Networks, Juniper Networks, and SPX.
In 2015, however, some of these companies let their reserve capacities rise or fall significantly. For instance, SPX rose to 30 months, and ViaSat fell to 16 months. For SPX, the cause seems to be a slow reaction to falling expense rates, where no-longer-needed reserves are left to hang around too long. For ViaSat, the cause seems to be aggressive accrual rate reductions that aren't yet being confirmed by lower claims rates. But in time, hopefully, they will be, and the company will return to that 24-month baseline.


