Fifteenth Annual Product Warranty Report:
All the metrics are down this year, including product sales. Some companies continue to cut their warranty expenses by huge amounts, producing better products with lower failure rates. But others are getting better at shifting more of their warranty expenses back onto their suppliers.
Warranty expenses took a big drop last year, but it's not entirely clear if that was a good outcome for U.S.-based manufacturers. Some of the decline was attributable to better products and higher quality. But some was due to acquisitions by foreign firms, many of which don't report their warranty expenses publicly.
Every year since 2003, Warranty Week has collected four essential warranty metrics from every U.S.-based manufacturer that reports them: the amount of claims paid, the amount of accruals made, the amount of warranty reserves held, and the amount of product sales revenue. For select industries such as new homes and passenger cars, we also collect data on units sold. And then we divide some of these metrics by others, to calculate percentages and costs per unit.
In the charts below, Figure 1 is the sum of the claims paid, Figure 2 is the sum of the accruals made, and Figure 3 is the sum of the reserves held. Figure 4, meanwhile, is comprised of a pair of percentage ratios: claims divided by sales (the claims rate), and accruals divided by sales (the accrual rate).
Traditionally, manufacturers do their best to predict how much a given product's warranty will cost, and then they set aside that amount as a warranty accrual when the product is sold. The money is deposited into a warranty reserve fund, from which funds are withdrawn as claims are paid. Since 2003, manufacturers that provide warranties have been required to report the amount of deposits and withdrawals, as well as the beginning and ending balances for the fund for each of the periods for which they file a financial report.
Warranty Claims Totals
In Figure 1, we've added together the claims payments for hundreds of U.S.-based manufacturers for each of the past 15 years. These figures represent the worldwide net cost of their warranties, after all the claims are paid and all the reimbursements are received from suppliers. In 2017, the worldwide total for claims paid by U.S.-based manufacturers was $24.7 billion, a decline of $1.7 billion, or about 6%, from 2016 levels.
Figure 1
Worldwide Warranty Claims
of U.S.-based Companies
(claims paid in US$ billions, 2003-2017)
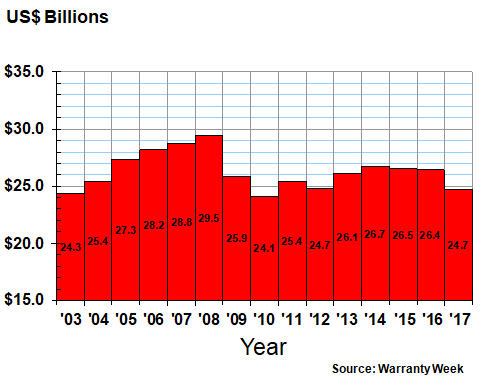
It wasn't the largest annual decline of the past 15 years. In fact, it was only the third-largest, after the recession-driven declines of 2008-09 and 2009-2010. But it was the largest decline in a year in which the drop was not recession-driven, which means we need another excuse. Was it better products? Was it acquisition-related? Or was there yet another reason?
Readers should note that the totals and percentages in these charts are constantly shifting as new information becomes available. Sometimes, new companies go public, and reveal their warranty expenses for the past three years. Other times, companies that didn't previously segment their revenue by type suddenly begin dividing it into products and services, or they begin segmenting their product revenue into hardware and consumables.
Likewise, companies frequently leave the charts, because of acquisitions, bankruptcies, or decisions to go private. In some cases, companies simply decide to stop following accounting rules, so they cease the practice of including their warranty expenses in their financial statements. With regulatory oversight being as weak as it is, nobody notices. What we do is to insert placeholding estimates for a year or two to see if the disclosures resume, and if they don't, to delete the estimates and move them to the non-GAAP list of companies.
We also do the same for companies that run into any sort of financial trouble, which prevents them from filing their financial reports on time. Sometimes, a company goes bankrupt and stops reporting for an extended period of time. But then the new owners resume financial reports, and provide us with three years of hard data in the process. However, all these placeholding estimates currently comprise far less than one percent of the totals in these charts. So the totals won't change by much.
Also, while March 1 is the cutoff for most companies to file annual reports with the U.S. Securities and Exchange Commission for the year ended December 31, some companies miss the deadline. Other companies are on fiscal years that end on October 31, or September 30, or June 30. What we do is to map their financial reports to the calendar quarter into which they fall, so a fiscal year that ends in October would be mapped to the fourth quarter.
We don't think the declines are caused by all the place-saving estimates that will turn out to be too low when the actual numbers come in. We checked, and the total size of all the estimates as we go to press tonight is only about $27 million for claims and accruals, and only $136 million for warranty reserves. That means more than 99% of each metric's total consists of hard numbers, while well under 1% consists of estimates. So we need to find another excuse.
Warranty Accrual Totals
Warranty accrual totals fell by about 4% in 2017, which was more or less proportional with the decline in sales. In other words, since sales and accruals are falling proportionately, the percentage ratio between them has remained about the same. And that means there hasn't been much of a decline in failure rates or repair costs, nor much of a boost in product quality or reliability.
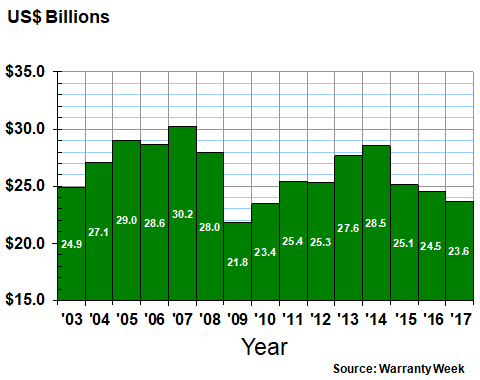
In 2017, U.S.-based manufacturers set aside $23.6 billion in warranty accruals, a decline of $895 million from 2016 levels. It was the third year in a row that accrual have fallen, though in dollar terms it was in fourth place behind the 2008-09, 2007-08, and 2014-15 declines.
Figure 2
Worldwide Warranty Accruals
of U.S.-based Companies
(accruals made in US$ billions, 2003-2017)
Accruals decline for all sorts of reasons. And as we detailed in Figure 3 in last week's newsletter, sometimes they decline in a spectacular fashion. Apple made that top 10 list for its $601 million decline in accruals. Honeywell made it for a $111 million decline. But GM, because it routinely sets aside so much money to finance its product warranties, missed out on the top 10 despite a $733 million annual decline in its accruals.
Conversely, some of the annual increases in accrual totals were equally spectacular. Cummins Inc. boosted its accruals by $223 million. Caterpillar Inc. raised its accruals by $208 million, surpassing the $1 billion annual threshold for the fifth time. Deere & Co. and General Electric Co. came awfully close to that mark, adding $201 million and $194 million to their accrual totals.
Overall, however, accruals fell by $895 million last year. And that produced the lowest annual total since 2010, when sales were about $140 billion lower. So that's a bit of good news: in the past seven years, warranted product sales have risen about 8% while warranty accruals have remained the same. That means products sold last year were predicted to have slightly lower warranty costs than products sold in 2010. However, the difference is minimal: 1.3% of sales went to accruals in 2017 versus 1.4% in 2010.
Warranty Reserve Totals
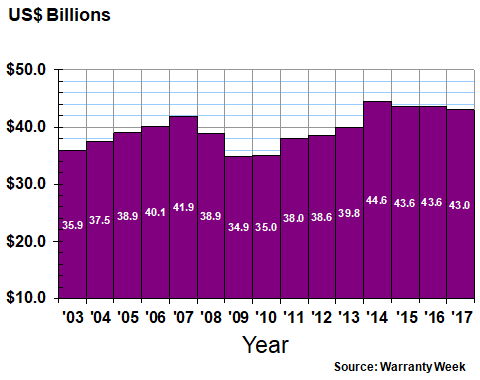
For the third year in a row, the ending balance held in the warranty reserve funds of all the U.S.-based manufacturers that report that metric fell in 2017. However, while the change from 2015 to 2016 was barely perceptible, the decline in 2017 was noticeable at $620 million.
Big increases in the building trades were more than offset by big declines in reserves held by the vehicle and electronics manufacturers. For instance, GE added $444 million to its warranty reserve fund, but GM cut its balance by $1.37 billion and Apple cut its balance by $375 million.
But even with recent the balance reductions, U.S.-based manufacturers continue to hold more reserves than they used to. As can be seen in Figure 3 below, the balance at the end of each of the last four years has been higher than the balance in any of the preceding 11 years.
Figure 3
Worldwide Warranty Reserves
of U.S.-based Companies
(reserves held in US$ billions, 2003-2017)
With a gross domestic product of some $19.36 trillion, the U.S. leads the world. However, only about $2 trillion, or a little over 10% of the total, comes from the manufacture of warranted products. But remember, not all manufactured products carry warranties. Most food, apparel, pharmaceuticals, fuels, and basic materials do not carry product warranties, although various consumer protection laws do provide for implied warranties with those sales.
In other words, a filling station can't sell you what it calls gasoline and instead pump salt water into your tank. But while there would be claims and product liability lawsuits if such an unfortunate event were to occur, there would not be any warranty accruals, and there would be no warranty reserve fund maintained by the filling station or the gasoline brand they sell. A breach of warranty lawsuit does not always involve an express or written warranty.
Likewise, there is no legal requirement for manufacturers to use the accrual method to pay their warranty expenses. They could just as easily (and foolishly) satisfy all claims as they arise, pay as you go, with no financial cushion to protect them, and no visibility in terms of future trends. In such a case, there would not be any warranty accruals, there would be no warranty reserve fund, and no duty to report.
Fortunately, most warranty-providing manufacturers use the accrual method, and most of them report their warranty expenses publicly. But all U.S. companies that provide product warranties report just one set of warranty metrics, for all their products together, including both domestic and export sales. None report warranty expenses for specific products or divisions, although we have to assume that most compile this data for internal use. Likewise, some international companies, particularly car manufacturers based in Europe or Asia, also report their worldwide warranty expenses, but they do not report their U.S. production or U.S. imports separately. And, of course, they report their expenses in euro or yen or Swedish kronor, depending on the location of their home office.
Warranty As a Percentage of Sales
As was mentioned, the U.S. total for claims paid in 2017 was $24.7 billion, while the total for accruals made was $23.6 billion. And the year-ending balance in the reserve funds was $43.0 billion. Warranted product sales ended up landing at around $1.8 trillion last year.
However, that doesn't mean that food, apparel, fuel and other non-warranted manufactured products ended up accounting for the remaining $200 billion ($2.0 trillion in manufactured goods minus $1.8 trillion in warranted goods). To get to that number, first we'd have to figure out how many warranted products were exported by each of the U.S.-based companies, since each company is reporting its worldwide warranty expenses. And life is too short to make that possible.
Instead, what we're going to do is compare the claims total and the accrual total to the sales total. And because we've collected the data quarterly since 2003, we're going to measure the resulting pair of percentage rates 60 times rather than just once a year.
Figure 4 shows that from 2003 to roughly 2012, U.S. manufacturers did a remarkable job of cutting the percentage of sales consumed by warranty expenses. Except for that spike in the claims rate in 2009 (which had more to do with the recessionary drop in sales than any rise in claims). manufacturers reduced their warranty costs by roughly half a percentage point, from 1.8% in 2003 to under 1.3% in 2012. And when you're talking about $1.8 trillion in hardware sales, half a percentage point is $9 billion in savings.
Since 2012, the trend has become somewhat harder to follow. Claims and accrual rates went up. They went down. And they ended 2017 just about right back where they were five years ago: 1.3%. A decade of progress has been followed by five years with no clear direction. While the most common chart shape in the warranty industry is the bathtub curve, this one looks more like a ski slope with a lot of trees in the way.
Figure 4
All U.S.-based Companies
Average Warranty Claims & Accrual Rates
(as a % of product sales, 2003-2017)
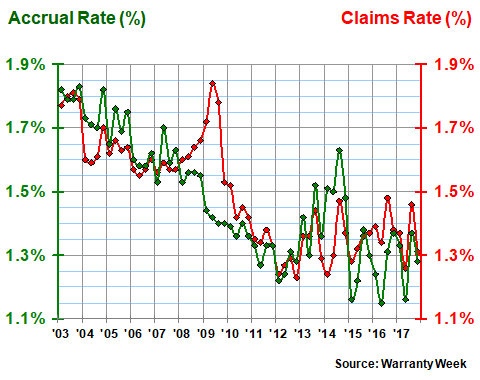
The claims rate, as was mentioned, is likely to be more volatile than the accrual rate, because of the lag time between when a product is sold and when it needs warranty work. In contrast, the accrual rate should remain the same because accruals are made at the time of sale, and shouldn't be changed unless a rise or fall in warranty costs is forecast. So while the 2009 spike in claims can be quickly dismissed as a recession by-product, the nearly constant ten-year decline in the accrual rate from 2003 to 2012 is evidence of a gain in product reliability and/or a decline in repair cost.
Likewise, the ups and downs for both metrics since 2012 is evidence that the decade-long decline in expense rates has ended. What comes next? Will the downward slope resume this year? Or is 1.3% as low as expense rates can go? As we will show in next week's newsletter, not every industry has a decade of cost-cutting behind it. So even if expense rates are as low as they can go among the leaders, there are still plenty of stragglers that have some room for improvement.
Industry Categories
Besides the financial metrics detailed in the figures above, we also collect information about each of the companies we track. For instance, we collect four-digit Standard Industrial Classifications for each, and we use these to help classify the company into one of 18 industry categories into which all warranty providers fit. With highly diversified companies, we have to make a guess as to which division or which product line generates the most warranty expense. But the goal is to assign all companies into one and only one industry category.
New to this year is the split between large vehicle OEMs and small vehicle OEMs. Where there was one category before, now there are two. As for which companies are in each, we'll detail that in a future newsletter. Suffice it to say for now that all the passenger cars, pickup trucks, SUVs, ATVs, golf carts, bicycles, and motorcycles are in the small category. All the trucks, buses, trains, recreational vehicles, and heavy equipment are in the large category. If a company makes both, their dominant product line determines their industry category.
We further divided the universe of warranty-reporting industries into one of three segments: vehicles, electronics, and building trades. In 2017, the vehicle manufacturers paid about 50% of the claims, the high-tech electronics manufacturers paid about 34%, and the building trades paid the remaining 16%. In years past, electronics has been higher and vehicles have been lower, but the building trades have always been between 15% and 17% of the total.
In Figure 5, it's clear that the manufacturers of cars and light trucks, namely General Motors and Ford, still dominate the warranty landscape. We detailed their warranty expenses in the March 8 newsletter, so we won't repeat it here. But their slice of the claims total contracted by $390 million in 2017, a 5% decline.
Figure 5
Worldwide Warranty Claims Payments
of U.S.-based Vehicle Makers
(claims paid in US$ millions, 2003-2017)
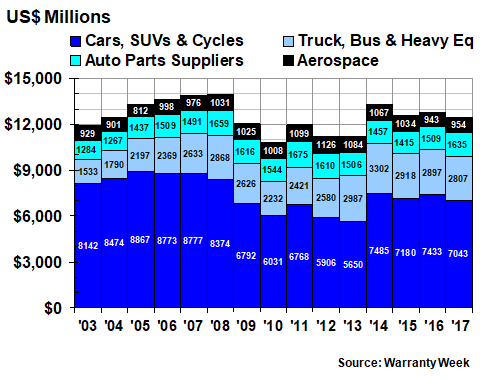
The truck manufacturers saw a smaller decline in claims payments last year: $90 million or 3% off their 2016 total. Meanwhile, their suppliers paid $127 million more, an 8% gain. And the civilian aerospace companies saw a just slight increase in their claims payments, after a big decline in 2016.
It's hard to make any general statements about this top-level data. But in the weeks ahead, we will take a closer look at the balance between the automotive OEMs and their suppliers when it comes to claims payments. All manufacturers report their net warranty expenses, meaning payments minus reimbursements. So when suppliers report a $127 million increase, that means the OEMs are enjoying a net $127 million decrease, because the suppliers are reimbursing the OEMs, while the OEMs are paying dealers and repair companies.
Therefore, while it's accurate to say the combined large and small vehicle OEMs reduced their collective claims payments by $480 million, part of the reason is the additional $127 million paid by their suppliers. In other words, the rate of supplier recovery is increasing, shifting more warranty costs from the OEMs to the suppliers.
High-Tech Electronics Claims
Computer warranties dominate the electronics segment, and Apple Inc. has come to dominate that industry, picking up the slack as Dell went private and Hewlett Packard went sideways. But Apple is getting its warranty costs under control, as we detailed in the November 9 newsletter. So it's no surprise that computer manufacturers saw their claims payments decline by 15% from 2016 to 2017.
And yes, we know that most of Apple's revenue now comes from smartphones rather than from personal computers. And if Samsung Electronics, Google, Microsoft, or Huawei Technologies reported their warranty expenses, we might be able to create an international smartphone warranty pie chart. But as of now, Apple would be the only warranty-reporting member of such a group, and the rest would be conjecture.
Some of the industry segments included in Figure 6 are too small to be labeled. But the consumer electronics manufacturers, or what's left of them after Harman International was acquired by Samsung Electronics, saw a 44% decline in reported claims payments. And the data storage companies, now that EMC, SanDisk, and several others have been acquired, saw a 32% drop in claims paid. In fact, the only industry category in the electronics sector to see an increase in claims payments last year was the semiconductor group.
Figure 6
Worldwide Warranty Claims Payments
of U.S.-based High-Tech Manufacturers
(claims paid in US$ millions, 2003-2017)
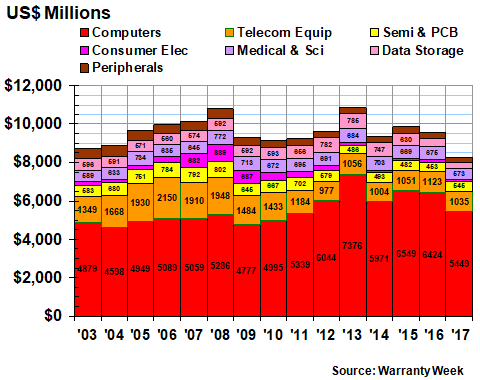
Overall, the high-tech electronics companies saw their claims total fall by nearly $1.3 billion in 2017, a 13% decline. In future newsletters, we will look deeper into the question of how much of that decline was caused by expense reduction, and how much was caused by acquisitions and company departures.
Claims Paid by the Building Trades
There are seven warranty-providing industry groups within the building trades sector, and once again, appliances, HVAC systems, and power-generating equipment dominates the chart. Collectively, their claims payment totals declined very slightly in 2017, with no clear trend. As was mentioned, their $4.0 billion claims total represented about 16% of the overall total for all warranty-providing U.S.-based manufacturers. That's up slightly from 15% in recent years.
Two of the seven building trade groups saw declines, including the largest: appliances and HVAC, which saw an 11% decline in claims payments last year. However, power generating equipment saw an 11% increase in claims payments, and homebuilders saw a 9% increase. As we will show in future weeks, increasing sales helps to mitigate the impact of these increases.
Figure 7
Worldwide Warranty Claims Payments
of U.S.-based Building Trade Companies
(claims paid in US$ millions, 2003-2017)
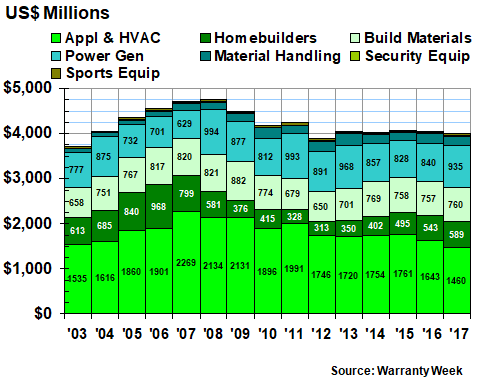
And then there are a few very small industry sectors that we used to lump together into the "other" category: material handling equipment, security systems, and sports equipment. Admittedly, we had to stretch a bit to include items such as watches and collectible coins into the latter category, but we think they fit better into sports than any other group.
Material handling, which includes everything from pumps and valves to oil and gas and mining equipment, is the largest of the three new groups that we track, but it too saw a decline in 2017, shedding $21 million in claims to reach $188 million. But much of that was due to the departure of Joy Global Inc. from the list, following its acquisition by Komatsu Ltd.
Next week, we're going to take each of the 18 industry categories and calculate a pair of expense rates for each, as was done in Figure 4 for all of them at once. And then in the weeks that follow, we will take a closer look at each of the 18 categories, looking not only at claims payments, but also accrual and reserve totals.