


Automotive Supplier Recovery:
While the OEMs are enjoying lower warranty expense rates, it's not all good news for their suppliers. While some of the cost reduction comes from OEMs manufacturing better products, some could be the result of increased reimbursements by suppliers. A few of the relevant warranty metrics hit new records in 2017, suggesting increasingly successful supplier recovery efforts.
Before we can take a guess as to how much supplier recovery is possible, we have to figure out how much is happening now. Sure, most automotive OEMs would love to recover 100% of the warranty expenses they think their suppliers have caused, but how much are they getting now? Are they getting half? Or is it a third? Surely somebody knows the answer.
In the April 5 newsletter we looked at the warranty expenses of the 24 U.S.-based manufacturers of cars, light trucks, motorcycles, golf carts, all-terrain vehicles, and other small vehicles, and the 26 U.S.-based manufacturers of heavy trucks, buses, recreational vehicles, construction equipment, farm equipment, and other large vehicles.
In the April 12 newsletter, we looked at the warranty metrics of the 24 manufacturers of car and truck powertrain components such as engines and transmissions, and the 96 manufacturers of other parts and components for cars, trucks, and other vehicles.
This week, we're going to bring those four pieces back together, and compare the warranty metrics of the 50 vehicle manufacturers against the 120 suppliers. The goal is to see whether the suppliers are sending more or less warranty expense reimbursements to the OEMs, by comparing each group's share of the overall total over time.
The theory is that the OEMs pay more and spend a higher share of sales on warranty expenses, because they are end user-facing companies, whose dealers are experts at getting their claims paid. In contrast, the suppliers pay less and spend a lower share of sales on warranty expenses, because of the inefficiencies built into the supplier recovery process. However, in the past decade the OEMs have gotten much better at extracting reimbursements from their suppliers.
In other words, the OEMs typically account for close to 90% of the automotive industry's total warranty expenses, and spend on average around 2.4% of their sales revenue on warranties, while the suppliers account for the remaining 10% and spend around 0.6% of their revenue on warranty reimbursements to those OEMs. But those averages have tilted in the OEMs' favor during the past decade, with the exception of a few quarters when massive recalls caused OEM expenses to spike.
Warranty Claims Ratio
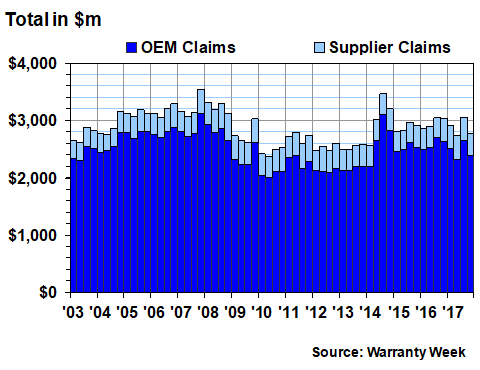
Let's start with warranty claims. In the April 5 newsletter we stated that the small vehicle makers spent $7.043 billion on claims last year, while the large vehicle makers spent $2.807 billion on claims. In the April 12 newsletter, we noted that powertrain suppliers spent $868 billion on claims while the other parts suppliers spent $768 million on claims. Add it all together and you have a U.S.-based automotive industry that paid $11.486 billion in claims during calendar 2017: $9.85 billion for the OEMs and $1.636 billion for the suppliers.
We have comparable warranty data going back to 2003. However, the data is compiled quarterly, so rather than just 15 annual measurements, we actually have 60 quarterly measurements. And as will become clear later on in this newsletter, more measurements make for a more accurate picture of the industry's warranty expense totals.
Therefore, in all these charts, we've reverted to a quarterly format. Therefore, in Figure 1, rather than listing the OEMs at $9.85 billion for the entire year, we're splitting their claims payments into four quarterly pieces: $2.51 billion, $2.32 billion, $2.65 billion, and $2.38 billion. And rather than listing the suppliers at $1.636 billion for the entire year, we're also splitting them up into four quarters: $408 million, $426 million, $407 million, and $394 million. Hopefully the math adds up.
We've done the same with the data from the previous 14 years as well, so that Figure 1 contains 60 pairs of measurements of the claims paid by the OEMs and suppliers since 2003. All the data is taken from each company's annual reports and quarterly financial statements.
Figure 1
Automotive Product Warranties
Claims Paid by U.S.-based Companies
(quarterly totals in US$ millions, 2003-2017)
All companies that report their warranty claims in their financial statements are doing so on a net basis: payments minus reimbursements. In other words, General Motors Co. reports the net amount of claims paid to its dealers, minus the amount of reimbursements it receives from its suppliers. And those suppliers report the amounts they pay to the OEMs, minus the amounts they receive from their suppliers.
The end result is that the U.S.-based automotive industry paid a net $11.486 billion in claims last year. Granted, that doesn't include everything. It doesn't include claims paid by companies such as Toyota and BMW that manufacture in the U.S. and in some cases even export from there. It doesn't include claims paid by European suppliers such as Autoliv and Robert Bosch that have significant U.S. operations as well. And it doesn't include companies such as engine manufacturer Kohler or chassis manufacturer Tower International, which are U.S.-based but are privately-held, and therefore don't report their warranty expenses publicly.
Worldwide Spending by US Companies
Also, the $11.486 figure is for claims paid worldwide by U.S.-based companies, so it includes claims from Australia, Asia, Europe, Africa, and South America as well as from Canada and Mexico. So it is not an isolated industry, and it's not the entire industry. It's simply the total for all 170 publicly-held U.S.-based automotive companies that report their worldwide warranty expenses.
But let's imagine that the $11.486 billion figure represents 100% of the claims paid by the U.S.-based automotive industry last year. That would mean the OEMs paid 86% of the total, while their suppliers paid the remaining 14%. Split into a quarterly format, the OEMs' share would range from 84% to 87%, while the suppliers would range between 13% and 16%.
Over the past 60 quarters, the OEMs' share has ranged all the way from 90% in 2004 to 83% in 2012, and the suppliers have ranged from 10% to 17%. In Figure 2, the jagged edges between the light and dark blue segments represent the changing ratio between the net claims payments of the OEMs and the suppliers.
Figure 2
Automotive Product Warranties
Claims Paid by U.S.-based Companies
(as a percent of the total, 2003-2017)
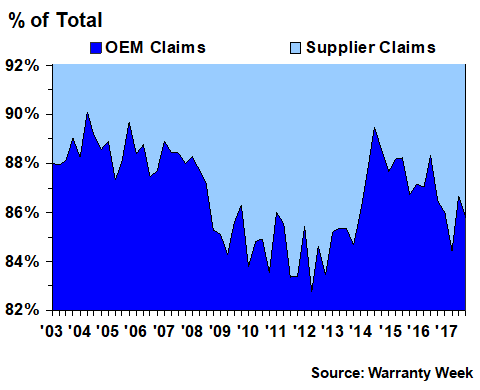
Notice how the OEM share was around 88% to 90% from 2003 to 2008, fell to an 83%-to-86% range from 2009 to 2013, then rose back in 2014 before falling back again. We think that tells a story: the OEMs increased their supplier recovery efforts dramatically during the recession, then in 2013 and 2014 major OEMs such as GM and Navistar became entangled in recalls and claims spikes, but once those subsided, increased supplier recovery efforts once again drove the ratio down. In the second quarter of 2017, the ratio was back down to 84%/16%, the lowest it's been since 2012.
Warranty Accrual Ratio
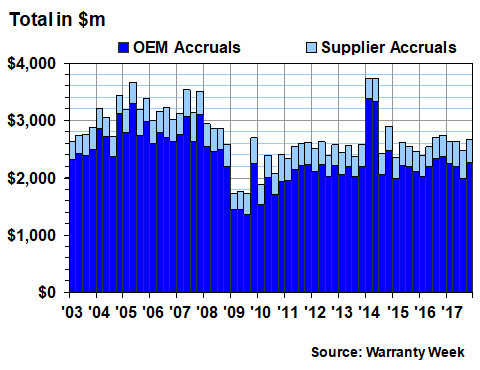
More or less the same trend is evident if we look at warranty accruals. In Figure 3, we've chopped the accrual data for the 2003-17 period into 60 quarters. This serves to highlight the 2014 ignition switch recall expenses of GM, and also more sharply draws the depths of the recession in 2009. However, also note that except for those anomalies, the quarterly totals for automotive warranty accruals have been remarkably stable: close to $2.6 billion per quarter for most of the past seven years.
Figure 3
Automotive Product Warranties
Accruals Made by U.S.-based Companies
(quarterly totals in US$ millions, 2003-2017)
That stability in the industry total makes the changing percentage even more important. In Figure 4, we can clearly see the 2014 spike caused by GM and other OEMs. Except for that spike, however, the ratio between OEM and supplier accruals has remained relatively stable from 84%/16% to 86%/14% from mid-2011 to early 2017. Then something changed, and the ratio plunged to 80%/20% in the second quarter of 2017.
Figure 4
Automotive Product Warranties
Accruals Made by U.S.-based Companies
(as a percent of the total, 2003-2017)
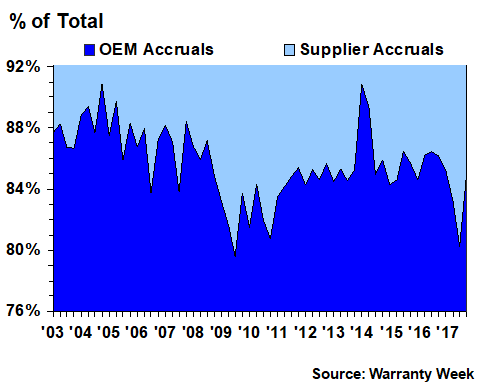
The only time the ratio has been lower was in 2009, when the OEM share of industry accruals briefly dipped below 80%. But that was during the recession, when they were selling far fewer vehicles. And since accruals are usually proportional to sales, their accruals hit a low of $1.367 billion during that same quarter.
But while we can explain away the 2009 low, we can't easily explain this 2017 low. The ratio recovered to 85%/15% by year's end, so perhaps it was just one of those anomalies that can't be explained. Or perhaps it was a sign that supplier recovery efforts are once again going to push the ratio lower?
Warranty Expense Rates
There's another way to look at the gap between the warranty expenses of the OEMs and their suppliers. If we take the data in Figures 1 and 3 and divide them by corresponding revenue totals, we can calculate claims as a percentage of sales and accruals as a percentage of sales. And if we plot both pairs of expense rates on a single chart, we can measure the gap between them, as is done in Figure 5.
Figure 5
Automotive Product Warranties
Average Warranty Claims & Accrual Rates
(as a % of product sales, 2003-2017)

Once again, we see the effects of the 2009 recession, in this case causing the OEM claims rate to spike (because sales fell precipitously). And we see the 2014 spike in the OEM accrual rate, caused primarily by GM's ignition switch trouble. But we also see that the supplier claims and accrual rates have been trending up lately. For a better view of this trend, see Figures 3 and 4 in the April 12 newsletter.
Long term, the OEMs have seen their claims rate average 2.4%, with an 0.3% standard deviation. Their accrual rate has averaged 2.2%, with a standard deviation of 0.4% (the difference is filled by periodic changes of estimate and other adjustments).
The suppliers have averaged a claims and accrual rate of 0.6% over the past 60 quarters, with a standard deviation of 0.08 for claims and 0.07% for accruals. The gap between the two pair of rates has averaged 1.7% since 2003.
But notice how the gap is closing. For instance, in the third quarter of 2017, the gap between the OEM accrual rate and the supplier accrual rate fell to 1.0%. It's never been narrower. In fact, in normal times it's been as wide as 2.2%, though during the OEM spikes it briefly reached above 2.5%. But it hasn't been close to one percent since 2010, which also happens to be the low water mark for the OEM accrual rate.
Furthermore, the recent rise in supplier warranty expenses, while they look to be modest in Figure 5, are proportionally quite large. For instance, from 2009 to 2016, suppliers averaged accruals of $375 million per quarter. But in 2017, they averaged $430 million in accruals per quarter -- a 15% increase. And while an 0.1% rise in expense rates is next to nothing for most OEMs, proportionally it could be a 20% increase for some of these suppliers. That's one reason that Aptiv, Cummins, Eaton, and Visteon were among the suppliers that made it onto the top 10 lists in the March 15 newsletter this year.
Warranty Reserve Ratio
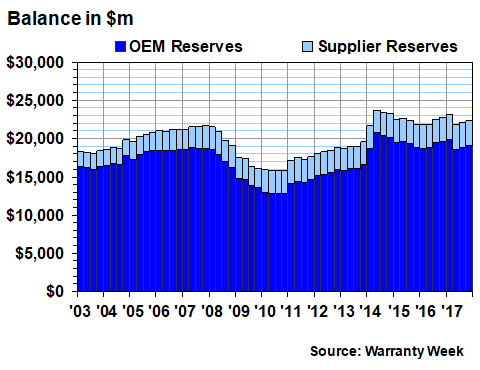
While claims and accruals can change quickly from one quarter to the next, the combined balances in the warranty reserve funds of the automotive OEMs and suppliers has remained more stable. That trend is clear in Figure 6, which adds together the quarterly balances from 2003 to 2017 for the 50 OEMs and 120 suppliers.
In general, balances rose from 2003 to 2007, then fell from 2008 to 2010, more or less matching economic conditions in the industry. Warranty reserves rose until early 2014, then hit a plateau around $22.5 billion, where they've remained for most of the past four years. Figure 6 shows the rise and fall of automotive warranty reserves over the past 15 years.
Figure 6
Automotive Product Warranties
Reserves Held by U.S.-based Companies
(quarterly totals in US$ millions, 2003-2017)
If we convert the data in Figure 6 into percentage shares, the shape of the terrain changes significantly. As can be seen in Figure 7, the OEM reserves trend line drops more or less continuously from 89% in 2003 to 81% in 2010. It then rises to a peak of 87% in 2014, but then resumes a slow decline to 85% in 2017. The second quarter 2017 reading was the lowest this ratio has been since before the GM-induced spike in 2014.
Figure 7
Automotive Product Warranties
Reserves Held by U.S.-based Companies
(as a percent of the total, 2003-2017)
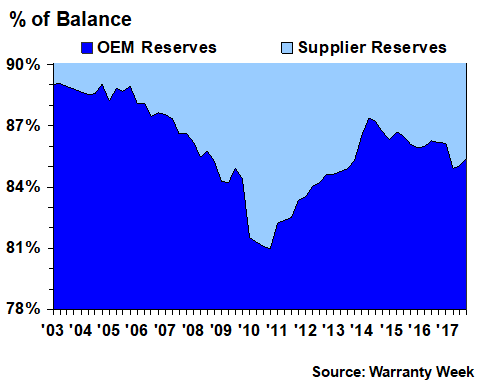
We last measured these ratios in the June 22, 2017 newsletter, which was published just as the recent increase in supplier recoveries was becoming apparent. What we said then is even more true now: Lately, the suppliers have been paying higher-than-average claims rates, with their early 2017 expense rates the highest they've been in seven or eight years. And because this is a zero-sum game, the OEMs have been paying lower-than-average claims rates, partly because they're making better products, but also because of the increased reimbursements from their suppliers.
It's difficult to separate the two causes, because the OEMs are not revealing the growth of those reimbursements when they announce decreases in their net expenses. But we can measure the increases for the suppliers, and infer that they're going to the OEMs as reimbursements. And on that basis, the data in the charts above show that there's been a shift towards the suppliers, interrupted by brief recall-related spikes, for most of the past decade.
Does this match what readers are seeing within their own companies? We'd like to include some comments from warranty managers within both the OEM and supplier communities, but we fear that nobody wants to see their name in print. Therefore, we invite comments that will be published on an anonymous basis, answering the question: Has there been a noticeable increase in supplier recovery efforts during the past decade?


