


Text Analytics for Warranty Claim Comments:
Warranty comment data contains a wealth of useful information that is often overlooked or underutilized. A pragmatic text analysis begins by carefully converting text data into a structured format. Once that's been achieved, various visualizations and analytical reporting can be used to supplement findings from other structured data sources.
Editor's Note: This column, written by After, Inc.'s Dan Adelsberg,
is the latest in an ongoing series of contributed editorial columns.
Readers interested in authoring a contributed column in the future
can click here to see the Guidelines for Editorial Submissions page.
By Dan Adelsberg
According to Warranty Week, U.S.-based warranty providers spend more than $24.7 billion on product warranty claims per year. OEMs invest heavily in analytical systems and staff in an effort to reduce costs, improve product reliability, and increase customer satisfaction. As part of these efforts, OEMs collect claim comment data but are challenged with what to do with it.
There are significant cost savings opportunities with unmined text data: identifying quality issues, reducing over-repair, and detecting fraud. While this is an area that OEMs recognize as an issue, few of them have the resources to address it.
Many OEMs approach text analysis in a top-down way, meaning they analyze structured data first, spot an issue, and then review comment data as part of a follow-up investigation. But structured data analysis need not preclude text analysis -- they can run in parallel. Carefully constructed text metrics can reveal issues with reliability or service that may otherwise go unnoticed.
In this article, we explain the challenges and nuances with analyzing warranty comment data. In addition, we show how text-related metrics can paint a more robust picture of the performance of each service provider.
Text Analytics
Text analytics, or text mining, refers to the process of organizing and interpreting unstructured data or text. The amount of accessible text data has grown exponentially throughout the Internet age with the emergence of sources such as social media posts, news feeds, Internet blogs, product ratings, and an increasing volume of digitized documents. This growth has coincided with advances in both computing power and analytical methods for text analysis.
Hundreds of new courses in Text Mining and Natural Language Processing (NLP) have been created in the last 10 years, many of which are part of new interdisciplinary degree programs in Data Science or Analytics. Most of these courses focus on phase-based methods, such as sentiment analysis and Part-of-Speech tagging. But these traditional methods are generally unsuitable for analyzing warranty comments, which present a unique set of challenges.
Warranty Claim Comment Data
Warranty service providers typically collect two main types of text data: customer comments and technician comments. Customer comments explain the reason for a service event, such as heating system not working, car leaking fluid, engine making noises, and so on. Within the appliance industry, customer comments (or complaints) are typically documented by a dispatcher or call center representative from a service network.
For franchised dealer-servicing industries, such as automotive, powersports, and power equipment, customer comments are recorded by the servicer itself. Technician comments describe the work performed or the resolution and are documented in varying detail by servicers. Both types of comments are ultimately entered into a warranty claim system, which the manufacturer may access for further analysis.
Unlike many traditional sources of text data, technician warranty comments are usually documented with informal language, and regularly contain technical jargon, acronyms, misspelled words, shorthand, and inconsistencies across service providers. Furthermore, manufacturers often collect comment data in multiple languages, though for purposes of this article we'll cover English comments only.
Processing Comment Data
We begin with an example from an appliance manufacturer to demonstrate how to process comment data. Below is a sample of actual customer comments drawn from a pool of refrigerator claims:
- S1. UNIT LEAKING WATER FROM DISPENSOR
- S2. REFRIGERATION ISSUES, OPERATIONS, FREEZING AND FRESH FOOD SECTION-FREEZING
- S3. FREEZING FOOD IN FRIG, NOT DISPENSING WATER.
- S4. REFRIGERATION ISSUES, ICE MAKER, NOT MAKING ICE
- S5. THE FREEZER IS NOT COOLING
- S6. THE UNIT IS NOT PRODUCING ICE. THE ICEMAKER IS NOT WORKING
- S7. WATER NOT DISP OUT THE DOOR AND ICE MAKER NOT WORKING
Our goal is to convert the unstructured text into a structured format, which is necessary for most data analysis, such as frequency counts, correlations, etc. This converted, structured form is known as the Document Term Matrix (DTM). This example demonstrates how the process of converting raw data into the DTM can be time consuming and tricky.
The table below is the DTM where the words are listed as columns and the individual observations (comments) are listed on the rows. First, common words such as if, and, the, etc. are discarded. In text mining, these omissions are known as stop words. Text mining software packages have built-in stop word dictionaries, but the data analyst may still need to create additional rules or exceptions manually.
Next, misspelled words are corrected and words are collapsed to their roots, a process known as stemming. For example, the 1st, 3rd, and 7th comments have the words dispensor (sic), dispensing, and disp, which are all organized into the dispens column. Similarly, frig, refrigerator, and refrigerator are combined into the refrig column.
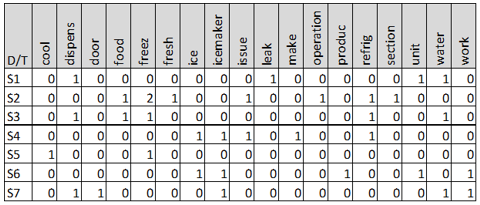
Another challenge with DTM formation is dealing with ambiguities from compound words. In this example, ice maker components appear as either "ice maker" or "icemaker"; we combined as icemaker to distinguish ice, maker, and ice maker as three separate terms. As a case in point, a comment "ice buildup in freezer, unit making hissing sounds" contains "ice" and a form of "make" but has nothing to do with the ice maker. Similarly, in automotive, a "water pump" and "waterpump" should be combined so not to confuse with "water" and "pump".
Without these steps the DTM may become too large and unwieldy, resulting in noninformative analysis. On the other hand, creating too small of a DTM by collapsing dissimilar words will also lead to poor results.
Visualizing Comments
If you're going to do an analysis without plotting the data, then you ought to buy a good insurance policy for statistical malpractice.
-- Dr. David Dickey, Statistics professor, North Carolina State University
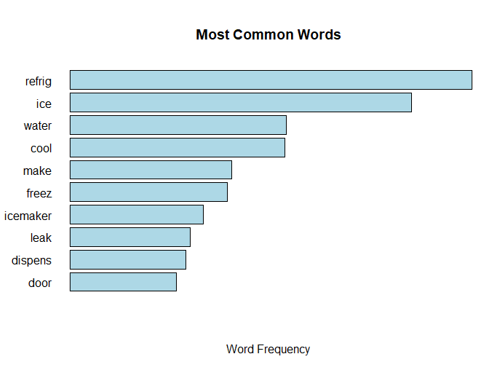
After the unstructured data are converted into a DTM or some other structured format, we can use various graphs to visualize the data. For example, we can create a frequency chart of the most common terms:
The word cloud is another common graphic for visualizing text data. Word clouds are often disparaged among data visualization bloggers as being decorative rather than informative. (To be sure, word clouds can be decorative. On a recent visit to my children's elementary school, I noticed a display of word clouds, crafted neatly on construction paper, lined ornately along the hallway walls.) Nevertheless, word clouds can be useful if constructed in an organized, purposeful way.
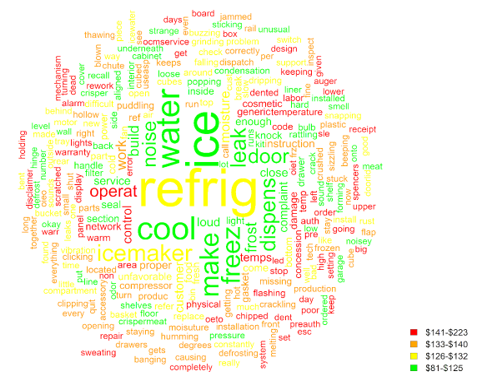
In this example, the size of the word represents the frequency and colors are coded according to cost. Words in red are associated with the most costly claims, followed by orange, yellow, and green. For example, ice and water are among the most common repair terms but tend to be less costly. On the other hand, words connoting physical damage (e.g. scratch, panel, chipped, dent, cosmetic) and special approval (e.g. concession, auth, preauth) are associated with higher costs.
To the skeptic, these insights could be more easily and accurately derived from structured data, say from a causal part code. But text analysis is meant to supplement structured data analysis, not replace it. Certain words such as dropped, corrode, oxidize, worn, rust, damaged, banana-in-the-tailpipe, etc. could be indicative of claims on items that are not (or should not) be covered.
These types of insights cannot be easily found with structured data. At After, Inc., word clouds have helped us uncover patterns in text that have ultimately led to changes in our client's warranty coverage terms and conditions. Furthermore, the emergence of new words in word clouds and analytical reports may uncover reliability problems faster than structured data analysis alone.
Comment Consistency and Servicer Ratings
In the March 1, 2018 newsletter (Managing Servicers and Dealers with Data), we explained how comparing servicers by various metrics can uncover problems with over-repair, noncompliance, premature replacement of parts, and other issues. Many OEMs rate their warranty service providers or dealers on metrics such as time to complete a job, days to submit paperwork, percentage of claims approved or rejected, and rate of repeat repairs. Service providers that score well are often given more leeway in the claim submission process, such as more auto-approvals, higher dollar threshold for prior-approval, and other benefits.
However, information found in text data is generally overlooked when making these decisions. In most cases, OEMs only review the comment data for claims involving some anomaly with structured data (e.g. a known reliability issue), but metrics based on comment data can reveal issues as well.
One useful metric to examine is the correlation between customer comments (complaints) and technician comments, while controlling for the type of labor code or job type. The table below is an example of compressor claims from an HVAC manufacturer:
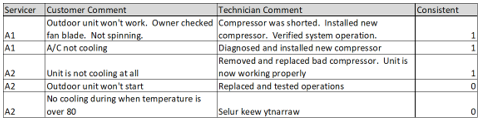
In this example, the first three cases are marked as consistent because the customer comments pertain to the air conditioning not functioning properly and the technician comment includes a mention of the compressor replacement. The fourth technician comment, "replaced and tested operations", is too generic and is therefore assigned a 0 score. The last comment has been masked with the note "selur keew ytnarraw", a decoded message designed specifically for this article. (Hint: read it backwards.) These results can be converted into overall consistency scores, where servicers A1 and A2 score 2/2 and 1/3 respectively.
Claim comments from servicers with unusually high or low consistency scores should be scrutinized. Low scores could be indicative of a mishandling of issues, noncompliance, or miscoding of job types. Unusually high scores are less common but can occur if a servicer simply copies the customer comments verbatim into the technician comments. In addition, servicers repeated use of words oversimplifying a failure (e.g. broken) should be scrutinized too. These oversimplified descriptions do not help engineering identify quality issues and maybe a clue that a servicer is inflating repair costs. At After, Inc. we have noticed this trend in multiple industries.
Another way to evaluate servicers is to compare their technician comments to the job type standard words. When creating a list of common terms, it's often necessary to exclude certain verbs like install, replace, inspect, fix, etc. as these could appear in many types of claims, thereby increasing the rate of false matches. Below is a sample of a few automotive claims:
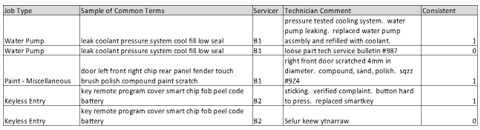
In the table above, the first technician comment includes keywords associated with water pump claims, whereas the second does not. The third claim is from a paint job and the technician comments are consistent with the job type. (Paint claims are also typical of pre-delivery, meaning the dealer was shipped a slightly damaged vehicle and filed the claim before selling the unit to a customer. As a follow-up, each servicer's paint claim comment consistency could be compared to their pre-delivery claim rate, which would be available in the structured data.) The fourth claim includes an acceptable description of a key issue, whereas the fifth does not.
Our overall consistency scores work the same way as in the previous example, where servicer B1 and B2 score a 2/3 and a 1/2 respectively. As explained earlier, outlying claims and servicers should be scrutinized. Servicers with unusually low scores may be mishandling claims. Unusually high scores could be indicative of a bug in the matching algorithm, e.g. some repeated, noninformative comments happen to pass the logic.
As a final step, the consistency scores can be combined with structured data to form an overall servicer score:
Score = 20% x (Technician vs. customer comment consistency) +
20% x (Technician vs. job code comment consistency) +
20% x (Claims approved as a percentage of submitted) +
20% x (On time submission rate) +
20% x (Parts usage vs. job type benchmark)
The specific metrics and weights, of course, should be customized for the type of business. Some metrics, such as parts usage vs. the job type benchmark, must be transformed to a 0-1 scale, with a 1 representing the desired behavior. In practice, we typically suggest 8-12 metrics for creating an overall score.
Conclusions
Warranty comment data contains a wealth of useful information that is often overlooked or underutilized by OEMs. A pragmatic text analysis begins by carefully converting text data into a structured format, such as a DTM matrix. Once the data are in the structured form, various visualizations and analytical reporting can be used to supplement findings from other structured data sources. In addition, text-related consistency scores can be created as metrics in a dealer scorecard or rating system. Ultimately, text analytics can save OEMs costs by uncovering reliability issues faster and detecting problems in servicing.
To provide feedback or to share your experiences with warranty comment data, please contact Dan Adelsberg at dadelsberg@afterinc.com. For more information about After, Inc., please visit www.afterinc.com or call (800) 374-4728.
About the Author
Dan is Group Director, Analytics, for After, Inc., and leads a team that provides statistical models and analytical solutions for a variety of clients. Dan has over 10 years of experience in database marketing and risk analytics, with a main focus in the warranty and financial services industries. In the warranty industry, Dan performs warranty and risk assessments for some of the nation's largest manufacturers. He has helped numerous manufacturers uncover warranty issues and balance reserve funds. In addition, his analyses have helped his clients save millions of dollars in service contract premiums. Dan holds a B.A. in Statistics from Rutgers College, an M.S. in Statistics from North Carolina State, and a B.A. in Spanish from Sacred Heart University.


