New Home Warranty Expense Rates:
Some industry metrics are at their highest level in more than a decade, and one set a new all-time high. And none of the builders are using the sleight-of-hand accounting tricks they employed before the last recession. So is there any substance to these talks of an imminent industry downturn?
As interest rates rise and worries about the future increase, one would think that new home sales would be among the first to respond. Back in 2005 and 2006, the industry flashed plenty of warning signs about the coming recession that most people missed. But now, knowing what to look for, could we use the available data to detect a slowdown one or two years before it happens?
With sales, revenue and warranty statistics in hand for roughly 30% of the U.S. new homes sold, we thought it would be a good idea to see if any of those metrics are currently flashing warning signals. So far, nothing troubling can be seen. We looked at warranty claims, accruals, and reserve levels, as well as unit sales and revenue per home sold, and nothing seemed peculiar.
We began with a list of 54 publicly-traded site-built home builders who together in 2017 built around 30% of the 612,000 new homes delivered in the U.S. last year. Each company publishes its sales and warranty metrics on a quarterly basis, as part of their financial statements.
We omitted most of the recreational vehicle manufacturers that we covered extensively in the August 9 newsletter, though we did include a few modular home manufacturers whose homes are assembled at their destination from modules made in factories. And we omitted all of the commercial building construction companies, leaving us with mostly single-family home builders.
Claims Totals
In Figure 1 we're looking at the claims payments of the builders over the past 63 quarters, covering the years between the beginning of 2003 and the third quarter of 2018. As is obvious, the builders paid more claims in the most recent two quarters than they have in any quarter since 2007.
Figure 1
New Home Warranties
Claims Paid by U.S.-based Homebuilders
(in US$ millions, 2003-2018)
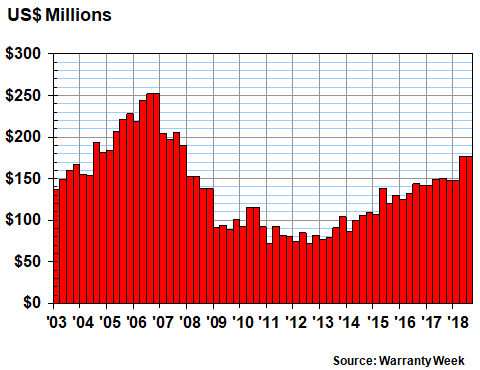
So far this year, builders have paid $501.5 million in claims, up by $60.8 million or about 14% from the same nine months of last year. A rising cost of repairing defects is never a good sign. But notice that those costs peaked in late 2006, and didn't stop declining for several years thereafter, as the recession took hold. So in that respect, rising warranty costs are a positive indicator.
Warranty Accruals
However, warranty claims are more of a lagging indicator, in that they arise from home sales that were completed a year or two before the work was done. In contrast, warranty accruals are made at the time a home is sold, and are based on each company's expectations for the future cost of all required warranty work. Therefore, if sales decline, so would accruals. And it would happen with much less lag time.
In Figure 2, we're counting the quarterly accruals of all the builders, and once again, we see the opposite of a decline. In the second and third quarters of 2018, industry accruals were at their highest level since late 2007. In the first quarter, accruals were down, but that has more to do with winter than anything else. Notice that the first quarters are always lowest in each of the last 10 years, suggesting there's a strong seasonal pattern to sales.
Figure 2
New Home Warranties
Accruals Made by U.S.-based Homebuilders
(in US$ millions, 2003-2018)
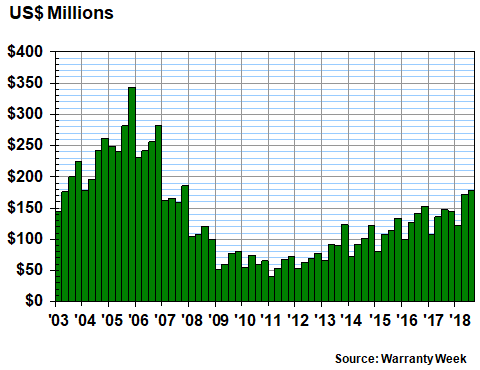
So far this year, homebuilders have accrued $471.3 million, up $82 million or 21% from the same period in 2017. Once again, that suggests no slowdown in sight. In fact, except for the seasonal pattern, the industry's trajectory has been for accruals to increase every year since 2011.
Warranty Reserves
Our third metric is the balance held in the warranty reserve funds of the 54 builders at the end of each of the last 63 quarters. Since the ending balance is a product of the claims paid and accruals made (plus a few other adjustments), it should come as no surprise that it's increasing.
But what is a surprise is that at least with this metric, we set a new record in the second quarter of 2018 and promptly broke it in the third quarter. As of September 30, 2018, the industry's warranty reserve funds contained a total of $1.361 billion, up 10% from a year before and more than $31 million higher than the previous peak in 2006.
Figure 3
New Home Warranties
Reserves Held by U.S.-based Homebuilders
(in US$ millions, 2003-2018)
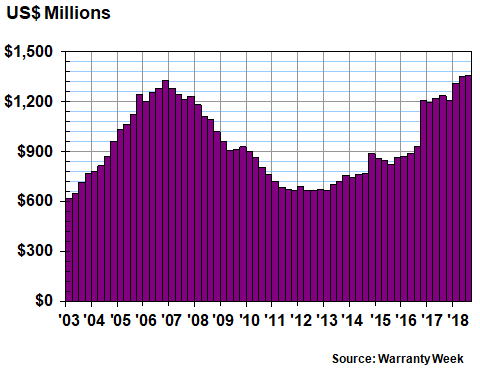
So far, we have two warranty metrics setting 10-year records and one metric setting an all-time record. Again, rising expenses aren't a good thing, but the fact that they're not falling suggests no slowdown.
Warranty Expense Rates
The missing metric is sales data. But even after we add that into the mix, there's still no evidence of a decline. In Figure 4, we've taken the claims and accrual data from Figures 1 and 2, respectively, and divided it by the corresponding revenue totals reported by the builders, to figure out the claims and accrual rates as a percentage of sales.
Once again, we see a strong seasonal pattern, reflecting the fact that home sales are slowest in the winter. But from year to year, the claims and accrual rates have remained about the same for at least the past six years. They rise; they fall. But virtually every one of the past 20 pair of measurements have been between 0.6% and 1.0%.
Figure 4
U.S.-based Homebuilders
Average Warranty Claims & Accrual Rates
(as a % of selling price, 2003-2018)
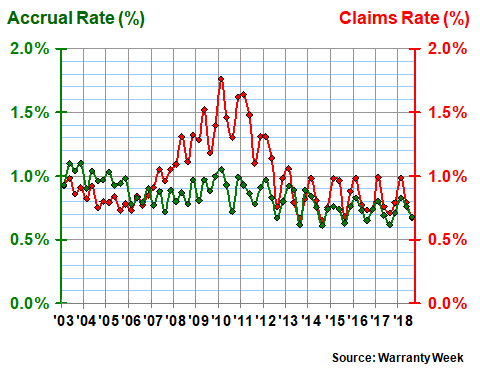
The trend would extend further into the past had it not been for the effects of the recession. Back then, sales were slow but the warranty work continued, driving the claims rate as high as 1.8% in early 2010. Accruals briefly rose above 1.0% of revenue as well. But as of the third quarter of 2018, both metrics were down below 0.7%, and nothing seemed amiss.
Unit Sales
With new homes, cars, and a few other product families, it's also possible to figure out warranty costs per unit sold. That's because most of the manufacturers reveal both the number of homes sold and the revenue derived from those sales, and because the product in question is homologized: a single-family home.
Since we have data for both unit sales and accruals per quarter, we can divide one by the other to calculate accruals per home sold. It's a different kind of accrual rate, calculated per unit rather than as a percentage of revenue.
For this metric, it's important that we count homes actually sold, as opposed to merely homes built or homes ordered. Especially during the recession, homes were built but were never sold. And in order to incur warranty costs, they must be sold. However, each homebuilder uses a slightly different word or phrase to refer to the number of homes they sell. D.R. Horton, and Meritage call them "homes closed." William Lyon Homes refers to the "number of homes closed." PulteGroup, and Beazer Homes simply call them "closings." Meanwhile, KB Home, Hovnanian, and M/I Homes Inc. call them "homes delivered." Lennar refers to "deliveries." MDC Holdings now calls them "new home deliveries," though it used to refer to "homes closed" until it switched to the new term in 2011. And NVR simply calls them "settlements."
Granted, while most of these builders sell homes priced around $400,000, the average price per unit at Toll Brothers averages twice that level, and both William Lyon Homes and Taylor Morrison Home are also significantly above the industry average. And so are their accruals per home. So the product mix is not as uniform as it could be.
However, it's not as if we're comparing mainframes to laptops, or jumbo jets to helicopters. A home is a home, whether it's a starter home by the highway or a mini-mansion in a leafy suburb. There are regional differences as well, and of course some local climate characteristics also have an effect on warranty costs (dampness, mold, odor-emitting drywall, relative need for heating/cooling, freezing, insects, etc.).
So let's go ahead and figure out how much money is being set aside for the warranty costs of each new home sold. In Figure 5, we're counting up the number of closings reported per quarter by all of these 54 builders. Totals range from the 89,000 reported for the last quarter of 2005 to the 17,300 reported for the winter of 2011.
Figure 5
U.S.-based Homebuilders
New Homes Sold per Quarter
(in units sold, 2003-2018)
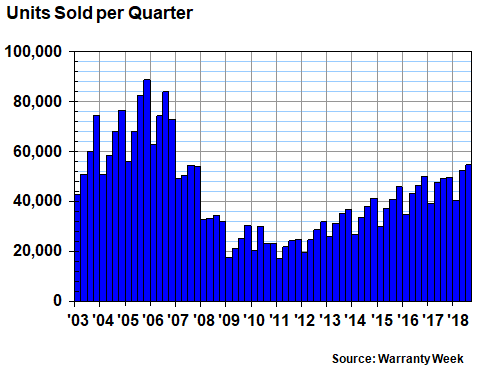
Once again, there's a very noticeable seasonal pattern to the sales volumes, with the number of closings lowest during the first quarter and highest during the last quarter of each year. That pattern was last broken in 2010, but it's visible in 12 of the past 16 years. But once again, the trend line is upwards from at least 2011 until the present day, suggesting fourth quarter 2018 sales above 55,000 units, which would be the highest quarterly total since 2006.
Accruals Per Home Sold
In Figure 6, we're taking the unit sales figures from Figure 5 and dividing them by the accrual totals in Figure 2. And we're repeating the percentage-of-sales accrual rate data from Figure 4. And what we see is a rising accrual rate per unit, versus a steady accrual rate per dollar. This implies rising new home prices and steady expense rates as a percentage of revenue.
Figure 6
U.S.-based Homebuilders
Average Warranty Accrual Rates
($ per home and % of revenue, 2003-2018)
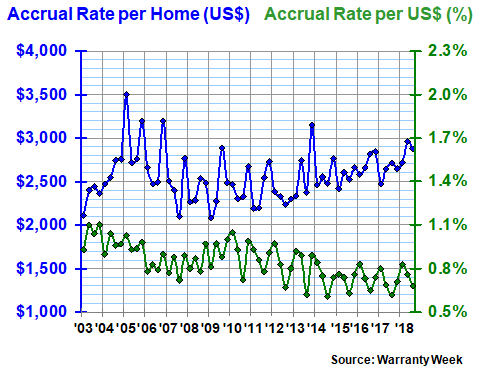
The industry average accrual rate per home was $2,964 in the second quarter and $2,879 in the third quarter of 2018. That's the highest they've been since 2013, but accruals have exceeded $3,000 per home on at least four occasions since 2003.
As could be expected, Toll Brothers and Taylor Morrison Home were accruing upwards of $4,000 per home for their high-end units. However, Hovnanian was accruing upwards of $5,000 per home, and William Lyon Homes was actually fifth-highest, after Lennar. Meanwhile, Meritage, D.R. Horton, and Beazer Homes were each accruing less than $2,000 per home.
In other words, the correlation between average selling price and accruals per home is not as predictable as one might expect. While higher-priced homes generally require higher accruals, the highest accrual rates are reported by some mid-priced home builders. And while D.R. Horton, which has the lowest average selling price among these builders, is also among those accruing the least per unit, Meritage and Beazer Homes are much closer to the mid-price average.
No Major Changes?
The more important metric, however, is that we have not observed many significant changes in accrual rates per home sold, as one might expect if companies are trying to manage expenses in advance of a slowdown. The only builder to cut their accruals per home by an unusually large amount recently was Beazer Homes. As we've noted in previous new home warranty reports, sometimes in the past some of these builders have slashed their accruals to zero, which in turn temporarily boosts profits (or reduces losses). We see little of that kind of behavior now.
And so, after measuring the sales, revenue and warranty statistics of the U.S.-based new homebuilding industry in seven different ways, we can find no evidence of a slowdown approaching. None of the leading or lagging indicators are declining, and one, in fact, has set a new record high. Next week, we'll do the same with the available data for the U.S.-based new car industry, to see if they're flashing any warning signals.