


Automotive Supplier Warranty Report:
For years, powertrain suppliers and other parts suppliers have more or less split the industry's warranty expenses 50/50. But in recent years, the powertrain segment's share has risen fast, thanks to emissions compliance trouble in California for some Cummins diesel engines.
Automotive engine and transmission manufacturers spend a larger share of their revenue on warranty costs, but now they're also spending more than the other parts suppliers on claims. Accruals have skyrocketed after diesel engines failed emissions tests, and now the powertrain suppliers account for more than three-quarters of the entire industry's warranty reserves.
To reach this conclusion, we began with a list of 120 U.S.-based automotive parts suppliers that report their warranty expenses in their financial statements. From each annual report and quarterly statement we gathered four essential metrics: warranty claims paid, accruals made, reserves held, and warranted products sold.
The latter metric required us to make subtractions wherever possible for non-warranted revenue sources such as service, investments, royalties, apparel sales, and others. This was done so that the comparisons of the claims and accruals totals to sales resulted in the best approximation of claims as a percentage of revenue and accruals as a percentage of revenue -- the claims rate and accrual rate, respectively.
With these metrics in hand, we further divided the list into two groups: those that supply components of the powertrain, such as engines and transmissions, and those that supply components for other systems in the vehicles, such as the seating, interiors, lights, tires, brakes, glass, chassis, and body. While some suppliers belong on both lists, we divided the 120 into two lists of 27 powertrain and 93 other suppliers.
The powertrain suppliers were dominated by companies such as Allison Transmission Holdings Inc.; American Axle & Manufacturing Holdings Inc.; BorgWarner Inc.; Cummins Inc.; Dana Inc.; Eaton Corp.; LKQ Corp.; Meritor Inc.; Visteon Corp. and Wabco Holdings Inc.
The remaining list of other parts suppliers included Aptiv plc (formerly Delphi); Carlisle Companies Inc.; Goodyear Tire & Rubber Co.; Graco Inc.; Illinois Tool Works Inc.; Lear Corp.; Regal-Beloit Corp.; Snap-on Inc.; Standard Motor Products Inc.; and Tenneco Inc.
Warranty Claims
In Figure 1, we are taking annual totals for each of the groups for the past 16 years. In 2018, the powertrain suppliers paid $911 million in claims, up by $43 million or 4.9% from 2017 levels. The other parts suppliers paid $708 million in claims, down by $59 million or -7.7% from 2017 levels.
Figure 1
Automotive Supplier Warranties
Claims Paid by U.S.-based Companies
(in US$ millions, 2003-2018)
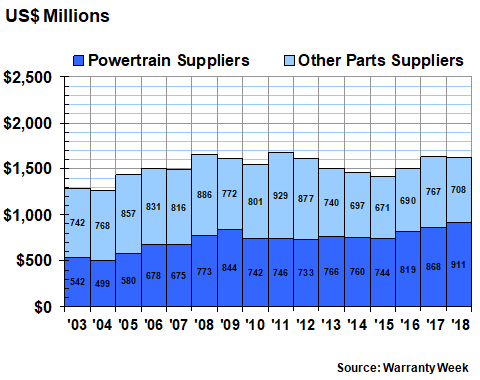
Notice that from 2003 to 2012, except for one year, the other parts suppliers accounted for more than half the combined total for the industry's claims payments (made primarily to the automotive OEMs, but sometimes, as in the trucking industry, to dealers or customers). And then from 2013 through 2018, the powertrain manufacturers accounted for more than half the total.
Last year, two of the powertrain suppliers were by far the largest claims payers in the industry, with Cummins paying out $443 million and Eaton paying out $145 million. Next on the list was O'Reilly Automotive Inc., which was one of several retail auto parts chains that adds their own warranty on select products such as batteries. One might think these costs would be incidental (and they do comprise less than one percent of the company's sales), but these costs quickly add up: in 2018, O'Reilly spent $89.6 million on claims and Advance Auto Parts spent $46.9 million.
In terms of year-to-year changes, Aptiv, Dana and Visteon led the list of companies reporting a decline in claims paid, while Lear, Tenneco, and American Axle led the list of those reporting increases. But we'll defer spelling out the numbers involved, because comparisons to annual revenue are a far better measure of the impact these changes would have on a company, especially those involved in mergers and acquisitions.
Warranty Accruals
Claims are what you pay for past mistakes and manufacturing problems. Accruals are what you believe those warranties will cost you in the future, based upon the best information you have available at the time of a product sale. As such, the amounts of claims and accruals rarely coincide. When sales are increasing rapidly, so should accruals. When sales are plummeting, claims might not do so as deeply, because the OEMs, dealers and customers might attach more importance to warranty work when the economy is uncertain.
Also, when a company believes a major problem is ahead, it will usually increase accruals in advance of the actual claims. In Figure 2, this is what we see happening in 2017 and 2018, with the powertrain suppliers nearly doubling their accrual totals from the mid-$700 million range to last year's record $1.4 billion level.
That record increase (+39% in 2018 alone) can be traced primarily to the troubles of engine maker Cummins, which set aside a whopping $918 million in accruals last year, up from $557 million in 2017 and $334 million in 2016, for what it described in its financial statements as an "Engine System Campaign," caused by the failure of its diesel engines to pass an emissions test in California. Allison Transmission added $20 million to its accrual total and Meritor Inc. added $9 million, but those were almost totally offset by a $24 million accrual reduction by Eaton alone. Others that reduced its accruals last year included American Axle, BorgWarner, and Wabco.
Figure 2
Automotive Supplier Warranties
Accruals Made by U.S.-based Companies
(in US$ millions, 2003-2018)
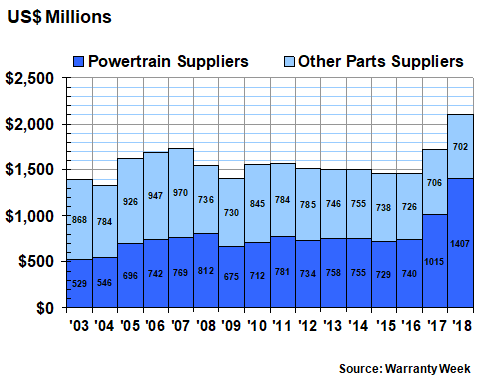
The other suppliers, meanwhile, actually reduced their accruals last year by a slight $4 million, or -0.6%, to $702 million -- their lowest annual total ever, or at least their lowest since they began including warranty expense figures in their financial statements in 2003.
Valspar Inc. is one of the only major acquisitions in this group in recent years (acquired in 2016 by the Sherwin-Williams Company). And Valspar accrued only $10.1 million in its last year as an independent company. So the drop-off in accruals in this case can't be blamed on the exit of major players. Instead, it's caused by reductions made by current major players, such as Aptiv, Lear, and Tenneco.
Warranty Expense Rates
As mentioned, various factors can explain away some of the massive increases and decreases in claims and accrual totals. Chief among them are mergers and acquisitions, as well as spin-offs and divestitures, which can radically change the revenue totals and product mix as well. However, there weren't enough of these changes to account for the all increases and decreases we saw.
Instead, we suspect that some of these companies enjoyed (or suffered) some very real changes in the quality and reliability of the products they sell, causing their warranty expenses to rise or fall as a result. The best way to measure these changes is to compare claims and accruals to sales.
In Figures 3 and 4, we've taken the data from Figures 1 and 2 and divided them each by comparable figures for warranted product sales. Because the data is gathered quarterly, we've changed the frequency of measurement from once a year to four times a year, resulting in 64 paired measurements of the claims rate and the accrual rate for both the powertrain suppliers and the other suppliers.
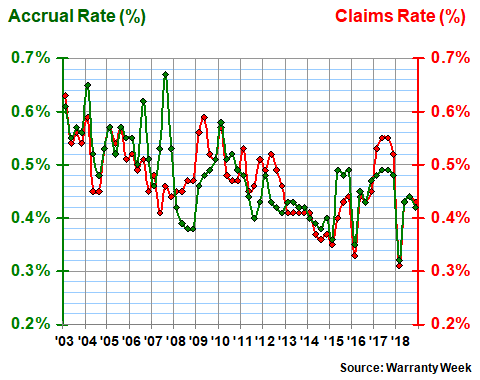
In Figure 3, we're looking at the track record of just the 27 powertrain suppliers. And we note two peculiarities in the chart: First, in 2009, their average claims rate soared all the way to 1.6% -- far above their 0.9% long-term average. And second, in 2018, their accrual rate also soared to 1.6%, which was also way above average.
Figure 3
Powertrain Suppliers
Average Warranty Claims & Accrual Rates
(as a % of product sales, 2003-2018)

The 2009 spike can be quickly explained away by noting that sales fell precipitously, which drove up the percentage calculation significantly. But take a look back at Figure 1. Claims also spiked in 2009, to $844 million from $773 million the year before. In fact, that annual record stood until the industry finally surpassed it in 2017, which was a year of record product sales.
The 2018 spike is traceable primarily to Cummins. We've already spelled out the increase in terms of dollars. But as a percentage of sales, the impact is even clearer. Back in 2016 and early 2017, Cummins was setting aside about two percent of its revenue as warranty accruals. By the end of 2017 the company's accrual rate was up to 2.7%. And then last year, it rose to 4.5% in the third quarter before falling back to 3.9% in the fourth quarter. With $23.77 billion in sales, such an increase in expense rates translates to hundreds of millions of dollars in added costs.
Other Parts Suppliers
The expense record of the other parts suppliers has been much less volatile. The recessionary spike in 2009 was much less dramatic. And while the ups and downs of the last four years look significant on this scale, keep in mind that the range has been only 0.25% from top to bottom. In other words, the small scale makes small changes look larger.
Over the long term, the claims and accrual rates of the other parts suppliers have averaged 0.5%, with a standard deviation of only 0.07%. Their first-quarter 2018 averages were their lowest ever -- just above 0.3%. And while their 2017 claims rate averages were their highest since the recession, they were only slightly above the median.
Figure 4
Other Parts Suppliers
Average Warranty Claims & Accrual Rates
(as a % of product sales, 2003-2018)
Some of the successes were spectacular. Aptiv, for instance, cut its accrual rate in half, from 0.8% at the end of 2017 to 0.4% at the end of 2018. It also reduced its accrual rate from 0.4% to 0.3% during the same time period. Lear and Tenneco each reduced their accrual rates by about a third, though both also saw a rise in claims.
At the "bad" end of the list, Cooper Tire & Rubber Company nearly doubled its claims rate while raising its accrual rate by nearly a third. Goodyear also raised its accrual rate, though its claims rate fell slightly. Illinois Tool Works saw modest increases in both expense rates, as did both LCI Industries and O'Reilly Automotive. But the bottom line is that except for Cooper Tire and Aptiv, most of the changes in expense rates were small.
Warranty Reserves
Our final warranty metric is the year-ending balance in the warranty reserve funds of the 120 suppliers. Of course, this is heavily affected by the additions of accruals and the subtraction of claims payments, but it is also changed by the fluctuations of foreign currencies and the net effects of mergers and acquisitions, as well as by corrections of past errors in accrual rates.
In Figure 5, we can see that the powertrain suppliers increased their collective reserve balance by $528 million to nearly $2.9 billion by the end of 2018, a 22% increase from just the end of 2017. Other parts suppliers also increased their collective balance, but by a much smaller amount of $26 million, or 2.9%. Together, the two groups pushed their reserves up by 17% to a new record just above $3.8 billion.
Figure 5
Automotive Supplier Warranties
Reserves Held by U.S.-based Companies
(in US$ millions, 2003-2018)
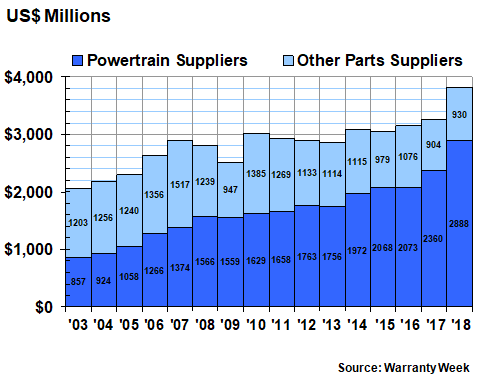
Notice also that the relative shares of the two groups has also set a new record. From 2003 until 2007, the other parts suppliers held more reserves than the powertrain suppliers. By 2015, however, the powertrain group accounted for more than two-thirds of the total. In 2018, their share exceeded three-quarters for the first time.
Once again, the cause of this swelling in the totals can be traced primarily to Cummins. The company held $1.4 billion in its reserves at the end of 2016. That amount increased to nearly $1.7 billion by the end of 2017. In the second half of 2018, it remained above $2.2 billion.
Among all U.S.-based manufacturers across all industries, Cummins is now ranked fifth in warranty reserves, behind GM, Ford, Apple and GE, and ahead of Deere, United Technologies, Caterpillar, and Boeing. Those are the only nine to report holding more than $1 billion in warranty reserves at the end of last year (although several European and Asian manufacturers are also in the billion-dollar club).
Other Reserve Increases
On a relative basis, however, Tenneco reported an even larger increase in its reserve balance. The company boosted its warranty reserves from $26 million to $45 million from 2017 to 2018 -- a 73% increase. Other significant increases were reported by Allison Transmission, Brunswick Corp., Meritor Inc., and LCI Industries.
And then there were some significant reductions as well. For instance, Lear reduced its reserve balance from $47 million to $29 million, Aptiv cut its reserves from $58 million to $50 million, and Wabco cut its balance from $51 million to $44 million. Other reductions significant in dollar terms but not in percentage terms included a $12 million reduction by Eaton and an $8.3 million reduction by BorgWarner.
Next week, we're going to take these two groups of suppliers and compare them to our two groups of OEMs, representing large and small vehicle manufacturers. The goal is to see where we stand in terms of supplier recovery -- the ebb and flow between net claims payments and reimbursements -- which we'll measure in several different ways.


