


Top Japanese Automaker Warranty Expenses:
Toyota and Honda continue to recover from their recall-related spikes in warranty costs. But for Nissan Motor Company Ltd., there's not much change to report. The company's warranty expense rates have remained stubbornly close to one percent for more than a decade.
While Toyota Motor Corp. and Honda Motor Company Ltd. continue trying to get back to normal after paying the price for their respective unintended acceleration and air bag problems, Nissan hasn't seen much change in their warranty expense metrics. While sales have risen over the past decade, warranty expenses have risen more or less in proportion, with no surprises on either the upside or the downside.
We gathered the warranty data from the financial statements of the top three Japan-based automakers: Toyota, Honda, and Nissan. All three follow fiscal years that end in March, so the figures marked "2018" in the charts below are for the 12 months from April 1, 2018 to March 31, 2019.
From each financial statement, we collected three warranty metrics: the amount of claims paid per year, the amount of accruals made per year, and the amount of warranty reserves held at the end of each fiscal year. All are denominated in Japanese yen, not dollars, though for the sake of comparison one can assume that 100 yen is equal to about one U.S. dollar. So a billion Japanese yen is equal to about US$10 million, though this conversion rate varies from year to year.
Toyota and Honda include all three warranty metrics in all their annual reports: claims paid, accruals made, and reserves held. Nissan, however, includes just figures for accruals and reserves, so we had to create our own estimates for their annual claims payments.
We also gathered data on automotive sales revenue for each company as well as the number of vehicles they each sold worldwide per year. Using that data, we calculated claims as a percent of sales revenue (the claims rate), accruals as a percent of sales revenue (the accrual rate), and the amount accruals made per vehicle sold. Once again, the claims rate for Nissan is estimated, while the figures for Toyota and Honda are based entirely on reported data.
Warranty Claims
In Figure 1, we are including the total amount of claims paid worldwide by the three manufacturers. As is obvious from a glance at the chart, claims fell last year, after peaking in fiscal 2016 and falling in 2017 as well. Claims totaled 846 billion yen, down about 11% from the 2017 figures.
Figure 1
Top Japanese Auto Manufacturers
Claims Paid per Year
(in billions of yen, fiscal 2005-2018)
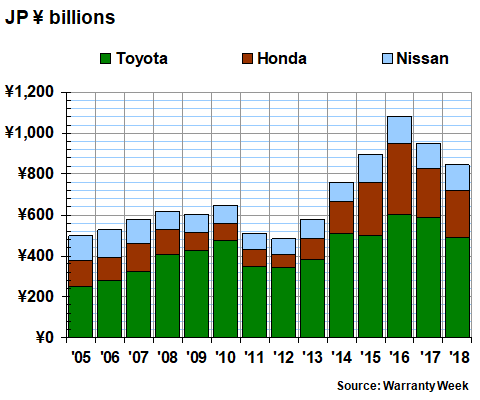
Toyota reported the largest decline, in terms of both money and percentages. It spent 489.5 billion yen on claims, down by 97.5 billion yen or about 17% from 2017 levels. Honda's claims total was down by 8.7 billion yen, or about 3.6%. And we estimate that Nissan saw a slight increase in its claims total, to 125.7 billion yen.
Claims Rate
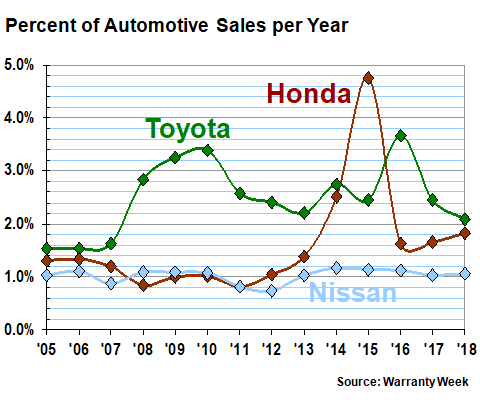
When combined with automotive sales revenue figures, the picture changes slightly. As can be seen in Figure 2, both Toyota and Honda saw their claims rates decline in fiscal 2018, while we estimate a slight increase in Nissan's claims rate.
Figure 2
Top Japanese Auto Manufacturers
Warranty Claims Rates
(as a percentage of sales, fiscal 2005-2018)

Honda is recovering from the massive spike in costs related to its air bag recalls. Toyota had its problems with unintended acceleration and defective floor mats a decade ago.
Back in fiscal 2010 (the year ending in March 2011), Toyota's claims rate peaked at 2.7%. In fiscal 2016, Honda's claims rate peaked at 2.8%. Both are far below those levels now.
Our estimates for Nissan suggest that its claims rate hasn't changed much over the past 14 years, remaining close to its long-term average of 1.0%. In contrast, Toyota's long-term average is 1.9%, while Honda's is 1.4%.
Nissan has held the lowest claims rate of the three in 10 of the past 14 years. Honda took the title four times, but not since fiscal 2012. Honda also took the title for highest claims rate three times, while we estimate that Nissan edged out Toyota for that title back in fiscal 2006. But Toyota had the highest claims rate in the other 10 years.
We should note that direct comparisons of this type are fraught with peril, because different companies can measure warranty in different ways. For instance, the figures for Toyota did not begin to include recall expenses until fiscal 2009. The company restated its 2009 and 2010 warranty expenses in its 2011 annual report (see the June 30, 2011 newsletter for more). So comparing Honda and Toyota before that point is like comparing apples and oranges. Meanwhile, in this instance, the Nissan data points are mere estimates.
Warranty Accruals
As was mentioned, Nissan does in fact include figures for its warranty accruals (called "provisions") in its annual reports. But again, no two companies count warranty the exact same way, so direct comparisons of this metric are also fraught with peril.
In Figure 3, we're looking at the amount of accruals made per fiscal year by the three top Japanese automakers. In fiscal 2018 (the year ended in March 2019), the trio accrued 935 billion yen, which was about 5.7% below their fiscal 2017 levels.
Figure 3
Top Japanese Auto Manufacturers
Accruals Made per Year
(in billions of yen, fiscal 2005-2018)

However, accruals were down for Toyota only. Nissan and Honda both reported increases. But all three are now far below the record levels they accrued in fiscal 2016, when the cost of the air bag recalls was peaking.
Accrual Rate
In Figure 4, we're taking the accrual data from Figure 3 and comparing it to automotive sales revenue in order to calculate the accrual rate for each company. Once again, there's a spike in the Honda data, but it's a year earlier for accruals than it was for claims. This follows the expected pattern for claims and accruals, where an expense is first predicted and accrued for, then the bills are actually paid a year or two later.
Figure 4
Top Japanese Auto Manufacturers
Warranty Accrual Rates
(as a percentage of sales, fiscal 2005-2018)
Once again, there hasn't been much change in the Nissan numbers, with the company sticking close to its long-term average accrual rate of 1.0%. In 10 of the 14 years, it reported the lowest accrual rate in the group. But from fiscal 2008 to 2011, Honda held that title. And then Honda held the high water mark in fiscal 2015, while Toyota held it the other 13 years.
However, please also note that there was only about three-tenths of a percentage point between Honda and Toyota in fiscal 2018. That's because Toyota's accrual rate has fallen for two straight years while Honda's has been creeping back up for the same amount of time.
Honda's long-term average is 1.6%, however, while Toyota's is 2.5%. So Honda is now above average while Toyota is below average.
Accruals per Unit Sold
In the passenger car industry, the manufacturers always disclose the number of units they sell worldwide, so it's a relatively straightforward process to calculate how much they accrue per unit sold. But then it gets a bit complicated. Toyota also makes buses and boats. Honda also makes planes, motorcycles and generators. Nissan makes trucks and boat engines. All of those products generate warranty expenses, so some of each company's accruals must go towards those product lines.
Let's assume they don't. Or more precisely, let's assume the main product line of each company is passenger cars and light trucks. And this isn't as big a leap of faith as it might sound. In terms of revenue, for instance, 82% of Honda's sales revenue comes from cars. So even if the expenses of motorcycles and generators are different, it wouldn't move the averages tremendously.
Last year, Toyota sold 9.0 million units. Nissan sold 5.5 million units. And Honda sold 3.7 million units. If we divide those figures into the accrual totals detailed in Figure 3, we get accrual per vehicle figures of 66,000 yen for Honda, 63,000 yen for Toyota, and 22,000 yen for Nissan.
That Nissan figure sounds kind of low until you remember that back before the air bags and the floor mats, Honda and Toyota accrued much less per unit. For instance, back in fiscal 2011, Honda accrued only 19,000 yen per unit. Back in fiscal 2005, meanwhile, all three accrued close to 37,000 yen per unit sold.
Figure 5
Top Japanese Auto Manufacturers
Accruals Made per Vehicle Sold
(in yen, fiscal 2005-2018)
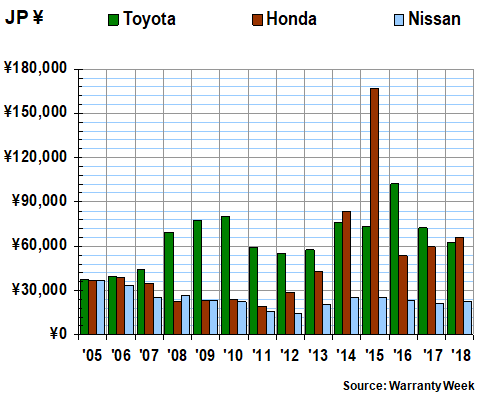
The 2015 spike for Honda was related to the air bag recalls. With exchange rates prevailing at the time, that 2015 rate was the equivalent of more than US$1,237 per unit sold. It declined dramatically to just under 55,000 yen per vehicle in 2016, as the chart shows. But last year, Honda saw its accruals per vehicle rise by 11%, after rising by a similar percentage from fiscal 2016 to 2017.
Meanwhile, Nissan's accrual rate per vehicle sold also rose last year, after falling in both 2016 and 2017. Toyota's accrual rate per unit actually fell a bit below Honda's last year, which has happened only twice before, in 2014 and 2015.
Warranty Reserves
Our final metric to examine is the balance reported in the warranty reserve funds of the three manufacturers. It's been relatively stable for four years at around the 2.4 trillion yen level, but in fiscal 2018 it was up by about 2.7% from year-before levels.
Figure 6
Top Japanese Auto Manufacturers
Reserves Held At Year's End
(in billions of yen, fiscal 2005-2018)

This time, Nissan was down while the other two were up. But it was a decrease of only 1.2% from 2017 levels. And Honda's reserve balance was up by only 0.2%. So it's no wonder that the balance has remained relatively stable for several years in a row.
There are numerous other Japanese automotive manufacturers, including Subaru, Suzuki, Mazda, Mitsubishi, Isuzu, and Hino Motors. Together, they hold about 800 billion yen in warranty reserves, according to figures they include in their annual reports. Therefore, if we added their warranty reserves into the mix, the industry total would rise to about 3.2 trillion yen.
However, while all six of these companies report their reserve balances, none report their claims expenses. And only two of them report their warranty accrual totals. So it would be unwise to include estimates of their missing warranty metrics alongside the exact figures included in this week's newsletter.
Therefore, while we will definitely fashion some estimates to plug the holes for each of them and include those estimates in our forthcoming worldwide auto warranty expense report, we will not include them in this week's newsletter. We did the same in the newsletter two weeks ago -- when we examined the warranty-reporting manufacturers BMW, VW, Daimler and FCA but excluded the non-reporting PSA and Renault -- and will have to do the same when we get around to sizing up the Chinese auto manufacturers.


