Worldwide Automotive Warranty Expenses:
With reliable warranty expense data in hand from 24 of the world's largest carmakers, we have calculated some worldwide metrics: $46 billion in claims, $50 billion in accruals, $115 billion in reserves, 2.14% average claims rate, 2.53% average accrual rate, and $543 in accruals per unit sold.
The world's automobile manufacturers, who for more than a century have been subject to product liability lawsuits and safety recalls, are also among the world's best practitioners of warranty cost reductions. And more directly to the purposes of this week's newsletter, they're also nearly universally now reporting their warranty expenses to the public, so an accurate worldwide industry snapshot can now be assembled.
There's simply no other industry that announces all their sales and expense metrics to the public to this degree. In the computer and homebuilding industries, some of the largest manufacturers are privately-held. In the appliance and electronics industries, some of the major players are from countries where accounting rules do not mandate the disclosure of warranty expenses.
However, in the automotive industry, manufacturers not only release their sales data, but also their warranty expenses. Sometimes it's a little hard to find, but by this point we've spent 16 years looking for it. And we think we now have hard numbers for nearly 96% of the entire industry.
Totals and Averages
To calculate all these totals and averages, we began by looking for a definitive data set for the world's automotive sales, and we found one in the statistics of the International Organization of Motor Vehicle Manufacturers. According to the group, the world's automakers sold 95.06 million vehicles last year, down from 95.66 million in 2017.
We then went to the annual reports of the world's top auto manufacturers, from which we extracted five essential metrics: warranty claims paid, accruals made, reserves held, product sales revenue, and number of units sold. We went back as far as we could, but found it difficult to complete this task much past ten years ago.
With these metrics in hand, we calculated industry totals for claims, accruals, and reserves, and also calculated ratios for claims as a percentage of sales revenue (the claims rate) and accruals as a percentage of sales revenue (the accrual rate). In addition, using the unit sales data, we calculated the amount of accruals made per vehicle sold.
We were able to gather what we would consider to be "hard data" from 20 manufacturers, which means the companies reported all five metrics in their annual reports. And additional four manufacturers reported four out of five metrics, leaving it up to us to do some eighth grade math to solve an algebra equation for the missing data.
In all, we found that these 24 manufacturers sold and incurred warranty expenses for 91.11 million vehicles in 2018, which means we have hard data for nearly 96% of the world's autos. However, being as warranty expense reporting became less common as we went back in time, the hard data available in 2009 represented only 83% of the worldwide market. So for the missing data, we extrapolated and forged reasonable estimates.
Steady readers have watched this process unfold over the last six newsletters, in which we have detailed the known warranty expenses for most of the 24 manufacturers. This week, we will take all of those totals and averages, most of which were expressed in euro, yen, yuan, won, rupees, and kronor, and convert them all into U.S. dollars so we can tabulate worldwide totals and averages for the past ten years.
Warranty Claims Totals
In Figure 1 we are displaying the claims totals for what we calculate to be the top 16 warranty payers. Mazda Motor Corp. is the only one of the 16 that does not report its claims or accrual totals in its annual reports. We have hard numbers for the other 15. And because many of them are selling more cars than the non-reporters, we believe we have hard numbers for 98% of the world's claims payments.
In 2018, the world's automakers paid just over US$46 billion in warranty claims, down by more than $6.9 billion from 2017's record US$53 billion total but up from 2016's US$43 billion total. But keep in mind that those totals are affected by the rise and fall of the U.S. dollar as well as by the actual outlays of the manufacturers themselves.
Figure 1
Worldwide Auto Manufacturers
Claims Paid per Year
(in millions of US$, 2009-2018)
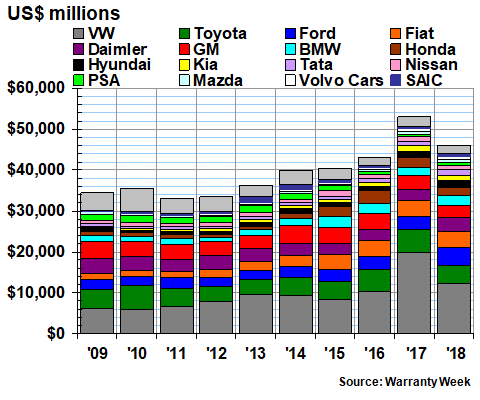
The totals mesh well with the news of the industry. For instance, Volkswagen's claims soared in 2017 as the effects of the diesel emissions scandal took hold. There's a bulge in the General Motors data in 2014 as the ignition switch recalls hit their stride. Toyota's total grew in 2010 as the unintended acceleration problems turned into claims. And Honda and others had their recent troubles with the air bag recalls.
Also, the ten-year trend suggests that the big jump in claims in 2017 was an anomaly, which was directly related to VW's diesel woes. Every year since 2011, and except for 2017 to 2018, there was a gradual increase in claims, which also meshes well with the worldwide industry sales totals. Unit sales fell from 2017 to 2018, but not by 13%, as did claims.
Average Claims Rates
We have detailed the claims and accrual rates of all the top manufacturers in the last six newsletters, so there's no reason to repeat them here. Besides, to have 24 trend lines crisscrossing each other on a single chart would be a mess, to say the least. Instead, what we're doing below is taking an average of the last five years, and ranking them from lowest to highest.
Based upon the data found in their annual reports (and in the case of Nissan Motor, SAIC Motor, Brilliance Auto, and Isuzu Motors, our eighth grade math-based estimates), here are the average claims rates for 24 of the world's top auto manufacturers from 2009 to 2018.
Figure 2
Worldwide Auto Manufacturers
Average Warranty Claims Rates
(as a percentage of sales, 2014-2018)
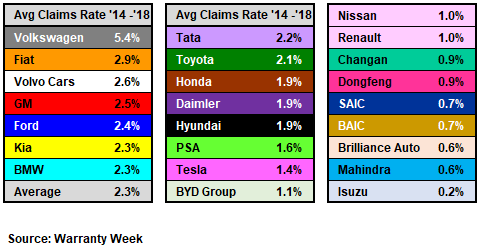
Note that five of the nine lowest are Chinese manufacturers, which as we outlined in the August 1 newsletter, seem to have gravity-defying low warranty expense rates. Isuzu is more involved with commercial trucks and diesel engines than with passenger vehicles, so their data doesn't fit well with the others. But Renault and Nissan are notable in their presence on the low list.
Meanwhile, VW is the highest on the high list, followed by European, American, and Korean manufacturers. Toyota, Honda, and Hyundai, known for their quality, and Daimler and Tata (and Jaguar Land Rover), known for their luxury, are in the middle. And what about seeing two of the world's leading electric car manufacturer (Tesla and BYD Group) with such low average claims rates? That doesn't mesh well with the opinions of the naysayers.
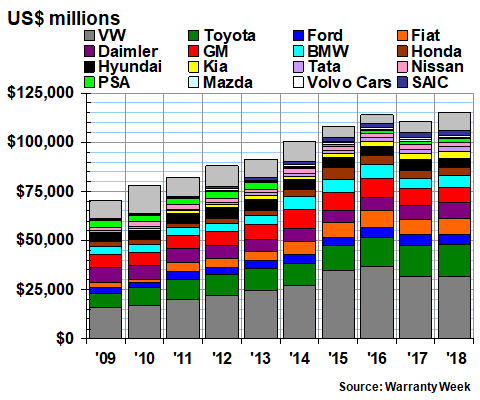
Warranty Accrual Totals
While claims are paid sometimes years after the cars are sold, the accruals are usually set aside as the vehicle is being sold. Therefore, there's more of a correspondence between sales and accruals than there is between sales and claims, where there is always a lag time.
In Figure 3, for instance, we can see that VW's accruals soared in 2015 (news of the diesel emissions scandal broke in September of that year), while its claims payments didn't peak until two years later. So that implies a two-year lag time between when a car is sold and when its claims cost peaks.
Figure 3
Worldwide Auto Manufacturers
Accruals Made per Year
(in millions of US$, 2009-2018)
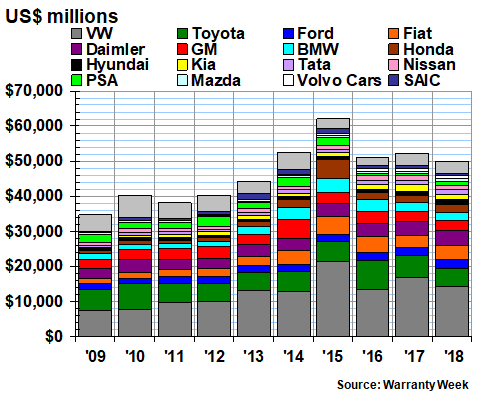
Because of VW, the industry's warranty accruals also peaked in 2015, at a level of just over US$62 billion. They fell by US$10.9 billion in 2016, rose slightly in 2017, and fell slightly in 2018, to just under US$50 billion. And so, depending upon which metric you prefer, you can say that worldwide auto warranty expenses are either US$46 billion or US$50 billion, in round numbers.
Out of the 16 OEMs named on the chart, Kia, Toyota, and Volkswagen saw the biggest percentage declines in their accrual totals from 2017 to 2018. PSA, Hyundai, and Tata saw the biggest percentage increases. But keep in mind that all these measurements are skewed by changes in the value of the U.S. dollar from 2017 to 2018, and do not reflect the changes as measured in their native currencies. For those metrics, we refer you back to the six newsletters preceding this one: https://www.warrantyweek.com/newsarchive/.
Average Accrual Rates
Accrual rates, on the other hand, are calculated in the native currencies of the manufacturers, and so they are not affected by our translations into U.S. dollars. However, as each manufacturer makes their accrual decisions, they have to consider the currency fluctuations across their major markets, and how that will affect the cost of future claims. In other words, foreign exchange considerations are built into the predictions of these manufacturers.
In Figure 4, we're taking an average of the last five accrual rate measurements of each manufacturer for which we have hard numbers. It's the same group of 24 companies, but they've moved around a bit. Now, Tesla and Tata are in the high rate group, and both GM and Ford have moved to the middle group. But VW is running away with the title of highest rate of all, more than twice as high as number-two Fiat Chrysler Automobiles.
Figure 4
Worldwide Auto Manufacturers
Average Warranty Accrual Rates
(as a percentage of sales, 2014-2018)
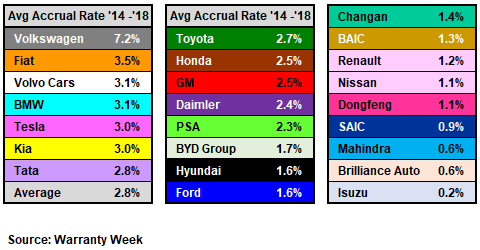
And now we can give you two more worldwide auto warranty metrics, based on the hard data of 24 manufacturers as well as estimates for the rest: from 2014 to 2018, claims averaged 2.32% of sales revenue, while accruals averaged 2.81% of revenue. Those are the worldwide auto industry's average claims and accrual rates. Standard deviations are 0.26% and 0.37%, respectively. And all the companies in the left-hand boxes are above average, while all those in the center and right-hand boxes are below average.
Accruals per Unit Sold
In Figure 5, we're looking at accruals in a slightly different way. Rather than as a percentage of revenue, we're calculating how much is accrued per unit sold. Because all the car manufacturers release this data, and most also release their accrual data, there are very few estimates necessary. However, once again, the value of the U.S. dollar over time affects these calculations considerably.
Figure 5
Worldwide Auto Manufacturers
Average Accruals Made per Vehicle Sold
(in US$, 2014-2018)
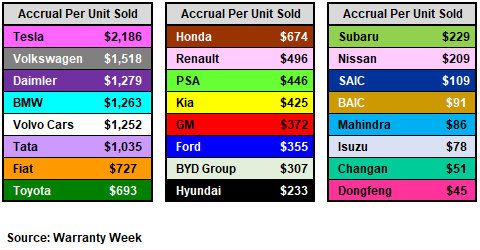
We note that luxury manufacturers Tesla, Daimler, BMW, Volvo, and Tata are right where one would expect to find them: on the high side of the chart. And once again, the Chinese manufacturers are at the very low end -- lower even than Hyundai, Subaru, and Nissan.
By the way, the worldwide average accrual per vehicle sold over the past ten years is $542.81. But it was actually a bit lower than that in 2018, as it was from 2009 to 2013. And based on the data in Figure 5, this means that Toyota and Honda are above average, while Renault and PSA (not to mention GM and Ford) are below average. That's not something we would have expected.
One might think that Toyota and FCA are out of place on the high list, and that Honda and Renault belong on the low list. And how on earth can GM and Ford be lower on the list than a dozen of the world's top automakers? We'd love to say we know the answer, but we don't. All we know is that our eighth grade math skills tabulated the results based on data the manufacturers themselves published.
Warranty Reserve Totals
Almost all the manufacturers reveal at least the ending balance in their warranty reserve funds somewhere in their annual reports. In fact, for that metric we have hard-number readings from not only the 24 companies named above, but also for Suzuki, Mazda, Mitsubishi, Hino Motors, and Great Wall Motors. but again, they're skewed by the conversions into U.S. dollars.
In Figure 6, we can see that automotive warranty reserves set a new record of US$115 billion in 2018, up slightly from the previous record of US$114 billion set in 2016. Once again, VW led the pack, having nearly twice as much in its warranty reserve as did Toyota (we should note, however, that Toyota's measurements came at the end of its fiscal year in March, three months later than VW's did).
Figure 6
Worldwide Auto Manufacturers
Reserves Held at Year's End
(in millions of US$, 2009-2018)
Out of all these companies, the biggest annual increases were reported by PSA, BMW, and Daimler. The biggest decreases were reported by Mazda, GM and Hyundai. But again, the value of these balances in U.S. dollars was heavily affected by the fluctuations in the value of the dollar. Again, we'll refer you back to previous newsletters for details about the balances in their native currencies.
Warranty Claims per Region
We have one more metric to present, and this is one that may be a little confusing. But obviously, we know the native country of most of these manufacturers (still not sure if FCA is from Italy, Holland, or England, though), as well as the currency they use in their annual reports.
So we thought we'd total up the claims payments not by the name of the company, as in Figure 1, but instead by the location of the parent company's headquarters. Fortunately, all three of FCA's possible home bases are in one region -- Europe -- so there is no confusion about who goes where.
The big news is that in 2018, auto manufacturers based in Europe accounted for more than half the world's warranty claims. That happened at least twice before: in 2013, and again in 2017. And it's a trend that's closely tied to the presence of those luxury brands that Germany in particular is known for. But it's never before been published as a fact, based on hard data.
Figure 7
Worldwide Auto Manufacturers
Claims Paid per Year by Home Office Location
(in millions of US$, 2009-2018)
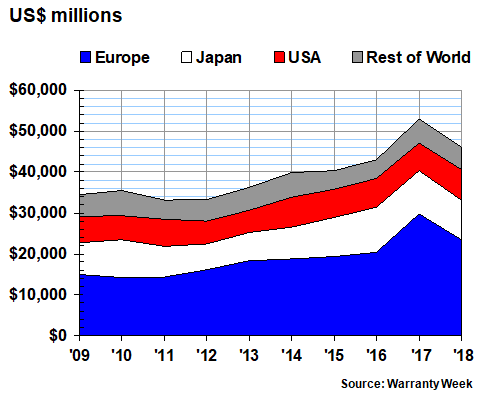
Also, while Japan's share was 21% in 2018, that's actually at the low end of the country's ten-year trend. Japan's share of claims was nearly 26% in 2010, for instance. The U.S. share, meanwhile, does not include Chrysler during this decade, because it has been a part of Fiat ever since it emerged from bankruptcy in 2009. And without it, the U.S. share never crossed the 20% mark, at least not since 2009.
But what this also means is that companies based in Japan and Europe have together paid between two-thirds and three-quarters of the world's warranty claims in each of the last ten years. The U.S., which could almost be folded into the Rest of World category, has not accounted for more than a fifth since at least 2009. And this might actually be a good thing, if having lower expense rates than your competitors is something to be celebrated.
However, in Figure 7, it's very important to note that the region of origin refers to the headquarters location of the parent company, not the place where the cars were actually made or sold. Therefore, all the SUVs manufactured and exported by BMW from its Spartanburg plant in South Carolina are counted as European, because the company is headquartered in Germany. And all the vehicles made in the U.S. in factories owned by Toyota and Honda are counted under the Japan heading, because that's where their claims are ultimately reported. Likewise, all the world's imports and exports are reported based on the location of their parent company, not where the vehicles were made or sold.
The vast majority of the claims paid by manufacturers that landed in the "other" category are from Hyundai, Kia, and Tata, as well as from a dozen manufacturers based in China. But it's important to remember that there are also local auto manufacturers based in Brazil, Iran, Kenya, Malaysia, Russia, and elsewhere, and they're also presumably paying claims. Too bad they're not publishing their warranty expenses. If they did, maybe someday we could raise our level of confidence in the accuracy of the data from 96% to 100%.