


Construction Equipment Warranties Worldwide:
Unlike the automotive or civil aviation industry, a large chunk of the construction equipment industry worldwide does not report its warranty expenses. Still we did our best to fashion an industry estimate for their warranty expenses, relying on industry sales data to help plug the gaps.
Like the automotive industry, the manufacturing of construction equipment is shifting towards Asia, especially to China. But while there are nine major construction equipment companies based in China, only two report their warranty expenses to investors. For the rest, we must guess.
Meanwhile, for most of the European and American manufacturers, and even for some of the Japanese manufacturers, construction equipment is just a small portion of product lines dominated by cars, electronics, farm equipment, trucks, and tools. So when putting together a worldwide estimate, we would need to apportion only a fraction of their warranty expenses to the construction equipment industry.
The Yellow Table
For help with the assembly of our warranty expense estimates, we turned to the IC Yellow Table, published annually by the online magazine International Construction. The latest edition of the Yellow Table, published in the 15 April 2019 issue of the magazine, pegs the worldwide construction equipment revenue of the top 50 manufacturers at US$185 billion in 2018, a 14% increase from 2017 levels.
We cross-referenced the names of the companies in the Yellow Table to our own product warranty expense records and found that 23 out of the top 50 construction equipment manufacturers include details about their claims and accruals in their annual reports. And we calculated that they accounted for upwards of 70% of the industry's total revenue. So we calculated some totals for the 70% that we know, and tabulated a worldwide figure for construction equipment claims and accruals by estimating expenses for the remaining 30%.
The first thing we needed to do was to translate the warranty expense figures for all the international companies into U.S. dollars. Among the 23 expense-reporting companies, we have manufacturers that report their financials in not only American dollars, but also in Canadian dollars, Japanese yen, Chinese yuan, Korean won, Swedish kronor, and European euro. And so, we relied on the yearly average currency exchange rates used by the U.S. Internal Revenue Service to help us make the translations correctly.
From each manufacturer's annual report, we collected four essential metrics: warranty claims paid per year, accruals made per year, the amount of reserves held at the end of each year, and the amount of construction equipment sold (in US dollars).
Using the sales figures, we calculated the claims and accrual rates, as a percentage of revenue. But for some of the companies that also sell agricultural equipment or mining equipment, such as Caterpillar, Volvo and Deere, we extrapolated their construction-only warranty expense data using the Yellow Table sales figures as a guide.
Worldwide Warranty Claims
In Figure 1, we're detailing the distribution of the industry's estimates $2.44 billion total for claims payments made in 2018. We should note that some of the companies, such as Komatsu Ltd., are on fiscal years that ended on March 31, 2019. So the chart includes a little bit of early 2019 spending by these companies, and excludes some expenses from the first quarter of 2018.
Figure 1
Top Construction Equipment Makers Worldwide
Share of Claims Paid
(percent of US$2.44 billion total in 2018)
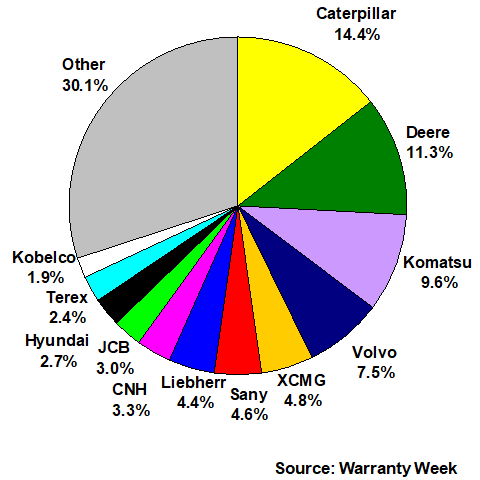
The $2.44 billion total for 2018 represents a 4.7% increase from 2017 levels. Of the 12 companies named in the pie chart, we have firm warranty expense figures for seven of them. However, the amounts listed for XCMG, Sany, Liebherr, JCB, and Kobelco are our own estimates. Within the 30% listed as "other," we have firm warranty expense reports for 16 more construction equipment companies, including Astec, Doosan, Kubota, Lonking, Manitowoc, Metso, Oshkosh, Sandvik, and Zoomlion Heavy Industry. However, the pie chart is crowded enough with the slices going down to Kobelco's estimated 1.9% share.
For the companies that we do know the exact expenses, some cut their claims cost by huge amounts. For example, Doosan's claims cost fell by 86%, while the Haulotte Group saw a 68% decline. Caterpillar, although it remains the largest claims payer in the industry, saw its annual cost fall by 35%. So did Metso Corp.
Lonking Holdings Ltd., meanwhile, reported the largest increase in claims cost, followed by Deere, Komatsu, and Kubota. But for the 23 companies for which we have expense reports, the claims total fell by $67 million from 2017 to 2018. It was the $177 million increase estimated for the others that turned the tide, resulting in a $110 million increase overall.
In Figure 2, we are detailing the relationship between the companies for which we have firm expense reports and those for which we are making estimates. Because sales for some of those companies that do not release their warranty expenses are growing faster than for those that do release their expenses, the estimated share grew to nearly 40% of the total in 2018, up from 33% in 2017 and 27% in both 2015 and 2016. In other words, the level of uncertainty about the total is growing as Chinese companies such as XCMG and Sany grow faster than the industry average.
Figure 2
Top Construction Equipment Makers Worldwide
Claims Paid per Year
(in US$ millions, 2009-2018)
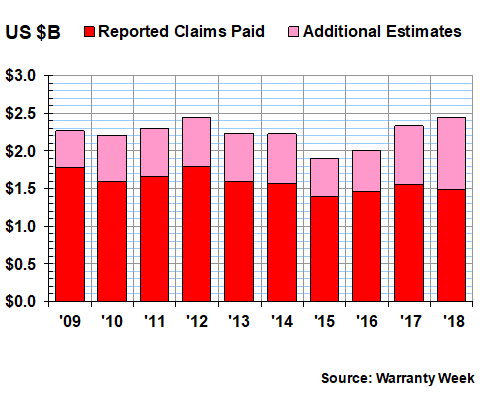
We note that the estimated industry total of $2.44 billion in 2018 claims paid is fractionally higher than the total in 2012, making last year the biggest of the past decade. However, the 2008 total of $2.61 billion in claims paid is not included in the 10-year look back, so it would be inaccurate to call this the highest annual total ever.
Worldwide Warranty Accruals
In Figure 3, we're looking at the shares of the top 12 manufacturers in terms of the amount of warranty accruals they made during 2018 for the construction equipment they sold. Of the $2.95 billion total, we estimate that with this metric, Volvo AB came out on top with a 13.6% share, followed by Caterpillar with an 11.5% share. That's partially due to the Yellow Table's estimate of a decline in Caterpillar's construction equipment sales, and partly due to a massive nearly doubling of Volvo's annual accruals, driven in part by increasing sales.
Figure 3
Top Construction Equipment Makers Worldwide
Share of Accruals Made
(percent of US$2.95 billion total in 2018)
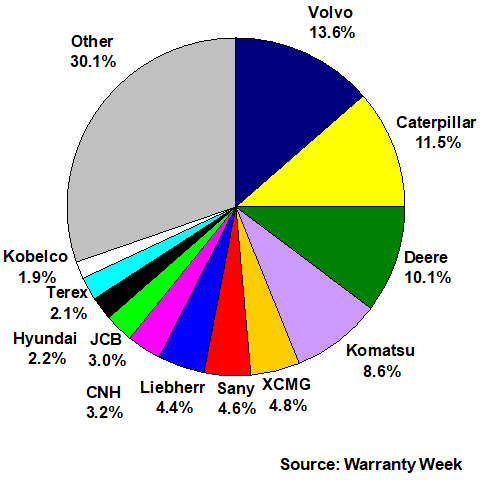
Others that reported large increases in their accruals include Takeuchi, Lonking, and Deere. Others that reported large cuts in their accruals include Wacker Neuson, Sandvik, and Doosan. For the 23 companies that we have firm expense reports in hand, accruals declined by $82 million. But once again, those up-and-comers that do not report their expenses are estimated to have increased both their sales and their accruals, leading to an overall $112 million increase for the industry as a whole.
In Figure 4 we're detailing these estimated industry totals for the last 10 years. This time, 2018 is the clear leader, topping even the $2.88 billion tabulated for 2008. But as the chart shows, the big increase was in 2016-2017, when construction equipment manufacturers boosted their accruals by $728 million, a 35% increase. Last year's industry-wide increase amounted to just 3.9%.
Figure 4
Top Construction Equipment Makers Worldwide
Accruals Made per Year
(in US$ millions, 2009-2018)
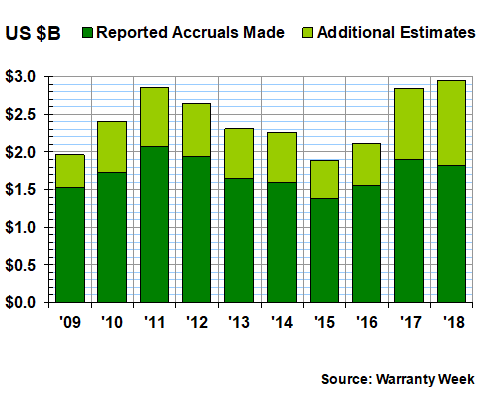
Note that the estimated portion of the industry total is also increasing. It was only a third in 2017, but it grew to 38% last year. And again, that's due primarily to the rising sales of Chinese companies that do not report their warranty expenses: Sany, XCMG, LiuGong Machinery, and four others. Only two Chinese construction equipment manufacturers include warranty expenses in their annual reports: Lonking Holdings and Zoomlion Heavy Industry.
In fact, the Yellow Table estimates that sales for the nine Chinese manufacturers in the top 50 grew by 34% last year, versus 14% for the industry as a whole. We estimate that their claims grew 24% while their accruals rose by 33%, as opposed to increases of 4.7% and 3.9%, respectively, for the industry as a whole.
Warranty Expense Rates
Without even looking at Figure 5, one could surmise what might have happened to warranty expense rates if sales rose faster than claims or accruals. The warranty expense rates, calculated by dividing one by the other, both fell. And that's exactly what we see happening in the chart below: the claims rate fell from 1.5% to 1.3%, while the accrual rate fell from a little over 1.6% to just below 1.6%.
Figure 5
Top Construction Equipment Makers Worldwide
Average Warranty Claims & Accrual Rates
(as a % of product sales, 2009-2018)
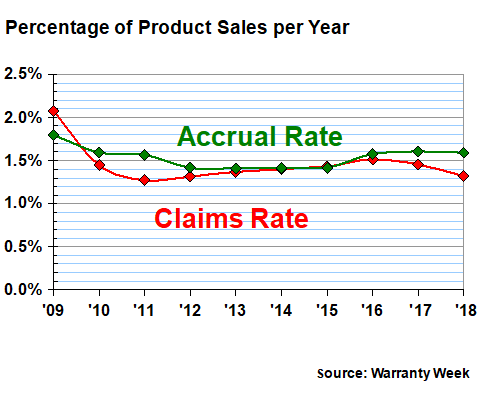
For much of the past decade, however, warranty expense rates in the construction equipment industry have been slightly above or slightly below 1.5%. So there's nothing out of the ordinary for the latest measurements. The most recent claims rate is a little below the long-term average for the industry, but the latest accrual rate is spot on that mark. In fact, if we exclude 2009, there's been very little deviation from the long-term averages in the last nine years.
Worldwide Warranty Reserves
In Figure 6, we're looking at the balance left in all of the warranty reserve funds held by all of the construction equipment manufacturers at the end of each of the past ten years. At the end of 2018 (March 2019 for Komatsu and a few others), the balance was $4.37 billion, up by about $352 million from the end of 2017.
Figure 6
Top Construction Equipment Makers Worldwide
Reserves Held per Year
(in US$ millions, 2009-2018)
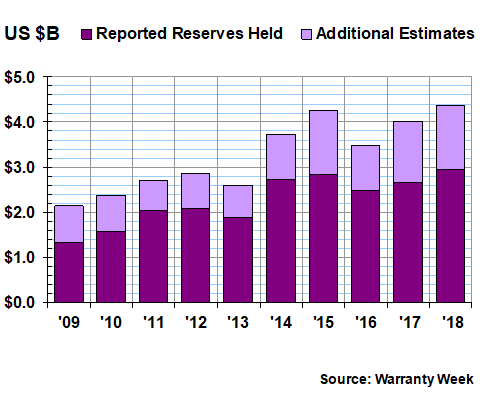
With this metric, however, we're estimating that the balance grew slightly faster for the 23 companies that do in fact release their warranty expense reports, compared to those that don't. The balance for those who report grew by $281 million to $2.95 billion, while we estimate the balance for the rest grew by $71 million to $1.42 billion. Overall, the balance was up by 8.7%, surpassing the previous high water mark set in 2015.
Among the known reporters, Caterpillar, Deere and Volvo maintained the largest balances. Metso, Volvo, Haulotte and Deere grew their balances the fastest. Caterpillar and Astec reduced their balances the fastest. Increases outnumbered decreases by a wide margin.
We should also note that construction equipment sales for some of these companies such as Hyundai, CNH and Hitachi is a small portion of their total product sales. And so we are allocating only a small portion of their warranty reserves to the construction equipment industry. For others such as Haulotte, Manitou, Manitowoc, and Terex, construction equipment is all they do, so all their reserves are counted as construction equipment industry reserves.
As far as the estimates for the non-reporters, that actually shrank a bit last year, from just over a third of the total in 2017 to just under a third in 2018. Among the largest of them, we estimate that reserves grew fastest for Sany and LiuGong, and slowest for Liebherr, Kobelco, and JCB.


