Apple & Tesla Warranty Accounting:
The third quarter numbers are coming in fast and furious now, and some investors and stock analysts are treating the warranty expense data as a leading indicator of a company's financial health. But there are limits to how quickly some bad numbers can turn into a trend or a scandal.
The good news is that investors and stock market analysts are paying more attention to the ups and downs of the warranty expenses of manufacturers. The bad news is that they sometimes invent trends the data doesn't fully support, or worse, they use those theories to help short sellers profit by spreading what sounds like bad news.
Apple filed its annual report for the fiscal year ended September 28 with the U.S. Securities and Exchange Commission last Thursday. Tesla filed its third calendar quarter financial report with the SEC last Tuesday. Almost immediately, headlines began popping up, suggesting that "Apple May Have Sandbagged Margins," and for Tesla, "Warranty Expenses: Something Unusual?"
We looked for something unusual. We're still looking. So while we continue our search, we thought it might be a good idea to give all our readers all the data, so you can look too. So what we did is to extract all the figures from the quarterly and annual reports of both Apple and Tesla that detail the amount of claims paid, accruals made, reserves held, and products sold. Using the latter figures, we also calculated claims rates (claims / sales = %) and accrual rates (accruals / sales = %).
Warranty Claims
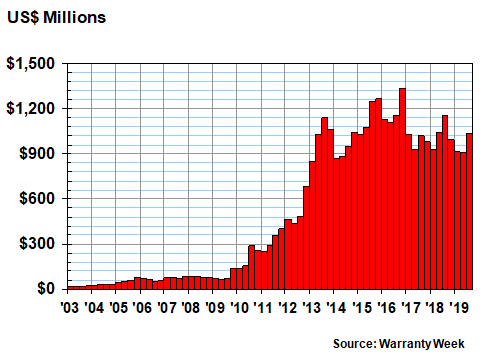
During the months of July, August and September 2019, which map to the fourth quarter of Apple's fiscal year, the company once again paid out more than $1 billion in claims. Those quarterly totals were a bit under $1 billion during the first nine months of the fiscal year, but were slightly above it during the second half of the previous fiscal year.
In Figure 1, we have charted the claims totals for the last 17 fiscal years, some 67 quarters in total. Apple's quarterly claims cost has exceeded $1 billion in 17 of the last 27 quarters, and has risen as high as $1.33 billion and fallen as low as $847 million. The most recent quarter's $1.03 billion total is therefore quite unremarkable.
Figure 1
Apple's Product Warranties
Claims Paid per Quarter, 2003 to 2019
(in Millions of U.S. Dollars)
In Figure 2, we're looking at the quarterly total for accruals made. This chart pattern is much more irregular, and is indeed some cause for concern. But what's concerning is how Apple seems to accrue a huge amount during the months of October, November, and December, which map to the first quarter of its fiscal year.
Figure 2
Apple's Product Warranties
Accruals Made per Quarter, 2003 to 2019
(in Millions of U.S. Dollars)
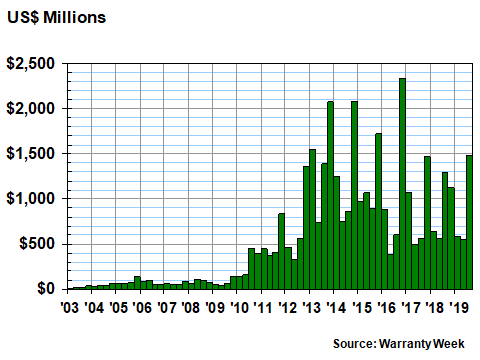
It could be the Christmas shopping seasonal effect that's driving up the Oct.-Dec. numbers, or it could simply be an effort to make up for accrual shortfalls from the last fiscal year in the spring and summer. Or it could be a way to get ahead of the game early in the year, so the company could then lighten up on accruals in the middle months.
But either way, the amount a company accrues for warranty is determined by the company's actuarial experts, based on numerous factors, including product sales and past and predicted claims costs. So theoretically, a company is free to adopt any methodology it wants, as long as it details that methodology somewhere in its financial statements. They could decide to make accruals only in months that have the letter R in their names. There are no wrong answers.
Apple's warranty accounting methodology is spelled out on page 26 of its annual report:
Warranty Costs
The Company offers limited warranties on its new hardware products and on parts used to repair its hardware products, and customers may purchase extended service coverage, where available, on many of the Company's hardware products. The Company accrues the estimated cost of warranties in the period the related revenue is recognized based on historical and projected warranty claim rates, historical and projected cost per claim and knowledge of specific product failures outside the Company's typical experience. The Company regularly reviews these estimates and adjusts the amounts as necessary. If actual product failure rates or repair costs differ from estimates, revisions to the estimated warranty liabilities would be required.
That's all it takes. That's compliance. It provides no details about the calculations it makes, or how it estimates are made. Nor does it reveal any information about the average historical or projected cost per claim. It just merely says they exist.
Unfortunately, there's no way for an external observer to check their math. And, like a weather forecast, the amount of accruals made cannot be called "right" or "wrong" until some time has passed. So arriving at a conclusion that Apple is somehow sandbagging its earnings only a week after those earnings are announced is either very brave or very foolish (but we won't know which it is for a while).
Theoretically, Apple could be "sandbagging earnings" by making more accruals than is necessary, and thereby reducing net income. Or maybe not. But who's to say what's necessary? In the fourth quarter of its most recent fiscal year, Apple's warranty accounting experts believed that $1.48 billion in accruals would be necessary. In the second and third fiscal quarters, they believed that $583 million and $548 million were necessary. And in the first fiscal quarter (October-December 2018), they believed that $1.12 billion was necessary. Who can say which of those four very different amounts was right, and which were wrong?
Warranty Reserves
In Figure 3, we're looking at the end-of-quarter balance in Apple's warranty reserve fund, which is the sum of all the accruals made, claims paid, and any additional adjustments made for currency fluctuations, acquisitions, or corrections made for past over- or under-accruals. Notice that the balance peaked at $5.24 billion at the very end of calendar 2015 and has more or less been declining ever since.
Figure 3
Apple's Product Warranties
Reserves Held per Quarter, 2003 to 2019
(in Millions of U.S. Dollars)
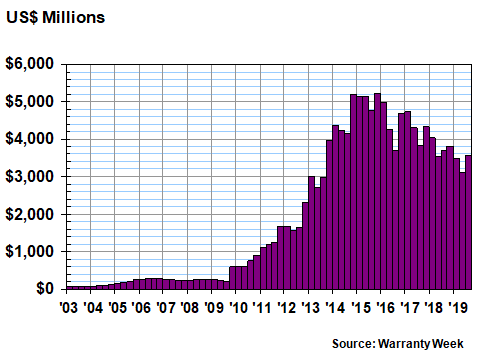
At the end of this fiscal year, on September 28, 2019, the balance stood at $3.57 billion, down from $3.69 billion at the end of the previous fiscal year. But it was higher than both those measures in December 2018, and was lower than both in March and June of 2019. Again, there is no "right" balance. But in Figure 3, there's really nothing unusual to see except for the years-long decline.
Extended Warranty Sales
Up until this year's annual report, Apple used to disclose both the number of units it sold for the iPhone, Macintosh, and other product lines, as well as the amount of long-term deferred revenue it was holding related to sales of AppleCare protection plans. In this annual report, it stopped disclosing both.
It did, however, include some hints and clues in other charts that helped us make some wildly speculative guesses as to AppleCare sales volumes. The problem is, its hints and clues also include gift card sales, which have nothing to do with extended warranties. So we had to make some guesses as to the separation between the two, which results in Figure 4.
Figure 4
Apple's Protection Plans:
Service Contracts vs. Gift Cards Sales
in Fiscal Years 2003 to 2019
(in Millions of U.S. Dollars)

Essentially, we're suggesting that AppleCare was a $7.25 billion program worldwide in fiscal 2015 (the months of October 2014 to September 2015), its peak year. We estimate that AppleCare sales declined during the next four fiscal years, falling to $5.23 billion last year. But don't shed a tear -- it's still the world's largest extended warranty program.
AppleCare vs. Product Warranty
We have one more Apple chart to share. Figure 5 details the quarterly claims rate and accrual rate for the company, as well as an annual measure of AppleCare sales compared to product sales. The claims and accrual rates are based on Apple's own figures. The AppleCare figures are Warranty Week estimates, based on our tenuous and frequently erroneous grip on generally accepted accounting principles.
Figure 5
Apple's Protection Plans:
Claims Paid, Accruals Made & AppleCare Sales
as a Percentage of Product Revenue, 2003 to 2019

One can readily see, however, that there seems to be much less chaos in the made-up data (the blue line) than there is in the calculated data (the red and green lines). Part of the reason is the fact that the AppleCare percentages are done once a year while the others are quarterly. But the real reason is the fact that the amounts in Figure 2 are erratic, while the amounts in Figures 1, 3 and 4 are not.
Tesla's Warranty Accounting
While Apple was accused of "sandbagging" earnings (weighing them down by driving up expenses such as warranty), Tesla was accused of doing the opposite: driving expenses down so it could record a profit.
Analysts expected Tesla to lose money, and the short sellers expected to make money when Tesla lost money. So weren't they surprised when Tesla instead reported $150 million in net income on $6.3 billion in total revenue?
Suspicion immediately homed in on a -$37 million warranty adjustment, listed as "Net changes in liability for pre-existing warranties, including expirations and foreign exchange impact." Effectively, Tesla removed $37 million from its warranty reserve fund, correcting for past over-accruals. But it also made $138 million in what we'll call "normal" accruals, and spent $59 million in claims.
Tesla has been reporting its warranty expenses since 2008. But it didn't start making corrective adjustments to its reserve balance until 2013. In the 27 quarters since the start of 2013, it has added extra money 15 times, taken money out 11 times, and made no adjustments only once.
In the just-concluded quarter, Tesla made $138 million in "normal" accruals, down by a massive $49.8 million from the third quarter of 2018, and down by $15.2 million from the second quarter of 2019. Product revenue, which does not include leases or service revenue, stood at $5.5 billion, which was down from both the previous quarter and the year-ago quarter. So its accrual rate is now 2.5%, down from 3.0% a year ago and from 2.8% at midyear in 2019.
In Figure 6, what we've done is list the "normal" accruals in green, and add the positive or negative adjustments in blue, at the top or bottom, as appropriate. Tesla is on the calendar year, so each group of four columns represents a 12-month period.
Figure 6
Tesla's Product Warranties
Quarterly Accruals Made, 2013 to 2019
(in Millions of U.S. Dollars)
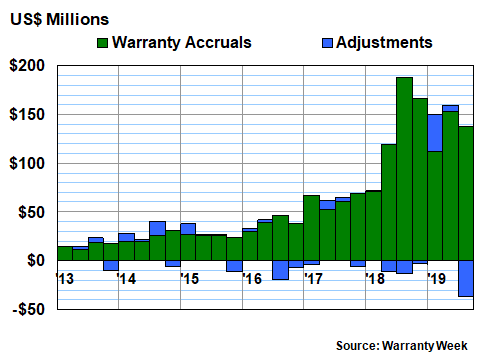
Also, from even a quick glance at the chart above, it's clear that last quarter's -$37 million downward change in estimate was the largest negative adjustment the company has ever made. However, it's not the largest adjustment ever. That title would go to the +$37.75 million positive adjustment that Tesla made in the first quarter of 2019. The plot thickens!
In that quarter, Tesla lost nearly $668 million on $4.54 billion in revenue, so nobody took any notice of its upward adjustment in warranty expenses. But what it meant is that in the first quarter of this year, the company made its usual warranty accrual of $112.5 million, and then made an additional accrual of $37.75 million to correct past under-accruals.
Looked at with the aid of our tenuous grip on generally accepted accounting principles, it's as if Tesla made more than $150 million in accruals during that first quarter ($112.5 + $37.75). And it's as if it made only $101 million in accruals in the third quarter ($138 - $37).
Net Additions to the Reserve
Let's pretend that there's such a thing as "net additions" when it comes to warranty accounting. That figure would consist of all the "normal" accruals, plus or minus all the adjustments. And rather than calculating the accrual rate by dividing the "normal" accruals by sales, we'll calculate the net addition percentage rate by dividing this new metric by sales. So it will always be higher or lower than the normal accrual rate, depending on whether the adjustments are up or down.
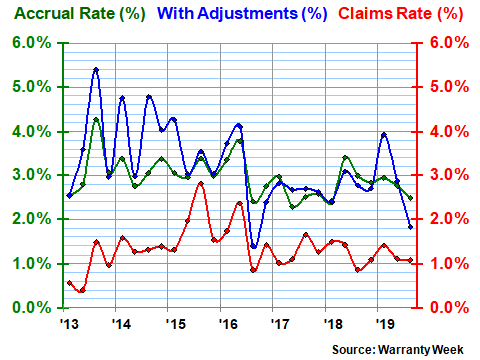
In Figure 7, this is what we've done. There are the usual red and green lines for the "normal" claims and accrual rates, and there is a third blue line that reflects all the plus-or-minus adjustments. For instance, in the most recent quarter, while Tesla's "normal" accrual rate is 2.5%, the rate after the downward adjustment is only 1.8%. And that's the second-lowest adjusted rate of the last 27 measurements, surpassed only by the third quarter of 2016, when a $19.5 million negative adjustment drove the blue line down to 1.4%.
Figure 7
Tesla's Product Warranties
Claims Paid & Accruals Made as a
Percentage of Product Revenue, 2013 to 2019
(in Percent)
There is a problem with this dubious methodology, however. It has to do with the timing of these adjustments. And by that we don't mean any suspicious correlation with net income or earnings per share. What we mean is that these adjustments are correcting over- or under-accruals in past quarters, not in the current quarter. So adding them to accrual amounts made in the current quarter, which are driven by current sales, and then recalculating the accrual rate, mixes the old with the new in a tangled mess.
In other words, Tesla's true accrual rate during the third quarter was 2.5%. The $37 it removed from its warranty reserve fund last quarter was correcting the amounts over-accrued in some past quarter(s). Which quarters we don't know, because the company does not disclose that detail. But it might have been last year's second quarter, in which perhaps too much was accrued. Or it could have been the second quarter of 2016, when the accrual rate was 3.8%. Or maybe the company's actuarial experts realized the $37.75 million they added during the first quarter of 2019 was unnecessary, so they reversed it.
Long-Term Averages
As external observers, we'll never know. And we'll never be able to correctly revise the past or present accrual totals to account for these adjustments. The best we can do is to look at the long-term averages, and measure deviations above or below that level. Tesla's average accrual rate since 2013 has been just under three percent, so by that measure, it's doing well, turning in its fourth below-average quarter in a row (last year's third quarter accrual rate was just a hair above average).
The point is that companies make adjustments to their warranty reserve balance all the time, but it only looks suspicious when the net benefit of the adjustment approximates net income. What we'd suggest is an even bigger problem is when a company consistently under-accrues, depleting their reserves as claims are paid, and then suddenly makes a massive upward adjustment, correcting all at once for those past "mistakes."
Industry analysts typically dismiss it as a "one-time charge," and compare this year's earnings (adjusted to ignore the charges) to what amounts to past years' inflated earnings (which are never adjusted to include the expenses that were overlooked). Send us to accounting jail, but that sounds like a deliberate effort to mislead.