Nine-Month Car & RV Warranty Trends:
Warranty claims and accruals are up for U.S.-based consumer vehicle companies. This industry wasn't hit as hard as many others in the pandemic, but things seem to be back to normal, despite recalls and technological challenges.
The automotive industry produces over half of all warranty claims and accruals from United States-based companies. Naturally, the pandemic had a profound effect on consumers' vehicle usage; the commutes of many who drove to work transformed to a simple walk to another room. On the other hand, many who regularly took public transportation opted to use their personal vehicles in order to avoid public spaces. And when the price of used cars began to skyrocket, regular vehicle maintenance took on a more important role to many consumers. So while we wait for the release of the 2022 annual reports, let's take a look at the data up to the third quarter of 2022 from the U.S.-based companies in two key aspects of this industry: passenger cars and recreational vehicles (RVs).
Historically, roughly one-third of all claims and accruals from U.S.-based companies have been reported from the three leading passenger car manufacturers: Ford Motor Co., General Motors Co., and Tesla Inc. The first two, of course, have been mainstays of U.S. manufacturing for decades, and the latter is a burgeoning relative newcomer to the industry.
Another smaller, but important, aspect of American automotive manufacturing is the RV industry, which became all the more relevant during the pandemic, when many who would have flown in the past opted for road-trip-style vacations, and the U.S. National Parks recorded record-breaking visitation across the board. The four key companies we will look at in this industry are Rev Group Inc., Skyline Champion Corp., Thor Industries Inc., and Winnebago Industries Inc.
Passenger Car Claims
Before we go on, we should mention that while we also track the European and Asian car manufacturers, they only report their data once per year, and many of these companies don't file their annual reports until February or March. While we await their annual reports for our analysis of the global passenger car industry, we are looking at United States-based companies for this midyear report. Note that Chrysler is now a part of the European Stellantis N.V., following the official merger of Fiat Chrysler Automobiles NV and Peugeot SA in early 2021. This conglomerate includes the "American" brands of Chrysler, Dodge, Ram, and Jeep, which haven't actually been controlled by an American company in about a decade, since the merger of Fiat and Chrysler back in 2014.
In terms of U.S.-based passenger car companies, the top three are General Motors, Ford, and Tesla, though as seen in Figure 1, Tesla only accounts for a small sliver of the industry's claims.
Figure 1
Passenger Car Warranties
Claims Paid by Top U.S.-based Manufacturers
(in US$ millions, 2012-2022)
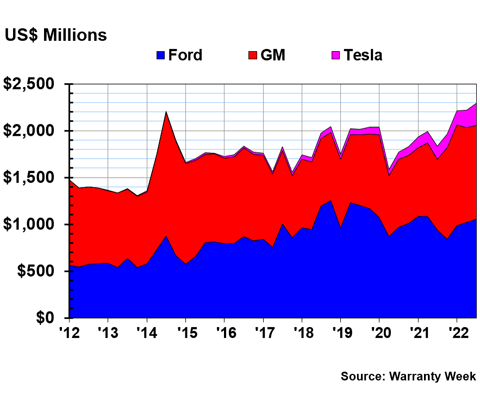
We can see that while claims dipped sharply at the beginning of 2020, they increased for the rest of that year and into mid-2021, though they did not quite reach the pre-pandemic levels. Ford was the largest claims-payer of the group in the middle of 2022, spending $1.06 billion in the third quarter and $3.06 billion in the first nine months of 2022. This was just about on-par with its claims spending for the first nine months of 2021. General Motors spent just about $1 billion on the nose in the third quarter of last year, and bout $3.09 billion for the first nine months of the year, an increase of 36% compared to the same period in 2021. This was a big increase for GM, which surpassed Ford in warranty claims payments for the first time in a little less than five years.
Tesla saw an even bigger spike in claims payments in the first nine months of 2022, up 51% compared to the same period in 2021. Tesla spent $574 billion on claims in the first three quarters of last year. It spent $236 billion on claims in the third quarter alone, a 69% increase compared to the same quarter in 2021. These numbers actually do not include the increased claims we can assume have arisen since it released its "Full Self-Driving" beta program to all users in November of 2022, which led to widely publicized crashes such as the eight-car pileup on the San Francisco-Oakland Bay Bridge in the same month. However, as we will see in Figure 2, Tesla is actually rather good at predicting its claims relative to sales, as its warranty accruals increased by similar rates over the same period.
Passenger Car Accruals
Ford and GM's warranty accruals were actually much more erratic than their claims during the pandemic. Usually accruals are proportional to sales, explaining the deep trough seen during the first half of 2020 in Figure 2. However, it looks like the top two U.S.-based passenger car companies have struggled in predicting their warranty expenses since then.
Figure 2
Passenger Car Warranties
Accruals Made by Top U.S.-based Manufacturers
(in US$ millions, 2012-2022)
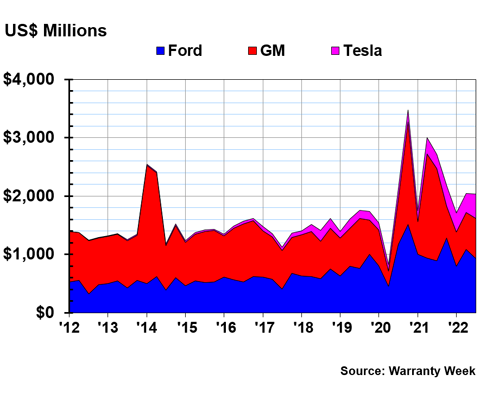
Warranty accruals were down a whopping -51% for GM over the first nine months of 2022, compared to the year prior. While they put aside $3.9 billion in accruals during that period in 2021, they only put aside $1.9 billion in 2022. Ford, on the other hand, stayed on par with its accruals from the year prior, putting aside $2.8 billion in the first nine months of 2022, almost exactly the same number as the year prior. Tesla, on the other hand, saw a big increase in accruals of +50%, putting aside $1.1 billion in the first nine months of 2022. But as we noted earlier, this was very consistent with their increase in warranty claims during the same period.
Ultimately, we see that both Ford and GM drastically decreased their warranty accruals in the second quarter of 2020, just to dramatically increase accruals for the next two quarters to make up for it. And then they both sharply decreased their accruals in the first quarter of 2021. Since then, Ford has evened out and remains rather steady, but GM has seen even more oscillations, making huge accruals in the second and third quarters of 2021, and then reducing its accruals by about two-thirds at the end of 2021.
This is especially surprising to see from such large established companies, which have demonstrated a strong ability to regulate these metrics. While new car sales decreased during the pandemic, consumers were more motivated to bring in their personal vehicles for maintenance, most likely in response to the rising prices of both new and used cars. In other words, keeping their current car running became more important to consumers, and it seems like Ford and GM did not expect this, and scrambled a bit in the past three years to accurately predict their warranty expenses.
Passenger Car Expense Rates
The relationship between sales and our two tracked metrics, warranty claims and accruals, is shown in Figures 3 and 4 below. Figure 3 shows the claims rates of these three companies as a percentage of product revenue.
Figure 3
Passenger Car Warranties
Claims Rates for Top U.S.-based Manufacturers
(as % of product revenue, 2012-2022)
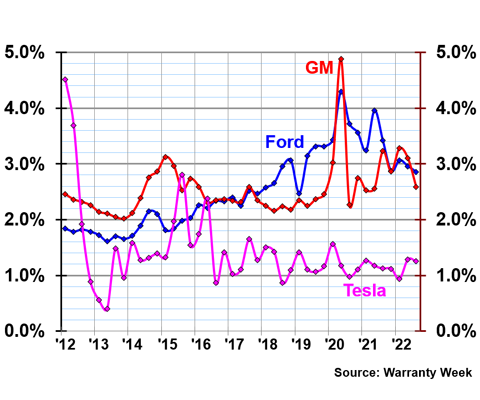
Here we see that while claims fell for all three companies in early 2020, product revenue fell even faster, resulting in the claims rates actually increasing. Since then, their claims rates have smoothed out, though they remained unusually high for the past two years, especially in the case of Ford.
In the third quarter of 2022, Ford saw a claims rate of 2.86%, back down to a more typical level after two years hovering above three percent. This is back in line with the gentler upward trend we saw from Ford pre-pandemic. GM had a claims rate of 2.59% in the third quarter of 2022, again back on-trend after two years of anomalies.
Conversely, Tesla's claims rate actually increased in the middle of 2022, as it continues to roll out beta software that usually prove to have a few unresolved kinks. So while its overall sales have gone up, its claims have gone up even more, measuring 1.25% in the third quarter of 2022.
In Figure 4, we see that accruals as a percentage of product revenue have been even more anomalous, especially in the case of GM.
Figure 4
Passenger Car Warranties
Accrual Rates for Top U.S.-based Manufacturers
(as % of product revenue, 2012-2022)
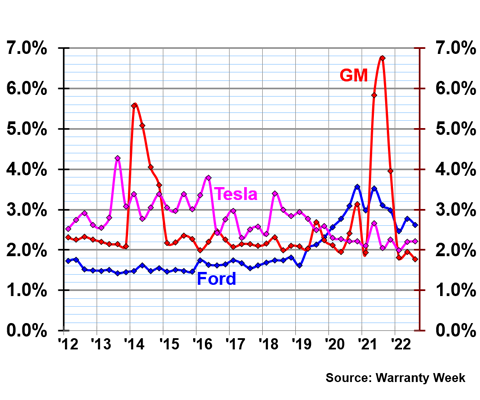
The accruals rates were down for both Ford and GM last year in comparison to 2021. It's hard not to notice the huge spike in accruals GM saw in 2021, which required us to increase our scale. This was the result of GM's huge recall of 2021 Cadillac, Chevrolet, and GMC SUVs. It looks like GM has recovered rather well from those recalls, with an accruals rate of 1.77% in the third quarter of 2022. In the same quarter, Ford saw an accruals rate of 2.62%, again back on-trend after the anomalies of the pandemic. Tesla's accruals rate of 2.21% shows that they seem to have figured out their formula after measuring more erratic figures in the early to mid-2010s.
Passenger Car Warranty Reserves
In Figure 5, we see that passenger cars is yet another industry where warranty reserves continue to increase to unprecedented levels.
Figure 5
Passenger Car Warranties
Reserves Held
(in US$ millions, 2003-2022)
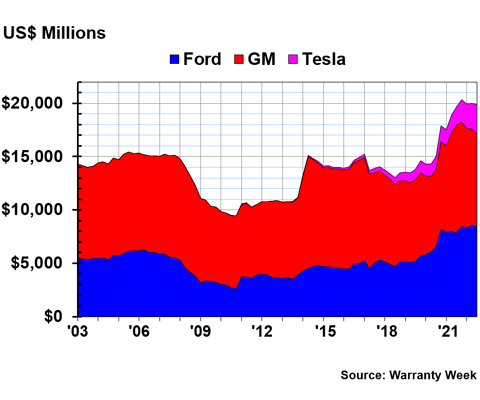
Figure 5 shows the amount of warranty reserves held by Ford and GM since we began tracking these metrics back in 2003, as well as Tesla beginning in 2008. We note that for the past two decades $15 billion seems to have been an unofficial cap for these reserves, as seen in 2005-2008, 2014, and 2017. Warranty reserves increased for these companies in the second half of 2020, again surpassing that $15 billion ceiling. They are now well above $8 billion for both Ford and GM, and the total reserves between the three companies are now at a whopping $19 billion, even after GM dipped into these funds quite a bit during 2021. Tesla is also contributing several billion to the new total.
RV Claims Totals
In Figure 6, we are looking at warranty claims totals for the four top U.S.-based recreational vehicle companies, Thor, Winnebago, Skyline, and Rev Group. Rev Group did not begin reporting until 2016, before its stock started publicly trading in 2017. We see that RV claims have taken off since 2016, and continue to steadily increase after the dip in early 2020.
Figure 6
RV & Mobile Home Warranties
Claims Paid by Top U.S.-based Manufacturers
(in US$ millions, 2012-2022)
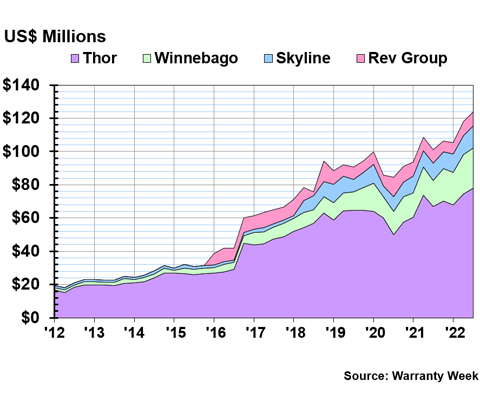
Thor, the largest U.S.-based company in this industry, saw $77.9 million in claims in the third quarter of 2022. For the first nine months of the year, it had $220.2 million in claims, up 10% compared to the same period the year prior. Winnebago saw the most significant growth in warranty claims during the first three quarters of 2022, up 42% to $67.7 million. Skyline was up 20% in the same period, reporting $35.9 million in claims. Rev Group, the smallest of the four, had $23.2 million in claims in the first three quarters of the year, down -7%.
RV Accrual Totals
Figure 7 shows the warranty accruals totals for these four companies since 2012. Again, we see that this industry has begun accumulating more money since 2016. Furthermore, we see that the big trough of 2020 has been followed by unprecedented highs in accruals in the past two years. If you've visited a National Park or campsite since the beginning of the pandemic, you'll know anecdotally that there have been more RVs on the road and more domestic tourists overall than ever before.Figure 7
RV & Mobile Home Warranties
Accruals Made by Top U.S.-based Manufacturers
(in US$ millions, 2012-2022)
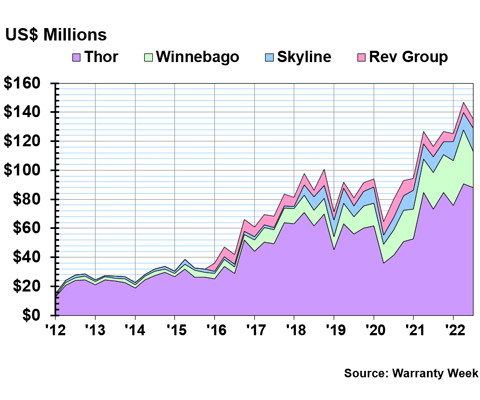
These accruals data follow the sales data rather closely for the past three years. In the first nine months of 2022, Thor saw a 21% increase in accruals to $254.5 million, compared to the same period in 2021. Winnebago was again ranked second, accruing $93.2 million in that period, a 37% increase compared to the first three quarters of 2021. Skyline was up 19% to $40.7 million in that period. Rev Group, however, was also down in accruals as well as claims, seeing a -21% drop in accruals to $19 million.
RV Warranty Expense Rates
When looking at claims as a percentage of total revenue, each of these four companies ended up in just about the same spot in the third quarter of 2022, the most recent for which we have data. Thor's claims rate was at 1.78%, Winnebago was at 1.76%, Skyline was at 1.64%, and Rev Group, again a bit of an outlier, was at 1.36%.
Figure 8 looks at these four RV companies' accruals totals as a percentage of their total product revenue. Again, we see that the four are all pretty close together, though there is a bit more variation.
Figure 8
RV & Mobile Home Warranties
Accrual Rates for Top U.S.-based Manufacturers
(as % of product revenue, 2012-2022)
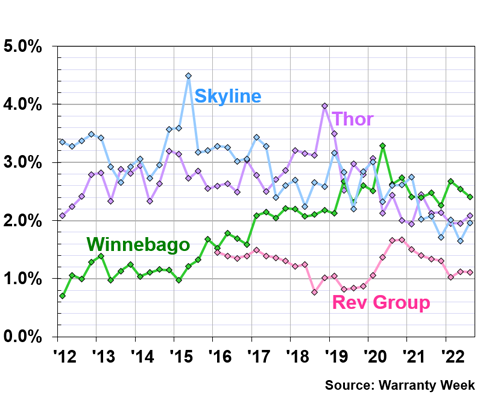
The three largest U.S.-based RV companies remained very steady with their accruals relative to their sales, though we notice that wintertime seems to be a bit of a boon for this industry. Thor's accruals rate was at 2.08% in the third quarter of 2022, staying consistent since the sales dip in early 2020. Notably, this is an industry that was perhaps hit less hard by the pandemic than many others in the United States. Winnebago had the highest accruals rates of the four, exceeding 2% for every quarter of 2022, and coming in at 2.41% for the third quarter. Skyline's accruals rate has been less consistent, and measured 1.96% in the third quarter. Rev Group's line is steadier, but its overall accruals relative to its sales are the lowest of the group, with an accruals rate of just 1.11% in the third quarter of 2022.