Warranty Claims Rates by Industry:The collected industry average claims rates for 23 product warranty categories over 16 years are sorted into high, medium and low-cost buckets, revealing a peculiar relationship between where the group is in the supply chain and how high or low their warranty expenses are.
Since March, we've been detailing the product warranty expenses of the top U.S.-based manufacturers, one industry at a time. And since 2003, we've been gathering statistics on the amount of claims, accruals, reserves, and product sales reported by each manufacturer.
What we'd like to do this week is gather all the 16-year industry averages in one place, so we can sort them into groups based on their high, medium, or low expense rates. While 1.5% is the average percentage of product sales revenue spent on warranty claims since 2003, there's quite a bit of volatility around that simple metric, depending on the type of product under warranty and the year in which the expense is measured.
The claims and accrual data are very similar, so we don't need to present both. Instead, we'll focus on claims this time around, and perhaps we'll present the accrual data next year. The reserve balances correlate with the typical length of warranty coverage and the expected severity of sudden spikes in cost, but we'll also leave that analysis for another day.
In the charts and tables below, we have gathered up the data from 11 different newsletters published between March 28 and June 13 (click here for a list) that detailed the warranty expenses of all the companies in a specific industry. First we published the aerospace and automotive reports, then we switched to some of the high-tech electronics sectors such as computers, telecom gear, and medical equipment. And then we wrapped it all up with a look at appliances and some of the building trades, and then the new homes themselves.
End-User-Facing OEMs and Their Suppliers
What we noticed is that across most industries, the end-user customer-facing companies tend to have the highest warranty expenses, while their suppliers tend to have lower expense rates. And then in certain industries, there's a select group of suppliers providing major components such as engines, avionics, heating/cooling systems or disk drives, that seem to have warranty expense rates somewhere in the middle between the OEMs and the suppliers.
We organize the warranty providers into three big sectors: vehicles, electronics, and building trades. In the charts below, the vehicle sectors are color coded in blue; the electronics are in red; and the building trades are in green.
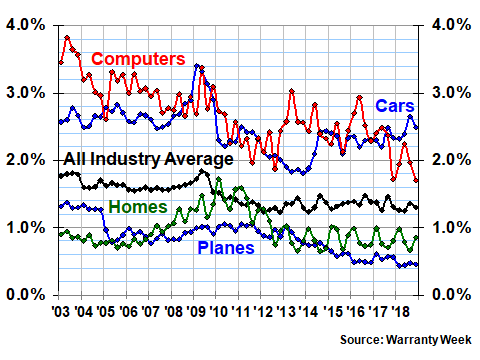
In Figure 1, we are tracking the average claims rates of four customer-facing industry groups: cars, planes, computers, and new homes. We are also including an all-industry average, in black, which represents not only groups in these four industries, but also hundreds of manufacturers in all other groups.
The vertical scale is percentage of sales, calculated by dividing the amount of claims paid by the amount of revenue earned from product sales. The horizontal scale is time, with 64 quarterly measurements taken of each average between the start of 2003 and the end of 2018.
As is clear by their relative position to the all-industry average and to each other, the computer and passenger car industries have relatively high warranty expenses. The commercial plane and new home groups are actually below average most of the time, despite their status as "OEMs," in the sense that they sell their products to the end user, be it a consumer or an airline.
Figure 1
Select U.S. Industry Sectors
Average Warranty Claims Rates
(as a % of product sales, 2003-2018)
In fact, the computer OEMs and the car and small vehicle OEMs have the highest average warranty claims rates out of all the industries we've looked at, with the computer manufacturers spending an average of 2.7% of their product revenue on warranty claims over the past 64 quarters, and the car manufacturers not far below at 2.5%.
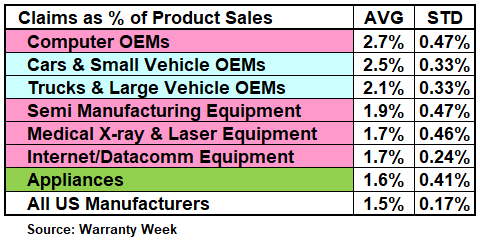
In Figure 2 we are listing the average claims rates for seven industry groups, as well as the all-industry average, alongside their respective standard deviations. This data point measures the volatility of the average over time. For instance, one can see that the computer OEM average in Figure 1 moves from a higher point, to a lower point, than does the car average.
High Cost and High Volatility
Hence, the standard deviation for the computer OEMs is relatively high, at 0.47%, which means the 64 quarterly data points are collectively either further above or further below the 2.7% long-term average than are the 64 car data points are from their 2.5% average.
At 0.24%, the standard deviation of the Internet/data communications equipment group is even lower, which means the 64 dots are even closer to that group's 1.7% average (see Figure 3 of the May 16 newsletter for a look at the full chart).
And the least volatile line of all is the one for all U.S.-based manufacturers, with an 0.17% standard deviation. And its long-term 1.5% average is almost exactly halfway between the extremes, which were 1.8% in 2003 and 1.3% in 2018. If it weren't based on so much published data, you'd think it was too symmetrical to be real.
Figure 2
Industry Sectors With High Claims Rates
Sixteen-Year Averages & Standard Deviations
(as a % of product sales, 2003-2018)
For what it's worth, these are the only seven industry groups that we've ever identified, whose long-term average warranty claims rates are above the all-industry average. However, there are at least 16 other industry groups whose averages are lower than 1.5% (actually, 1.479% if you want to get precise).
How can that be? That's because all of the largest warranty providers are counted as part of those groups, and their weight more than makes up for the weight of hundreds of others. In the car group, we have Ford and GM, and in the computer group we have IBM, HP, and Apple. In the truck group, we have Navistar, Paccar, Deere and Caterpillar.
In fact, it would be easier to make a list of all the large warranty providers who are not in one of the seven industry groups identified in Figure 1 as having above average warranty claims rates. They are GE, Cisco, Cummins, and United Technologies. And one could argue that Cummins should be counted in with the truck makers, despite its status as an engine supplier. So that leaves only two large warranty providers that are not in high-cost industries.
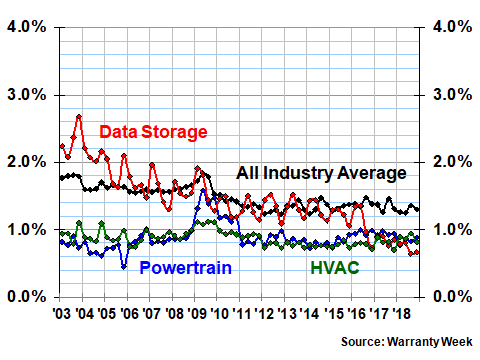
The Powertrain Industries
Speaking of engines, in Figure 3 we are charting three more industry segments, which we are going to suggest have something in common. Within their respective sectors (vehicles, computers, and new homes) they are the "engine" manufacturers -- the companies providing the "power" that "drives" the complete product delivered to the end user.
These groups include truck suppliers Cummins and Eaton, as well as boat engine maker Brunswick Corp., not to mention HVAC parent companies United Technologies, Johnson Controls, and Ingersoll-Rand, along with disk drive manufacturers Western Digital and Seagate. Together, they're the "powertrain" suppliers to the OEMs.
Figure 3
Select U.S. Industry Sectors
Average Warranty Claims Rates
(as a % of product sales, 2003-2018)
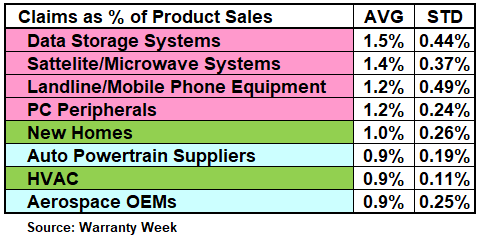
All three of these groups are among the eight we've included in Figure 4 below. These are the middle eight, with average warranty claims rates between 0.9% and 1.5%. Four come from the electronics sector, and two each come from the vehicle and building sectors.
Breaking the Pattern
Notice that two of these industries violate the 1) high, 2) midrange, and 3) low cost pattern matching with A) OEM, B) powertrain, and C) supplier. The new homes and airplanes are finished products sold to end users, yet they're not in the high cost group in Figure 2, where one would expect to find them. Instead, they're in the middle group, with average claims costs of 1.0% and 0.9%, respectively.
Likewise, the semiconductor manufacturing equipment group (comprised of companies such as Lam Research) should be in the low or midrange group, because of their early position in the supply chain -- selling machines to chip producers to help them design, manufacture and test the actual semiconductors. Yet there they are in Figure 2. See the May 9 newsletter for a tentative explanation of this anomaly.
Figure 4
Industry Sectors With Midrange Claims Rates
Sixteen-Year Averages & Standard Deviations
(as a % of product sales, 2003-2018)
It could be argued either way as to where the appliance makers such as Whirlpool should be. On the one hand, they sell finished products to consumers who are replacing their refrigerators, washing machines, dryers, and dishwashers. On the other hand, they are suppliers to the new home builders, who usually stock the finished units with their first set of kitchen and laundry appliances. So maybe they belong where, they're found, in the Figure 4 group, with an average claims rate of 1.6% and a standard deviation of 0.41%.
We note that such an average is just about four times larger than the standard deviation. That's actually towards the high end of the volatility scale. Only a handful of industries turned in even more volatility, and three of them were in the electronics sector: data storage, satellite/microwave, and landline/mobile phone.
All three have midrange claims rates with lots of volatility (see the May 2 and May 9 newsletters for more). In fact, the landline/mobile phone group has the highest standard deviation of all industries as well as the highest ratio between the long-term average and the standard deviation.
Well Below Average Rates
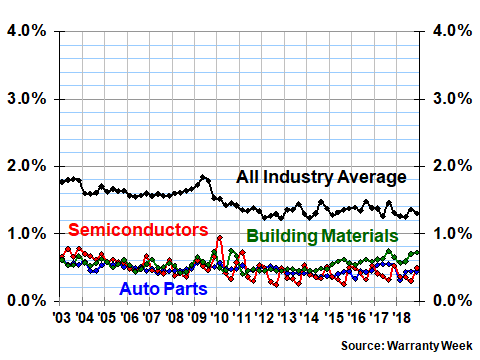
In Figure 5, we're looking at three industry sectors whose claims rates are clearly well below the all-industry average. In addition, their roles are clearly defined as suppliers, although there are some auto parts manufacturers (and retailers) that sell to the public. And there are building materials and tool vendors such as Stanley Black and Decker, Masco, and Sherwin Williams that also have a strong retail/consumer presence.
But, in general, the pattern holds: the non-powertrain suppliers have the lowest claims costs of all -- much lower than the claims rates of the OEMs they supply, even if they also sell through the retail channel to end users.
Figure 5
Select U.S. Industry Sectors
Average Warranty Claims Rates
(as a % of product sales, 2003-2018)
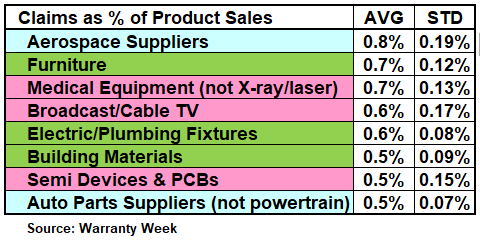
In Figure 6, we're listing the eight industry groups with the lowest long-term claims rates: 0.8% and under. Note they also have relatively small standard deviations, although this is more a function of the low averages than it is any sign of stability. For instance, one can see in Figure 5 that the semiconductor devices and printed circuit board manufacturers display a noticeable seasonal pattern as well as the occasional spikes in claims costs.
Measuring Volatility
However, 0.15% is actually a rather large standard deviation for an 0.5% average expense rate, meaning that the semiconductor industry data is more volatile than others. It's more typical to have a six-to-one or even a seven-to-one ratio between the claims rate and the standard deviation (for the all-industry average, the ratio is better than eight-to-one).
Figure 6
Industry Sectors With Low Claims Rates
Sixteen-Year Averages & Standard Deviations
(as a % of product sales, 2003-2018)
So there are the long-term averages and standard deviations for 23 different product types, and the actual 64-quarter claims data in pictures for 10 of them, along with the all-industry average for all of them together.
One last thing we want to note is that the long-term average is just that: an average over many years. But from the charts in Figures 1, 3 and 5, one can see that many have been very successful at warranty cost reduction over time.
Specifically, look at the computer data in Figure 1 and the data storage data in Figure 3. They started out high but are now low. Some have cut their claims costs in half, as a percentage of sales. In fact, at the end of 2018, the computer OEMs were under two percent and the data storage companies were under one percent of sales, while back in 2003 their expense rates were much higher.
Saving $10 Billion a Year
And don't forget that the all-industry average has declined from 1.8% back in 2003 to 1.3% now. A half a point decline might not sound like much. But given that we're talking about roughly $2 trillion in product sales (to get a 1.3% rate from $26 billion in total claims paid), that half a point is something like $10 billion in savings.
So yes, current claims costs for U.S.-based manufacturers are now something like $10 billion below where they'd be if 2003 cost patterns simply remained the same for 16 years. Instead, many manufacturers made a constant effort to reduce warranty costs over time. And if they hadn't, we'd be reporting $36 billion in annual claims payments instead of $26 billion. That's progress!
|