New Home Warranties:
The new home industry is like the car industry without a bailout: stuck at the bottom with no improvement. Warranty expenses continue to contract, but so does sales revenue. And some companies seem to be artificially managing their accrual levels.
Apparently, it's year five of the downturn in homebuilding, and the top warranty providers are beginning to show the strain. As they continue to sell fewer homes at lower prices, their customers hit them with not only typical warranty claims, but also allegations of mold, leaks and drywall odors that they insist must be repaired under warranty.
Just staying in business is a major accomplishment. Of the 47 U.S.-based and publicly-traded homebuilders that we began tracking in 2003, less than half are still reporting their warranty claims and accrual figures to the U.S. Securities and Exchange Commission. The rest have either been acquired or gone into liquidation, frequently leaving their customers without any warranty cover.
Fewer Claims Payments
The unit sales count is down and so is the per-unit pricing, so it's no surprise that overall sales revenue continues to fall. It was down by 9% in 2010-2011, at least among the publicly-traded homebuilders that we're tracking. The good news is that their claims payments fell even faster, by 22%, to a new annual low of $319 million.
Figure 1
New Home Warranties
Claims Paid by U.S.-based Homebuilders
(in US$ millions, 2003-2011)

The bad news is that this and other figures suggest that we haven't yet hit bottom in the homebuilding industry. Or if we have, we're not yet recovering from it. We're just scraping along the bottom. In Figure 1, the slight increase in claims seen from 2009 to 2010 held out a sliver of hope that a recovery was beginning, but 2011's level was lower than either of them.
Smaller Accruals
In Figure 2, it's clear that the accrual level continues to fall as well. And while claims are what happens to you after a sale, accruals are what you think will happen when you make a sale. Therefore, the continued annual contractions in Figure 2 are themselves a sign that even the builders aren't expecting growth.
Figure 2
New Home Warranties
Accruals Made by U.S.-based Homebuilders
(in US$ millions, 2003-2011)

The other thing about claims is that they tend to hurt more when revenue is falling, because the units sold in the good years need repairs during the slow years. This makes the expense ratios rise to unusual heights. For instance, in several other industries we've tracked over the past few months, there was a giant spike in the claims rate seen during 2009 in particular. That's because the claims rate is calculated by taking this year's claims payments and dividing it by this year's revenue. So it rises as revenue falls, even if claims payments remain the same.
Not Returning to Normal
In Figure 3, however, it's clear that the homebuilding industry's claims rate has been climbing from 2006 to at least 2010. In other words, it's not returning to "normal" after the recession ended, as it did in the auto industry. And whether 2010 stands as the peak or not for this industry's claims rate is unclear. Its average claims rate dipped back to 2008 levels in the middle of last year, but then it rose again by year's end.
Figure 3
New Home Builders
Average Warranty Claims & Accrual Rates
(as a % of product sales, 2003-2011)

The other warranty metric in Figure 3 is the accrual rate. This is the same data as in Figure 2, except it's now a percentage that's calculated by dividing accruals by sales. Basically, it's the amount of money set aside at the time a home is sold, to cover future warranty expenses, divided by the home's selling price. Therefore, the amount of accruals should rise and fall in lockstep with sales, because if no homes are sold, no warranty work is predicted. And unless the quality of the homes or the cost of repairs changes, the accrual rate should remain the same.
And it has more or less remained the same. In Figure 3, the average accrual rate does generally remain within a tight range over the past nine years, although the vertical axis exaggerates the fluctuations. Back in 2003-2005, the average remained close to one percent. Back in 2006-2007, as the industry peaked in sales volumes, its accrual rate nearly dropped to 0.8%. But then it rose back to one percent in 2010, before falling slightly again in 2011.
Declining Reserves
The other major warranty metric is the balance in the warranty reserve fund at the beginning and end of each year. As can be seen in Figure 4, it too has been falling for multiple years. But while claims peaked in 2005, both accruals and reserves peaked in 2006. And then sales peaked in 2007.
Figure 4
New Home Warranties
Reserves Held by U.S.-based Homebuilders
(in US$ millions, 2003-2011)

Incredibly, warranty reserves in 2011 stood at exactly half their 2005 level. No other industry has seen warranty expense contract so dramatically. Even more incredibly, the $631 million in the reserve funds of the remaining homebuilders was more than enough to cover at least two years of expected claims payments, which is a significantly thicker cushion than the 17-month average they maintained in 2003-2008.
In other words, they're keeping less reserves on hand, but it's still more reserves per home under warranty. However, years ago they expected rising sales to help cover any shortfalls. Nowadays they have to be ready to pay claims with cash on hand.
Top Warranty Providers
In Figure 5, we've charted the "market share" of the accruals reported by the top ten homebuilders. The totals in Figure 2 represent 100% of the accruals each year. And then the size of the color-coded bands represents the percentage of the total reported by each of the top companies.
Figure 5
New Home Builders
Accruals Made per Year
(as a % share of the total in Figure 2)

Within the homebuilding industry, PulteGroup Inc. was the top warranty provider of 2011, accounting for almost 20% of the industry's $220 million accrual total. NVR Inc. and Hovnanian were each at around 17%, followed by Lennar Corp. at 12%. Centex was acquired by Pulte in 2009. Champion Enterprises Inc. was a manufacturer of prefabricated homes that went bankrupt in 2009.
Last year, the top ten accounted for around 84% of the total. That's the highest it's ever been, while the 75% figure in 2008 was the lowest ever. Generally, the top ten homebuilders have represented around 80% of the total over the past nine years.
Accruals per Home Sold
Now we'd like to add one more warranty metric to the homebuilding industry: accruals made per home sold. It's actually one that we debuted more than three years ago in the April 23, 2009 newsletter, but haven't updated since. Basically, it's a way to tell which builders are reducing their warranty expenses and accounting for them properly, and which builders are making it up as they go.
It's only possible in industries where the product made is generic in nature (e.g. a "home," or a "car"), and where the top producers announce the exact number of units sold per month, per quarter, or per year. It doesn't work with telecom equipment, for instance, because the definition of the product is so wide-ranging in terms of both cost and capabilities. And it doesn't work with consumer electronics, because so many of the producers keep their sales volumes and/or warranty expenses confidential.
However, it does work with things like passenger cars, even though that label covers everything from an inexpensive Tata Nano to an ultra-luxury Aston Martin DBS V12. Of course the luxury brands accrue more per unit sold than the basic brands do. But they also command a higher price per unit sold. What we're really looking for is a company that accrues at a consistent level, whether it's measured per unit or per dollar, or both.
However, unlike in the passenger car industry, one of the challenges in calculating per-unit figures for the homebuilding industry is sorting through all the terminology involved. Every builder seems to use a different phrase for the sale of a home. Pulte calls them both "unit settlements" and "homebuilding settlement units." NVR uses just the word "settlements." Toll Brothers variously counts "completed contracts" or "closings," and other times uses just the word "units." Beazer Homes refers to "closings" and to "number of closings." D.R. Horton lists "homes closed." Lennar counts the "number of homes delivered." Meritage counts the "number of homes closed." Hovnanian Enterprises and KB Home use an even simpler label: "homes delivered."
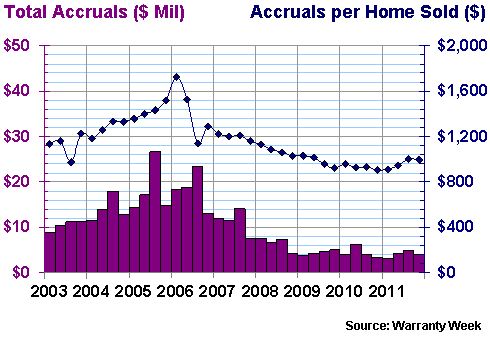
But we think we got it right, and that we have the correct figures for both homes sold and total warranty accruals for each of the homebuilders during each of the past 36 quarters. From there, it's merely a mathematical operation to calculate the average amount of accruals made per unit sold. D.R. Horton, for instance, reported 4,118 homes closed in the quarter ended December 31, 2011, in which it also reported $4.1 million worth of "warranties issued." Therefore, the figure we calculated for accruals per home during that quarter was $996.
Less Than Years Ago
And it turns out that D.R. Horton has been one of the most consistent homebuilders over the past nine years. In Figure 6 below, we can see that the company has kept its accrual levels close to $1,000 per unit for most of the past three years. Closer to the peak a few years ago, the average briefly climbed above $1,700 per home. But it has slowly declined ever since, except for those unusual gyrations in 2006.
Figure 6
D.R. Horton Inc.
Warranty Accruals per Home Sold, 2003-2011
(in dollars per quarter & per home)

The industry average for accruals made per home has actually always been much higher than the figures for D.R. Horton. But that's because D.R. Horton is below the industry mean for both average selling price per unit and average warranty cost per unit. Its accrual rate has been between 0.4% and 0.5% since late 2006.
Closer to the Average
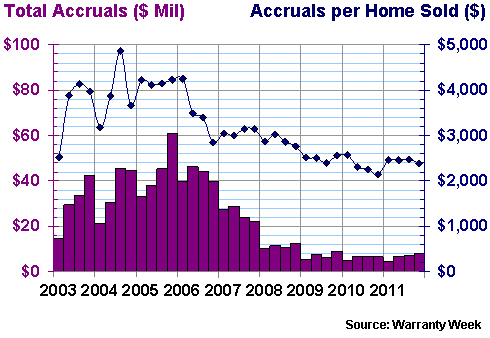
A company closer to the industry average is Lennar Corp., depicted in Figure 7. In a post-recession and post-Chinese drywall marketplace, Lennar has settled on an average accrual per home of roughly $2,500, which as the chart shows is actually the lowest average rate of the past nine years. Meanwhile, Lennar's corporate accrual rate has remained close to one percent for much of the past six years.
Figure 7
Lennar Corp.
Warranty Accruals per Home Sold, 2003-2011
(in dollars per quarter & per home)

Finally, PulteGroup is now the top warranty provider in the U.S.-based homebuilding industry, thanks to not only its acquisitions but also to its status as the company that saw claims fall the least. For eight years, Lennar paid the most in claims, with Pulte in second. But in 2011, Lennar paid $54.7 million in claims to PulteGroup's $54.8 million.
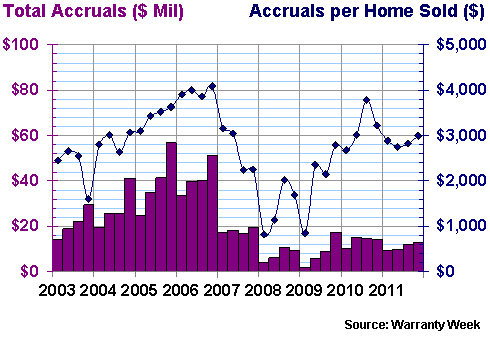
As can be seen in Figure 8, PulteGroup's accruals per home sold have also been much more erratic. Back in 2008 and 2009, the company saw fit to accrue less than $1,000 per home. Now it accrues around $3,000 per unit. Was that done in reaction to some kind of quality breakthrough followed by a relapse? Or was it done because of more basic motives? Investors might want to find out.
Figure 8
PulteGroup Inc.
Warranty Accruals per Home Sold, 2003-2011
(in dollars per quarter & per home)

For each of these companies, it's obvious that something snapped in 2006. For whatever reason, at that point they each began to reduce the amount they set aside to cover future warranty claims. We doubt it had much to do with their expectations about the frequency or severity of future warranty claims. We suspect it had lots to do with sales declines and the financial pressure those declines created.
The amazing thing is that these three charts represent companies whose warranty metrics are among the most orderly in the entire industry. It gets worse -- much worse. For instance, NVR once bounced its accruals from $2,200 to $6,600 per unit sold within a single year. KB Home apparently once found its buildings to be so faultless that it made absolutely no accruals in the middle of 2007, and made next to none at the end of 2010. One year, Beazer Homes set aside $15,000 in accruals per unit, but a year later it made exactly $0 accruals for six months straight.
In other words, some of these homebuilders are playing with their warranty expense accounts like they're part of a board game. But can you blame them? For these survivors, new home sales are down 70% from their peak in terms of units sold, and by even more in terms of revenue. So what if they pushed the boundaries of reasonableness with their warranty estimates? At least they're still in business, paying claims.
Ninth Annual Product Warranty Reports
As we begin to wrap up our annual survey of U.S.-based warranty providers, here are the links to the online editions of all the other parts of this series:
- Ninth Annual Warranty Report, Totals & Averages
- Top 100 Warranty Providers of 2011
- Aerospace Warranties
- Automotive Warranty Report
- Computer & Disk Drive Warranties
- Telecom Equipment Warranties
- Medical & Scientific Equipment Warranties
- Semiconductor Warranties
- New Home Warranties
- Appliance & HVAC System Warranties
- Fixtures, Furniture & Building Material Warranties
Readers needing more detailed snapshots of individual companies in either a PowerPoint or Excel format are invited to view the list of charts and spreadsheets available on the Warranty Statistics page.


