

Automotive OEM Warranty Report:
Depending on the metric you look at, the makers of cars, trucks and other vehicles account for between 40% and 45% of the warranty expenses of all U.S.-based manufacturers. But despite their size, their claims and accrual costs have been relatively stable for the past few years.
To create the following charts that track the warranty expenses of vehicle makers for the past 16 years, we began by taking a look at the annual reports and quarterly financial statements of 50 U.S.-based automotive OEMs -- the manufacturers whose names go onto the vehicles they produce.
The list includes car, light truck, and SUV manufacturers such as Ford Motor Co. and General Motors Co. as well as heavy truck and bus manufacturers such as Navistar International Corp. and Paccar Inc. It also includes agricultural and construction machinery manufacturers such as Deere & Co. and Caterpillar Inc. as well as recreational vehicle manufacturers such as Winnebago Industries Inc. and Rev Group Inc.We wanted to split them into commercial and consumer vehicle groupings, but the dividing line between the two is just too vague. Ford and GM make both, and there is no reliable way to split their warranty expenses between commercial and consumer customers. And since they are by far the largest of the OEMs, they would determine the outcome of the totals and averages wherever they landed. Also, some of the largest vehicles on the road are RVs, which would go into the consumer category even though structurally they had more in common with trucks and buses.
Small & Large
So the best we could come up with was to split the 50 OEMs by the size of the vehicles they produce: small and large. On one side are 24 manufacturers of passenger cars, motorcycles, SUVs, ATVs, pickup trucks, vans, snowmobiles, riding lawn mowers, golf carts, and motorized bikes and scooters. On the other side are 26 manufacturers of heavy trucks, medium trucks, vocational vehicles, emergency vehicles, buses, RVs, construction equipment, farm equipment, and road paving vehicles.
Not included are all the foreign parent companies that have U.S. subsidiaries, whose parent companies report their warranty expenses in their own annual reports, in their native currencies. So even though BMW, Volkswagen, Hyundai, Toyota, and Honda are among the companies that manufacture vehicles within the United States and in some cases export them to other markets, they're not included. Nor is Fiat Chrysler Automobiles, which is based in Europe and reports its expenses in euro.
Next week, we will take a look at the auto parts suppliers, and in two weeks we will compare their warranty expenses to the OEMs. In most years, the OEMs outspend their suppliers by a nine-to-one ratio, but it varies depending upon both market conditions and the willingness of the OEMs to make their suppliers pay more. There's also a basic structural difference between the way warranties are provided for passenger cars versus trucks.
By the way, all the companies we track report just one set of warranty expense figures for all their product lines, and for both their domestic sales and exports, as well as their overseas production, if any. So it is not possible for an external observer to determine the precise warranty cost of a Ford F-150 pickup truck or a Tesla Model 3. All the totals and averages apply to the companies as a whole.
From each company's annual report, we gathered four essential metrics: the amount of warranty claims paid, accruals made, and warranty reserves held, plus a figure for warranted products sold. Not all companies clearly identify all their sources of revenue, but wherever possible we tried to subtract away non-warranted sources such as finance, investments, service, royalties, apparel, and insurance. That way, when we divided claims paid and accruals made by products sold, we calculated a pair of ratios that expressed the percent of sales going towards warranty expenses as accurately as possible.
Warranty Claims Totals
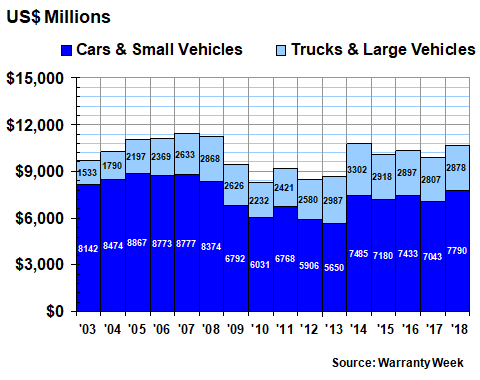
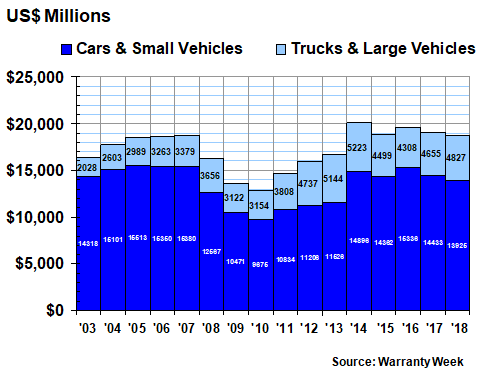
In Figure 1 we are taking the annual totals for claims paid over the past 16 years, rounded off to the nearest million dollars. In 2018, the car and small vehicle manufacturers reported $7.79 billion in claims payments, up by $747 million or 11% from 2017 levels. The truck and large vehicle manufacturers, meanwhile, reported $2.878 billion in claims payments, up by $71 million or 2.5% from 2017 levels.
Figure 1
Automotive OEM Warranties
Claims Paid by U.S.-based Companies
(in US$ millions, 2003-2018)
Usually, we publish our annual look at the warranty expenses of the automotive industry in late March, which has the unfortunate drawback of being a bit too early to include all of the late-filers in the listings. However, in recent years we have delayed things by a week or two, which makes all the difference.
This year, we are happy to report that financial statements have now been processed for all automotive OEMs and suppliers, with the annual reports of the last five -- Astec Industries, Tenneco, UQM, SORL Auto Parts, and Puradyn -- coming in just last week. So none of these charts contain missing data or place-saving estimates. They're all hard numbers.
In most years, the small vehicle makers account for about three-quarters of the industry total for all OEMs. In 2018, they accounted for 73% of the $10.668 billion claims total -- slightly below their long-term average but above the share they've held for the past six years. That's because their claims total grew much faster than the truck manufacturers' did last year.
Also, note that the 16-year record in Figure 1 can be divided into basically three periods: six years before the recession, five years of recession, and the five years since. We don't really need to name the years, because it's so plain to see. But please do note that the industry's total (small + large OEM) has remained stubbornly close to $10 billion for the past five years.
Warranty Accrual Totals
In Figure 2, we are counting all the warranty accruals reported by the automotive OEMs. These are the amounts they set aside at the time of sale, to finance the expected cost of warranty in the future. Usually, over the long term, they approximate the claims totals, although there are lots of ways they can differ.
For instance, a manufacturer could grossly over- or underestimate the predicted cost of warranty, thus requiring future adjustments to correct the errors. Also, when sales are soaring or plummeting, there's a mismatch caused by the lag time between claims and accruals. During the recession, warranty work on older vehicles became more important, and since sales were down, so were accruals. So in Figure 2, the trough is deeper in 2009 and 2010.
Also, accruals are more sensitive to safety recalls. For instance, in 2014 GM disclosed its ignition switch problems and initiated a massive and expensive recall. And that led to a one-year multi-billion-dollar jump in accruals, which was gradually spend over the next several years on claims. So that's why 2014 is the dividing line between the recession and recovery phases of Figure 1 and why it's the anomaly among the past eight years in Figure 2.
Figure 2
Automotive OEM Warranties
Accruals Made by U.S.-based Companies
(in US$ millions, 2003-2018)
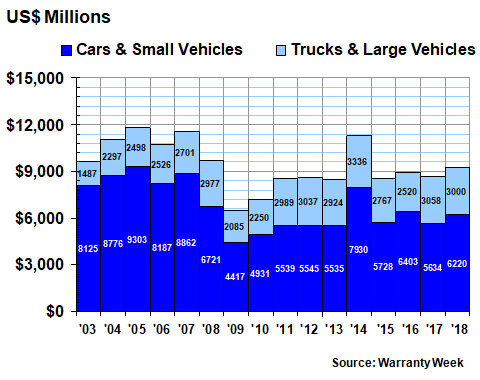
In 2018, the small vehicle makers accrued $6.22 billion, up $586 million or 10% from their 2017 totals. The large vehicle makers accrued exactly $3 billion, down by $58 million or -1.9% from their 2017 totals. The industry as a whole accrued $9.22 billion, which, excepting 2014, was their first year above $9 billion since 2008.
Companies reporting the largest jumps in claims included Astec Industries, Deere, Ford, Tesla, and Thor Industries. Companies reporting the largest jumps in accruals included Paccar, Tesla, Terex Corp., and Thor Industries.
Those reporting proportionally large reductions in either claims paid or accruals made included Astec Industries, Caterpillar, Navistar, Polaris Industries, and Spartan Motors Inc.
Warranty Expense Rates
Dollar changes in the totals can have lots of causes that have nothing to do with product reliability or quality. Companies can acquire or divest subsidiaries, or they could see sales soar or plummet. And then there are lots of causes that do have something to do with product reliability or quality. New product lines could be launched, or old product lines could run into manufacturing difficulties or safety recalls. Average warranty durations could become longer or shorter, in response to the competition.
Absent any of these changes, though, and the accrual rate should remain the same. That's because accruals are proportional to sales, since the manufacturers are predicting the future cost of warranty at the time of sale. No sale, no warranty. And if there's been no change in either the frequency or the cost of warranty work, there should be no change in the predicted total cost.
What we've done in Figure 3 and 4 is to take the claims and accrual totals from Figures 1 and 2 and compare them to sales. As such, each pair of lines provides the ratio between claims and sales, and accruals and sales, for both the small vehicle makers (Figure 3) and the large vehicle makers (Figure 4).
In Figure 3, the two most peculiar features are the 2009 spike in the claims rate, and the 2014 spike in the accrual rate. The 2014 spike is due to the previously mentioned ignition switch problems at GM. The 2009 spike, meanwhile, is due to the recession, but not because of a jump in claims -- it was a sudden drop in sales that caused the ratio to climb to 3.4%.
Figure 3
Car & Small Vehicle Makers
Average Warranty Claims & Accrual Rates
(as a % of product sales, 2003-2018)
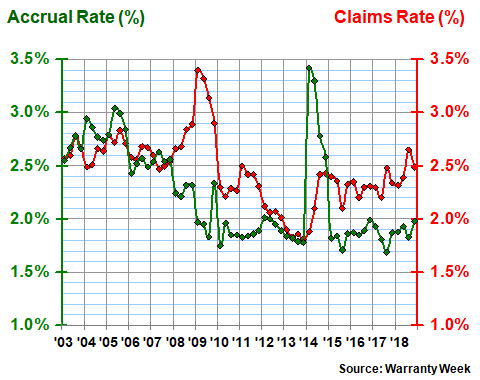
The data is in a quarterly format, meaning there are 64 measurements instead of just 16. As such, it appears more volatile than it would if it were in an annual format. However, it also makes the averages more meaningful, since they're calculated every three months instead of just once a year.
In Figure 3, the long-term average claims rate of the small vehicle makers is 2.5%, with a standard deviation of 0.33%. The long-term average accrual rate of the small vehicle makers is 2.2%, with a standard deviation of 0.45%.
The space between them, as mentioned, is filled through changes in estimate, where the manufacturer adds extra funds to their warranty reserve fund to correct past under-accruals. In 2018, this gap was significant, with the small vehicle claims rate coming in at 2.5% and the small vehicle accrual rate just under 2.0%.
Differences in Expense Rates
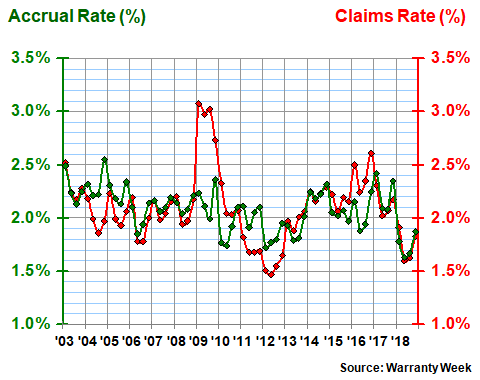
In Figure 4, it's instantly apparent that the truck and large vehicle manufacturers spend a smaller percentage of their sales revenue on warranties. Both their claims and accrual rates have averaged 2.1% over the long term, with much lower standard deviations than the other group as well. That's because, while they did experience the recessionary spike in their average claims rates, they did not feel the pain of the ignition switch recall in 2014. So there was no spike in their accrual rates.
Also, as we will detail in next week's newsletter, most truck engine and transmission warranties are dealt with separately by their manufacturers, leaving the truck OEMs to deal with just the cab and chassis. This is different from the car industry, where the warranties are usually bumper-to-bumper and the OEMs bill powertrain claims back to their suppliers whenever possible.
Figure 4
Truck & Large Vehicle Makers
Average Warranty Claims & Accrual Rates
(as a % of product sales, 2003-2018)
The companies that saw their claims rates rise most significantly in 2018 included Ford, Thor. and Astec Industries. Those that saw their accrual rates rise the most included Ford, Thor, and Paccar. And that means Ford and Thor were experiencing the pain on both sides: Thor raised its accrual rate from 2.9% to 4.0% after its claims rate rose from 2.2% to 3.6%, and Ford raised its accrual rate from 1.6% to 1.8% after its claims rate rose from 2.5% to 3.1%.
The good news is there was a much longer list of companies enjoying declining warranty expense rates. On the claims side, the list includes Caterpillar, Navistar, Oshkosh Corp., Polaris Industries, Spartan Motors, Terex, and Tesla. On the accrual rate side, the list of winners includes Astec, Caterpillar, John Deere, Oshkosh, Polaris, Rev Group, and Spartan Motors.
For those playing along at home, that means Caterpillar, Oshkosh, Polaris, and Spartan Motors are double winners. But it also means that Astec cut its accrual rate by a lot even though its claims rate rose a lot. And Deere cut its accrual rate by a lot even though its claims rate fell only a little.
Other apparent mismatches included Navistar, which enjoyed a massive decline in its claims rate (from 4.6% to 3.0%) but reduced its claims rate by only a little. GM, Paccar, Terex, and Tesla saw their claims rate fall, but decided to increase their accrual rates anyhow.
Warranty Reserve Totals
Our final metric is the closing balance left in the warranty reserves of these 50 automotive OEMs at the end of each year. Once again, we've separated them into two lists, for large and small vehicles. And once again, the small vehicle makers account for the bulk of the funds.
However, while for accruals the ratio between the totals for the small and large OEMs is close to two-to-one, and for claims it's three-to-one, for reserves it has approached and even exceeded four-to-one over the past 16 years.
In 2018, the small vehicle makers ended the year with $13.925 billion in their warranty reserve funds, a decrease of $508 million or -3.5% from 2017 totals. The large vehicle makers ended the year with $4.827 billion in their warranty reserve funds, an increase of $172 million or 3.7% from the previous year.
Figure 5
Automotive OEM Warranties
Reserves Held by U.S.-based Companies
(in US$ millions, 2003-2018)
Taken together, the large and small vehicle OEMs held $18.752 billion in their warranty reserve funds at the end of 2018, with a ratio of three-to-one between the small and large vehicle makers. From 2003 to 2007, the small vehicle OEMs held in excess of 80% of the industry's combined reserves. Only in 2013 did their share ever dip below 70%.
There were some enormous changes in the individual company balances, however. For instance, Ford, GM, and Navistar each allowed their warranty reserve balance to decline by $100 million or more last year. For GM, it was a $742 million decline.
At the other extreme, both Deere and Tesla added more than $100 million to their balances last year. For Tesla, it was a not-quite-doubling of the reserve fund's size, from $402 million to $748 million. And it did so despite seeing its claims rate fall from 1.4% to 1.2%.
On a relative scale, smaller dollar increases or decreases can still mean proportionally large changes. For instance, Harley-Davidson boosted its warranty reserve fund balance by 40%, while Oshkosh cut its balance by 40%. Thor, Winnebago, and AGCO Corp. were among the companies reporting the largest percentage increases, while Astec, Rev Group, and Spartan Motors were among the companies reporting the largest percentage declines in reserves.
Overall Trends
Bottom line, what it all means is this: none of the warranty metrics are currently at the high end of their historic ranges. In fact, for warranty reserves, 2018 represented only the sixth-highest total of the last 16 years. Accruals are at the high end of an eight-year trend, but they have been both much higher and much lower in the years before. Claims have remained more or less stable for five years running, and are still below their 2005-to-2008 peak levels.
When we look at the industry's warranty expense rates, we see the percentages creeping up for the small vehicle makers and creeping down for the large vehicle makers, but no clear long-term trends. Meanwhile the unseen metric is sales, with both unit sales and product revenue at or near record highs in recent years. In other words, the manufacturers are making more products than ever before, while spending the same or a lower percentage on warranty work. And that's good news for the automotive industry.


