

Appliance & HVAC Warranty Report:
The HVAC manufacturers have lower warranty expense rates but keep vastly more funds on hand in their warranty reserves. And while the HVAC system makers have seen a recent upturn in their warranty expenses, the appliance makers have seen their lowest expense rates in more than a decade.
After falling below one percent a few years ago, the warranty expense rates within the Heating, Ventilation, and Air Conditioning industry are once again rising. And after rising in recent years on the heels of major increases in claims cost, expense rates in the appliance industry are once again falling.
It's a tale of two industries that can be told with the data that's found in the notes of the financial statements filed by U.S.-based manufacturers. We began with a list of 40 HVAC component and 40 appliance manufacturers, but quickly realized we had to remove General Electric Co. from the appliance list. First, their warranty expenses are larger than the other 39 appliance companies combined, and second, they sold their last remaining appliance operations to the Haier Group three years ago. And even before that, we suspect most of GE's warranty expenses came from power turbines and jet engines, not appliances.
We are, however, including United Technologies Corp. in the HVAC category, because we suspect Carrier accounts for more warranty costs than the aerospace lines of business. Same goes for Johnson Controls International, which was firmly in the automotive business until it acquired the York brand. And Ingersoll-Rand is also on the list due to its ownership of the Trane brand.
The major household appliance manufacturers are led by Whirlpool Corp., with Welbilt Inc. and Middleby Corp. representing the commercial side of the industry, and others such as Helen of Troy Ltd. and National Presto Industries Inc. representing the small appliance sector.
From the annual reports and quarterly financial statements of each of these companies, we gathered four essential metrics: warranty claims paid, accruals made, reserves held, and product sales revenue. By dividing the claims and accrual totals by revenue, we calculated two additional measures: claims as a percent of sales, and accruals as a percent of sales.
Warranty Claims
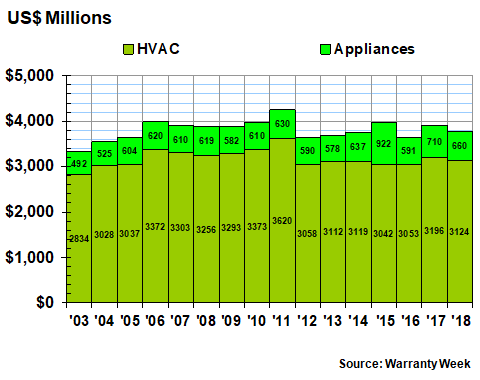
As can be seen below in Figure 1, the amount of claims paid by these 79 companies spiked in 2018, rising to their highest level since 2011. The $316 million total increase was driven by a $266 million jump in the HVAC group's claims payments, which in turn was driven primarily by United Technologies' acquisition of Rockwell Collins. Fortunately, UTC is expected to spin off its HVAC and elevator operations into a separate company in the near future, which should reduce the aerospace-air conditioning overlap considerably.
Figure 1
Appliance & HVAC Warranties
Claims Paid by U.S.-based Companies
(in US$ millions, 2003-2018)
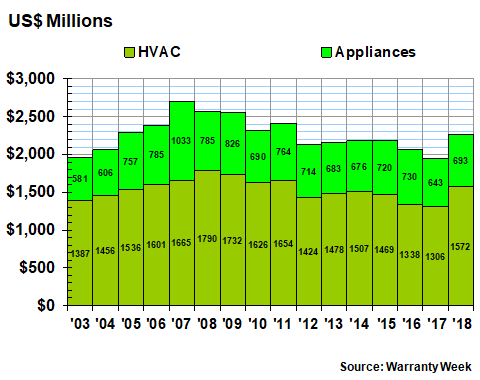
Some of the other companies driving changes in the claims total include Emerson Electric Co., which we estimate to have seen its claims cost rise by $38 million last year (the company reports only its beginning and ending balances, so we have to estimate both its claims and accruals). Ingersoll-Rand saw its claims cost rise by $19 million, and Lennox International Inc. saw its claims cost increase by $2.8 million.
On the appliance side, claims rose by $50 million, but that happened in spite of an $81 million decline in claims at Whirlpool, and $46 million decline in claims at Helen of Troy (the company seems to have entirely ceased reporting its warranty expenses in the current fiscal year, so we can only estimate).
Most of the increase, in turn, comes from another on-again, off-again expense reporter, Newell Brands Inc. The kitchen appliance maker only partially complies with warranty expense disclosure rules. It its latest annual report, the company said its warranty reserve balance dropped from $221 million in 2017 to $123 million in 2018, but it didn't state its claims and accrual totals. However, this drop in reserves implies claims payments in excess of $98 million. But the company could just as easily have withdrawn all that money from its warranty reserve fund just to reduce its net losses. Investors don't know; regulators don't care; external observers can't tell the difference.
Warranty Accruals
Warranty accruals also rose in 2018, to a combined balance of $2.223 billion. That was almost an eight percent gain, following declines in both 2016 and 2017. However, while the HVAC manufacturers accrued $251 million more, the appliance makers accrued $89 million less. And in fact, the $530 million that the appliance makers did accrue was their lowest annual total ever, or at least since warranty expense reporting became mandatory in 2003.
Figure 2
Appliance & HVAC Warranties
Accruals Made by U.S.-based Companies
(in US$ millions, 2003-2018)
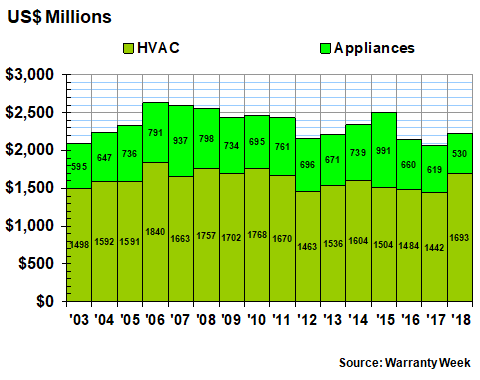
Once again, United Technologies combining its own warranty expenses with those of Rockwell Collins skewed the whole metric. Most of the HVAC manufacturers actually cut their accruals. Johnson Controls led the way with a $60 million decline. Lennox followed with a $4 million decline in accruals. Ingersoll-Rand was one of the few HVAC manufacturers to increase accruals. It added $16 million to its total.
Among the appliance makers, we don't know how much Newell or Helen of Troy accrued for warranty in 2018. So that's a big source of the decline. However, we do know that Whirlpool accrued $43 million less, dropping its accrual total from $332 million in 2017 to $289 million in 2018.
Warranty Expense Rates
The totals in dollars are one thing. Their relative size as a percentage of sales is something entirely different. For instance, while the claims and accrual totals of the HVAC companies rose, so did their sales. But sales did not rise as fast as expenses, so their warranty expense rates rose noticeably.
In Figures 3 and 4, what we've done is to take the expense totals from Figures 1 and 2 and divide them by the corresponding sales totals. As can be seen in Figure 3, the HVAC companies saw both their claims rate and accrual rate hit an eight-year high midway through 2018, after both expense rates hit new lows at the end of 2017.
Figure 3
HVAC Manufacturers
Average Warranty Claims & Accrual Rates
(as a % of product sales, 2003-2018)
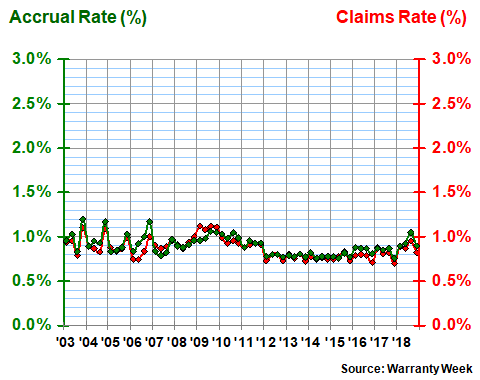
The long-term average claims and accrual rates for the HVAC group are both at 0.9%, with an 0.1% standard deviation. This implies long-term stability in the data, which is reflected in the relatively flat shape of the lines in the chart above.
Among the majors within the group, there were both big increases and big decreases in expense rates. United Technologies led the increases, with its claims rate jumping from 0.5% to 1.1% and its accrual rate rising from 0.8% to 1.3%. Johnson Controls led the decreases, cutting its claims rate from 1.3% to 0.8%, and cutting its accrual rate in half, from 1.4% to 0.7%. Lennox and A.O. Smith Corp., meanwhile, both saw their claims rates rise slightly while they cut their accrual rates slightly.
Appliance Expense Rates
We have to remove the Newell and Helen of Troy sales revenue figures from our calculations, because we have no reliable claims or accrual estimates to compare them against. But we do have complete data from Whirlpool, Middleby, Welbilt, and others. And that data points to massive cuts in warranty expense rates among these companies.
In Figure 4, the group's average accrual rate dropped at the end of 2018 to a hair under 1.0%, its lowest reading since early 2004. Their claims rate dropped below 1.2%, a hair under minimums reached in both 2014 and 2016 and again the lowest readings since 2004. Long-term, this group's average claims rate is 1.6% and its average accrual rate is 1.5%. They're now far below both metrics, in fact by more than their 0.4% standard deviation.
Figure 4
Appliance Manufacturers
Average Warranty Claims & Accrual Rates
(as a % of product sales, 2003-2018)
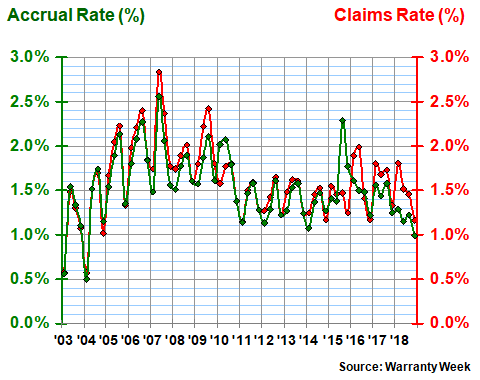
Whirlpool led the declines within this group, cutting its claims rate by half a point to 1.8%, and reducing its accrual rate by 0.3% to 1.8%. Middleby saw both its expense rates decline by modest amounts. Welbilt, meanwhile, saw its claims rate fall by 0.2%, but it raised its accrual rate by 0.2% anyhow. And National Presto saw both its expense rates rise slightly.
If we had reliable expense data from Newell and Helen of Troy these results might be different. Newell, with $5.65 billion in warranted product sales and Helen of Troy with $1.56 billion in sales this fiscal year, must be spending in the neighborhood of $90 million and $25 million per year on warranty, respectively, assuming they're near the rest-of-industry averages.
Warranty Reserves
In contrast to several of the other metrics, the balance in the warranty reserve funds of these 79 companies has not changed much in the past 16 years. Their combined reserve fund balances fell by $122 million in 2018 after rising by $263 million in 2017. But there hasn't been a change greater than 10% in six years, and that 2011-2012 change was the only one in excess of 10% in size since 2003.
Figure 5
Appliance & HVAC Warranties
Reserves Held by U.S.-based Companies
(in US$ millions, 2003-2018)
Also, there hasn't been much change in the ratio between the reserves of the HVAC and appliance groups either. It's always remained close to 85%/15%, except for the anomalous year of 2015 when Whirlpool ran into some trouble with its European acquisition.
But notice that while the ratio of reserves between the HVAC and appliance group is basically 5:1 or 6:1, the ratio between their claims and accrual totals is closer to 3:1 or even 2:1. Yet as can be seen in a comparison of Figures 3 and 4, their expense rates are noticeably different.
It's a puzzle: Why do the HVAC manufacturers have two to three times as much claims and accruals as the other appliance makers, and why do they keep five or six times as much reserves on hand, when their expense rates are much lower?
The answer seems to be the length of warranty coverage. The HVAC companies are planning on paying claims for multiple years, while the appliance companies are banking on just a year of coverage. And we can measure this by looking at the ratio between claims payments and reserve balances.
Warranty Duration
If a company is spending $1 million a month on warranty claims and keeps a balance of $12 million in its reserve fund, then the ratio between claims and reserves equals 12 months. This is typical of what we find in the computer and consumer electronics industries.
If, however, a company is paying $1 million a month in claims and keeps a balance of $24 million in its reserve fund, the ratio is 24 months. This is typical of what we find in the passenger car industry. In the truck industry, the ratio tends to be a bit lower -- closer to 18 months.
In the aerospace industry, or at least among the airframe makers, the ratio tends to be closer to 36 to 48 months, though it's stretched to as long as 76 months. That's a sign that these manufacturers expect to pay claims for a much longer time.
Here we find that the manufacturers in the HVAC industry tend to keep that ratio in the 24-to-30-month range, while the appliance manufacturers have been in the 9-to-12-month range. In other words, the appliance manufacturers expect to pay claims for a much shorter time period, because their warranties are of shorter durations. Whirlpool, for instance, ended 2018 with a ratio of 10.3 months: paying out $26 million a month against a year-ending balance of $268 million.
That balance hardly changed at all, by the way. Whirlpool ended 2017 with a $277 million balance, so its reserves declined by just over three percent. Lennox saw a 1.5% increase, while A.O. Smith saw a 2.1% decline.
In contrast, Johnson Control's balance shrunk by $105 million or 25%, while United Technologies' grew by $125 million or 9.4%. Welbilt was up 10%, while Middleby was up 13%. Newell Brands, which as was mentioned reports only its balance, saw a 31% decline in its reserves last year.


