

American Auto Warranty Expenses:
While General Motors continues to recover from its massive ignition switch recall of 2014, the warranty expenses of Ford are creeping upward. Tesla, meanwhile, is in the strange position of having the lowest claims rate and the highest accrual rate in the U.S.-based portion of this industry.
Before we get around to taking a look at the warranty expenses of automotive manufacturers based in Asia, and eventually worldwide, we need to take a quick look at the U.S.-based automakers. We nearly skipped right over them, but a reader reminded us that we've made this a more or less annual thing.
What we do each year is tally up the amount of claims paid, accruals made, and warranty reserves held by each automaker, extracting the data from their annual reports. We also gather data on how many vehicles they sold, and how much sales revenue those vehicles brought in, and we use those additional metrics to calculate the claims rate as a percent of revenue, the accrual rate as a percent of revenue, and the amount of accruals made per vehicle sold. And finally, we compare the claims payments to the reserve balance to calculate each company's capacity to pay claims.
Depending on how you count them, there are three or four major U.S.-based manufacturers of passenger cars and light trucks. There's the Ford Motor Company, General Motors Co. (successor to General Motors Corp.), and since its initial public offering, Tesla Inc. (formerly Tesla Motors Inc.).
But then there's the Chrysler and Jeep nameplates, which were owned by Daimler AG until 2007, and from 2007 until 2009 were privately-held, and since then have been part of Fiat Chrysler Automobiles N.V., and its subsidiary FCA US LLC. Normally, we'd consider them to be the U.S. arm of a European company, in the same way that Toyota Motor Manufacturing North America is the U.S. arm of an Asian manufacturer. And we'd look to the parent company for a single worldwide warranty expense report covering all their overseas subsidiaries.
However, from 2010 to 2014, FCA US had two corporate bonds for sale in the public market, which required the subsidiary to disclose its financials (and its warranty expenses) to the U.S. Securities and Exchange Commission. And so, for those five brief years, we got a glimpse of the actual warranty expenses of just the Chrysler/Jeep nameplates (hint: they're on the high side).
Meanwhile, Ford and GM began reporting their warranty expenses in 2003. Tesla started in 2008 (at the time of their initial public offering in 2010, they also delivered warranty metrics for two previous years). And Chrysler/Jeep started in 2009 but stopped in 2014 when the bonds were redeemed.
Warranty Claims Totals
In Figure 1, we're charting the reported annual totals for claims paid by these three or four manufacturers. In 2018, they paid a combined $7.47 billion in claims, up by $764 million from their 2017 total. And that reversed a trend that saw claims declining every year since 2014.
Figure 1
American Auto Manufacturers
Claims Paid per Year
(in millions of dollars, 2003-2018)
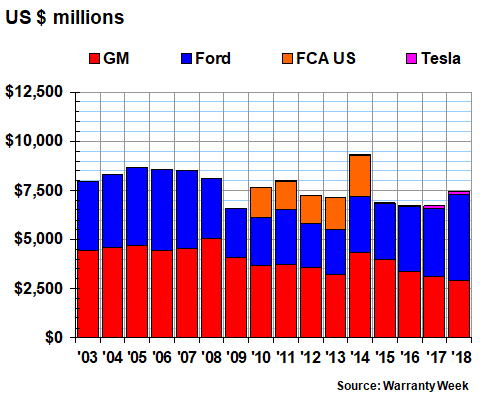
Ford is the culprit. Its claims total rose by $903 million last year, while GM's fell by $226 million. In fact, GM's $2.9 billion claims total was the lowest of the past 16 years, and was the company's first publicly-reported annual total below $3 billion. And it was the company's fourth straight annual decline, while Ford reported its third consecutive annual increase (there was a slight decline from 2014 to 2015, or else it would be Ford's sixth increase in a row).
In contrast, Tesla paid out a total of $209 million, and while that amount was up dramatically from 2017's $123 million claims total, it was barely large enough to be visible in the chart above. Or to put it another way, Ford's total rose, and GM's total fell, by more than Tesla's total, period.
Claims Rates
When we take the dollar totals in Figure 1 and compare them to automotive sales revenue totals, we can calculate the claims rate, which is claims as a percent of sales. In Figure 2 this is measured annually, so it's much smoother than a chart would be if it used all the available data, which is published quarterly.
Figure 2
American Auto Manufacturers
Warranty Claims Rates
(as a percentage of sales, 2003-2018)
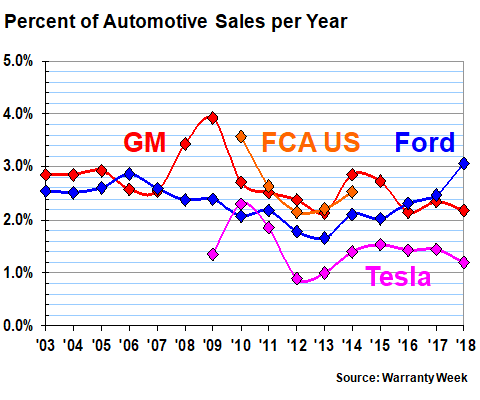
Nevertheless, it still makes its point, with GM's recessionary bump in 2008-2009, and its recall-related bump in 2014-2015. Note that Ford now has the highest claims rate within the group. And at 3.1% in 2018, it's also the highest it's been since reporting began in 2003. However, GM's was higher during the recession, and FCA's was higher in 2010.
We really shouldn't directly compare the warranty metrics of different companies against each other, because they rarely count their warranty expenses exactly the same way. So what we might be measuring is not a difference in quality or the cost or frequency of warranty work, but the different ways they account for parts cost or recalls. In fact, Ford didn't begin including recall expenses along with warranty until 2012, while GM has done so since 2003.
Also, take a look at Tesla's claims rate. In nine out of 10 years, it's been the lowest of the group. That's not something the short-sellers will want to publicize alongside their coverage of the crashes and car fires. However, keep in mind that Tesla is a luxury brand with a relatively high list price per unit. We saw the same effect last week with Daimler: low percentage of revenue; high warranty cost per unit.
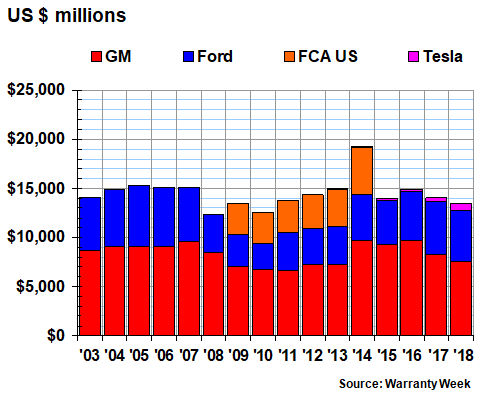
Warranty Accrual Totals
In Figure 3, we're looking at the amounts the manufacturers set aside to finance what they believe will be their future warranty expenses. Warranty accruals are made at the time of sale, and are determined by the predictions of the company's experts. So when they see trouble ahead, as GM did when its ignition key-related recalls spiked in 2014, they raise the accrual rate in anticipation.
Figure 3
American Auto Manufacturers
Accruals Made per Year
(in millions of dollars, 2003-2018)
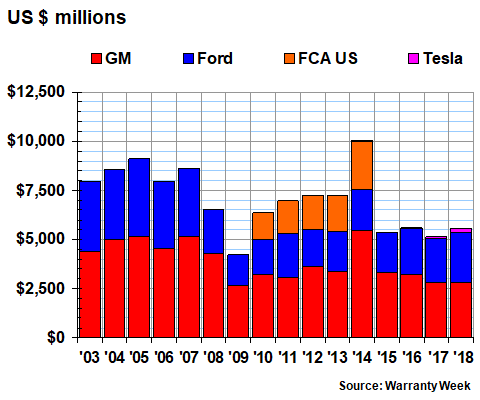
Some things to note: Tesla's accruals more than doubled to $167 million, but are still a small fraction of the industry's $5.56 billion total. GM's accruals were up slightly from 2017, but the accrual totals for both years are the lowest they've been since 2009. Conversely, Ford's accruals were the highest they've been since 2007, after rising by $324 million since 2017.
Accrual Rates
The totals are revealing, but what's really interesting is how the data looks when compared to sales revenue. As can be seen in Figure 4, when accruals are calculated as a percent of sales, Ford holds the low water mark in all 16 years. But GM came within 0.2% of Ford in 2006, and ended 2018 only 0.3% higher.
Figure 4
American Auto Manufacturers
Warranty Accrual Rates
(as a percentage of sales, 2003-2018)
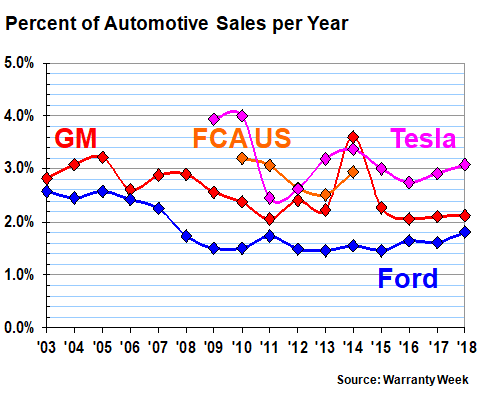
Notice that Tesla has had the highest accrual rate within the group for five of the last six years, with the exception of GM's recall-troubled year in 2014. That completely contradicts Tesla's lowest-cost position with its claims rate in Figure 2. Essentially, what these dissenting metrics suggest is that Tesla's accounting experts fear for the future, but things are pretty good in the present.
To put it another way, Tesla is setting aside proportionally more revenue to prepare for expenses that haven't yet materialized. Even allowing for the time lag between when accruals are made (at the time of sale) and when claims are paid (months or years later), there always seems to be a 1.5% to 2.0% gap between what Tesla thinks it will spend and what it actually spends.
The fear, of course, is the unpredictable future warranty costs of electric cars. Eventually, the batteries will need to be replaced, and if that's done so within the warranty period, it would cost Tesla far more than three percent of revenue. However, we now have a decade of Tesla warranty data in Figure 2, and its claims rate has remained relatively flat at or below 1.4% for half that time. So how long do we have to wait for events that never happen?
Accruals per Vehicle
If we were to look at accruals per unit sold, the data would make Tesla's actuarial decisions look even more curious. The company sold 245,000 cars last year and accrued $544 million. That's $2,220 per car sold. And that's five or six times as much as either GM or Ford are accruing per vehicle sold.
In Figure 5, therefore, the tables have turned. Now it's GM's and Ford's turn to be dwarfed by Tesla's data. While Tesla set aside $2,220 per car last year to finance each unit's predicted warranty costs, Ford set aside $432 and GM set aside only $335. And that represented a $189 reduction for Tesla (Ford was up by $90 per unit while GM was up by $43).
Figure 5
American Auto Manufacturers
Accruals Made per Vehicle Sold
(in dollars, 2003-2018)
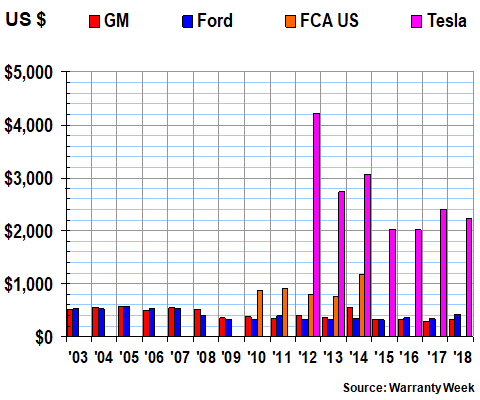
For Ford, it was the highest accrual per unit level since 2007, when the company was setting aside more than $500 per vehicle. For GM, it was the highest per unit level since recalls spiked in 2014. But except for that one bad year, Ford and GM have kept their accruals below $500 per unit for ten years now. Meanwhile, Tesla's accruals have remained above $2,000 per unit sold for seven years (we don't have reliable sales data for the Roadsters delivered between 2008 and 2011).
Warranty Reserves
Our final warranty metric is the balance left in the reserve funds of the manufacturers at the end of each year. At the end of 2018, they were keeping a balance of $13.475 billion in their reserve funds, with GM accounting for just over half that total, Ford owning just under 40% of it, and Tesla owning 5.5%.
Tesla was the only one of the three automakers to boost its reserves last year. GM reduced its balance by about 9% while Ford cut its by about 3%. In contrast, Tesla added $346 million to the $402 million it had in its reserves at the end of 2017.
Figure 6
American Auto Manufacturers
Reserves Held At Year's End
(in millions of dollars, 2003-2018)
Once again, we're including all the available data for FCA US, which ends with the $4.7 billion reported to be in its reserves in December 2014. At that same moment, its European parent reported reserves of 4.85 billion euro, or close to US$6.44 billion. Back in 2010, before the integration of Chrysler and Jeep into the Fiat family, the parent reported reserves of 970 million euro, or about US$1.29 billion at the time.
Claims Capacity
There's one more metric worth noting, which is a measure of how adequate the reserve balance is compared to the current amount of claims. It's expressed in months of capacity, in that a company with $60 million in its reserve that was paying $5 million a month in claims would have a claims capacity of 12 months.
At the end of 2018, GM had a capacity of 31 months, or just over 2-1/2 years. Tesla had a capacity of 37 months, or just over three years. But Ford, because its claims rate rose last year while its reserve balance fell, was down to only 12 months at the end of 2018, though it rose to 16 months in the first quarter of 2019.
Over the past 65 quarters, GM's claims capacity has ranged from 20 to 38 months, and has averaged 26 months. So the latest reading is a bit higher than average. Tesla's long-term average is 38 months, so it's just below that mark now, and it's never been lower than 18 months. But Ford's claims capacity has never been lower than its recent level of 12 months, while it's been as high as 24 months. In other words, Ford's $5.14 billion reserve balance at the end of 2018, while being the second-highest year-ending reserve balance in a decade, is the thinnest on record when compared to claims payment levels.


