European Auto Warranty Expenses:
Among the seven largest auto manufacturers, VW spends the largest percentage of revenue on warranty. Daimler spends the most per vehicle, and had the biggest jump in warranty reserves. And both PSA and Renault continue to have the lowest warranty expense rates in Europe.
The largest automaker in the world by unit sales and two of the top three by revenue are based in Germany, making Europe one of the top car-producing regions of the world. Nearly a third of the cars sold worldwide last year were made by one of the top seven European-based manufacturers, who together accounted for more than 39% of the world's automotive revenue.
In warranty terms, the top seven European automakers accounted for 47% of the worldwide industry's warranty claims, 51% of its warranty reserves, and 56% of its warranty accruals. Both its claims and accrual rates were above the worldwide industry averages. So any way you measure it, Europe sets the pace when it comes to automotive warranties.
Since 2003, we have tracked seven automakers based in Europe: BMW AG, Daimler AG, Fiat Chrysler Automobiles NV, PSA Peugeot Citroen, Renault S.A., Volkswagen AG, and the Volvo Car Group, a subsidiary of the Geely Auto Group.
Fortunately, all seven automakers fully disclose their warranty expenses in their annual reports, so estimations were not necessary in this region for any of the years covered by this week's report. Estimations were also unnecessary for last week's report on the American automakers. So just in those two regions, we have reliable warranty data from 10 companies representing roughly half of the world's passenger car output.
Next week, however, we will cover the Asian automakers, only half of which fully disclose their warranty expenses, so estimations will be required in several cases. Still, after adding in reliable data from Toyota, Honda, Nissan, Hyundai, Kia, and Tata, among others, we have hard data from companies representing about 89% of the world's automotive revenue and about 85% of the units sold. So the estimations will not have a massive effect on the totals or averages.
From the annual reports of each automaker, we gathered three essential warranty metrics: the amount of claims they paid per year, the amount of accruals they made per year, and the balance in their warranty reserve funds at the end of each year. We also gathered two non-warranty metrics: automotive sales revenue and the number of units sold. And with these, we were able to calculate three additional metrics: claims as a percentage of sales, accruals as a percentage of sales, and the amount of accruals per vehicle sold.
In order to be able to produce the worldwide automotive charts we anticipate including in the newsletter that comes out on September 10, we had to convert all the currency amounts into U.S. dollars. Six of the European manufacturers report in euro, while one reports in Swedish kronor. So we had to rely on the figures published in the U.S. Internal Revenue Service's "Yearly Average Currency Exchange Rates" publication to help us make those currency conversions.
European Warranty Claims
Let's begin with a look at the claims payments of all seven European-based automakers. In calendar 2019, the companies reported payments of just under $23.45 billion, down about 2.4% from 2018 totals and radically below the peak year of 2017's total of nearly $30.44 billion. And that peak was driven primarily by Volkswagen, which accounted for 65% of the European claims paid that year despite accounting for only 36% of the units sold and 29% of the automotive revenue. The problem, of course, was the spike in expenses triggered by its diesel engine emissions test falsifications.
Figure 1
European Auto Manufacturers
Claims Paid per Year
(in millions of dollars, 2010-2019)
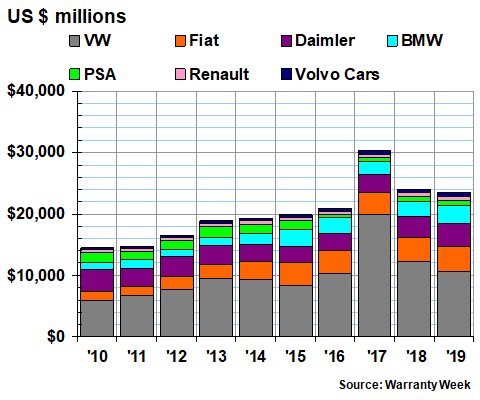
In 2019, VW's claims cost finally got back to "normal" levels, falling by $1.76 billion. However, all of the other six companies saw increases, led by BMW at +$481 million, and followed by Daimler at +$369 million, Fiat Chrysler at +$226 million, Volvo Cars at +$63 million, PSA at +$35 million, and Renault at +$21 million. The net result was a -$565 million decline for the group.
Claims As a Percent of Sales
Worldwide automotive sales revenue was up slightly for both VW and BMW, but was down for the other five companies. The result, when claims go up and sales go down, is an upturn in the claims rate, which is calculated by dividing the annual claims totals by annual sales figures.
In Figure 2, we can see the 2017 peak in VW's claims rate, which jumped to 8.9% as the costs of the testing scandal became clear. Last year, its claims rate fell to 4.4%, from 5.2% in 2018. For most of the others, however, the last five years have seen their claims rates undergo only gentle changes from one year to the next.
Figure 2
European Auto Manufacturers
Warranty Claims Rates
(as a percentage of sales, 2015-2019)
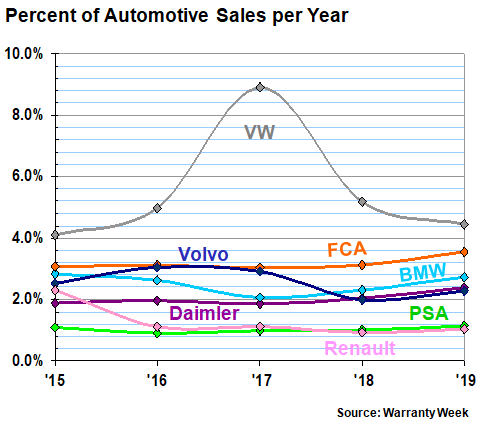
In 2019, BMW saw the biggest jump, from 2.3% to 2.7%. Fiat Chrysler's claims also rose by 0.4%, to 3.5%. Daimler's claims rate rose from just over 2.0% to just under 2.4%. Volvo's claims rate rose by 0.3% to 2.3%. And then the French manufacturers saw relatively small 0.1% increases -- Renault to 1.1% and PSA to 1.0%.
Note that in each of the last five years, Fiat Chrysler's claims rate has been the second-highest, while either PSA or Renault have been the lowest. If European regulators permit it, some time later this year Fiat Chrysler and PSA plan to merge into a new company called Stellantis, which on a combined basis would have had a 2.5% claims rate in 2019 based on 4.4 billion euro in claims (US$4.92 billion).
European Warranty Accruals
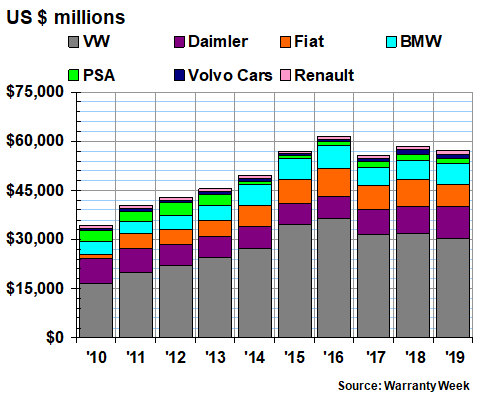
In Figure 3 we're looking at the worldwide accrual totals of all seven of the European automakers for each of the last 10 years. Here the VW peak came in 2015 -- two years earlier than the peak in claims, because there is always a lag time between when a rise in future expenses is predicted, and when it actually arrives. VW predicted the cost in late 2015, and set aside the equivalent of $21.37 billion in accruals that year. By 2019, its accrual total was back down to "normal" territory.
In fact, at just over $13 billion, at least in dollar terms, it was the lowest annual total for the company since 2012. However, in its native euro, VW accrued 11.62 billion euro in 2019, and because the dollar was much weaker back in 2013 and 2014, the totals VW reported in euro were somewhat smaller in those two years.
Figure 3
European Auto Manufacturers
Accruals Made per Year
(in millions of dollars, 2010-2019)
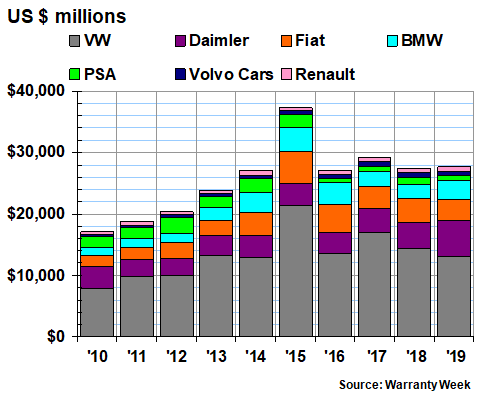
In dollar terms, VW also led the way for accrual reductions from 2018 to 2019, cutting its total by $1.38 billion. Fiat Chrysler was next, with a $405 million reduction. PSA followed with a $289 million cut. and then Renault and Volvo made smaller reductions of -$77 million and -$51 million, respectively.
Only two manufacturers increased their accruals last year, but both of them were large. Daimler boosted accruals by $1.5 billion, and BMW increased its total by $854 million. Overall, those increases outweighed the cuts, boosting the group's total accruals from $27.48 billion in 2018 to $27.63 billion in 2019.
Accruals As a Percent of Sales
In Figure 4, we're taking the totals of Figure 3 and again dividing them by product sales revenue totals to calculate accruals as a percentage of sales figures. Once again, VW is always the highest, and either PSA or Renault is always the lowest. Whether this is the result of true differences in quality and reliability or whether it's the product of some strange difference in accounting standards we cannot say. We use the numbers we find, assuming they must be accurate if they're in the pages of a company's official annual reports.
Figure 4
European Auto Manufacturers
Warranty Accrual Rates
(as a percentage of sales, 2015-2019)
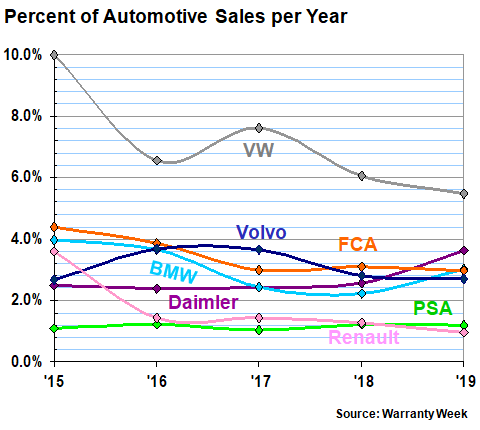
Over the course of the last year, Daimler's accrual rate rose the most: by just over 1.0%. BMW's accrual rate rose by 0.8% to 3.0%. The other five accrual rates fell. Renault, Fiat Chrysler, and Volvo Cars saw small declines, while VW's accrual rate declined by 0.6% to 5.5% and PSA's accrual rate fell by 0.3% to 1.0%.
Weighted Averages
As a weighted average, where all seven companies' accrual totals are divided by all seven companies' sales revenue totals, the group's accrual rate rose by a little over 0.1% to 3.5%. Their weighted average claims rate, meanwhile, rose by just a tiny bit to 3.0% last year.
As can be seen in Figure 5, both these figures are well between the extremes of the last decade, during which the claims rate has been as high as 4.0% and as low as 2.4%, while the accrual rate has been as high as 5.4% and as low as 3.25%. For the statisticians among us, the 10-year weighted average claims rate for European automakers has been 2.9% with a standard deviation of 0.45%, while their 10-year weighted average accrual rate has been 3.7% with a standard deviation of 0.67%.
Figure 5
European Auto Manufacturers
Average Warranty Claims & Accrual Rates
(as a % of product sales, 2010-2019)
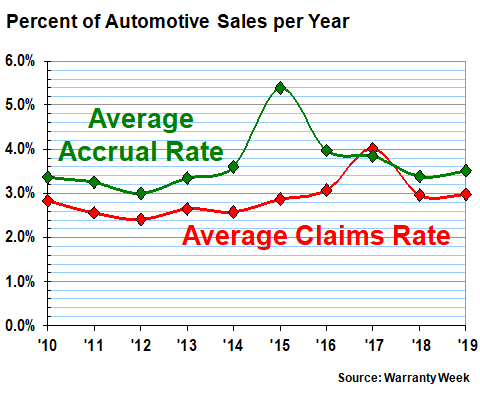
Note that except in 2017, the lines never cross. This means that the companies as a group are nearly always setting more funds aside as warranty accruals than they are actually spending on warranty claims. Absent any adjustments, this would typically drive up the balance in the warranty reserve funds. And sure enough, this is more or less the pattern seen in Figure 7. But let's not get ahead of ourselves yet.
Accruals Per Vehicle Sold
All seven companies publish exact figures in their annual reports for vehicles sold. For the moment, let's set aside the meaning of those figures, given that two of the companies are also major truck manufacturers and one is also a major motorcycle manufacturer. And let's skip over the fact that four of these companies make some of the world's most luxurious (and expensive) passenger cars on the road. The bottom line is that their product mix doesn't change all that much from year to year, so therefore their accruals per vehicle also shouldn't change that much. But yet they do, as can be seen in Figure 6.
Note that Daimler and VW switched places, as VW's average accruals per vehicle fell from $1,320 to $1,187, while Daimler's rose from $1,291 to an unusually high $1,747 per unit. Part of that jump was caused by a decline in the dollar-euro ratio, but that's hardly an excuse: it affected six of the seven companies. So it probably had more to do with an internal prediction of increased warranty costs, which led Daimler to conclude that it had to accrue almost as much as Tesla Inc. did per unit sold.
Figure 6
European Auto Manufacturers
Accruals Made per Vehicle Sold
(in dollars, 2018-2019)
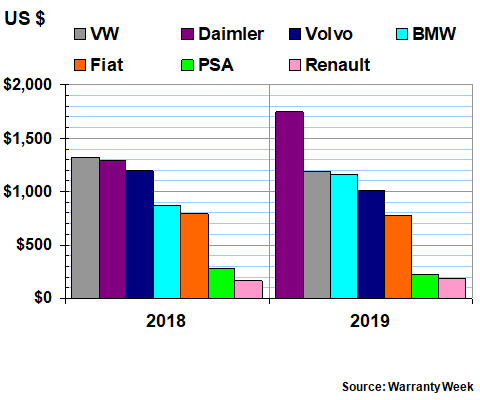
Volvo and BMW also swapped places, with Volvo's accrual rate per vehicle sold falling to $1,013 while BMW's rose to $1,162. Fiat Chrysler remained about the same at $775. And then once again, the French took the two bottom spots, with PSA at $226 and Renault at only $187. What's their secret for keeping their warranty expenses so remarkably low?
European Warranty Reserves
Believe it or not, these seven European manufacturers are keeping close to US$60 billion in their warranty reserve funds, and more than half of that total has been in VW's fund for the past few years. Amazingly, this is still true, even after VW let its warranty reserve shrink by $1.73 billion last year, to a balance of just over $30 billion. Back in 2016, its reserve balance peaked at $36.56 billion, and comprised close to 60% of the European group's $61.7 billion total at the time. In fact, even now, VW accounts for 27% of the world's warranty reserves, despite selling only 12% of the world's vehicles.
Figure 7
European Auto Manufacturers
Reserves Held At Year's End
(in millions of dollars, 2010-2019)
For several years now, VW has had by far the largest warranty reserve fund in the world, in any industry. In fact, its warranty reserve fund balance at the end of 2019 exceeded the balances of Toyota, GM, and Ford combined. But given its current claims payouts, its balance is not as excessive as it sounds.
Given that the company paid about $880 million a month in claims last year, that balance is equal to 34 months of payments. And that's right in the sweet spot of the industry. Following the same ratio of claims to reserves, Toyota is at 39 months. BMW is at 26 months. Daimler is at 31 months. And GM is at 29 months. The one that really sticks out is Tesla Inc., at 58 months as of June 2020.
In proportional terms, in fact, VW's $1.73 billion reduction (-5.4%) was actually exceeded by both PSA (-$258 million, -14%) and Fiat Chrysler (-$927 million, -12%). And it was only slightly larger than Renault's reduction (-$45 million, -3.8%).
The other three, meanwhile, let their reserve fund balances actually increase last year. BMW's reserves rose by $119 million (+2.0%). Volvo's balance increased by $41 million (+3.6%). And Daimler added $1.43 billion to its warranty reserves, boosting its total to $9.74 billion.
Among the world's automakers, in dollar terms, Daimler now has the third-largest warranty reserve, behind just VW and Toyota. Three years ago, Fiat Chrysler had more reserves than Daimler. And four years ago, so did BMW. So obviously, something has changed in recent years. Fiat Chrysler is now in fifth place worldwide, having been passed by GM last year. BMW is now in sixth place, with a balance of $6.21 billion at the end of 2019.
The other three European automakers are far down the list, after several Japanese, Korean, Indian, and Chinese automakers. But that's the news we will leave until next week, when we cover the Asian automakers in detail.