Nine-Month 2020 Warranty Report:
So far this year, warranty claims are down -10%; accruals are down -15%, and warranted product sales are down -7%. But a few industries such as Security Systems and Computer Peripherals are actually up on all fronts, while the warranty metrics of Aerospace and Computers are way down.
It was just before New Year's Eve in 2019-20 that news of a deadly virus emerged from Wuhan, China. And over those first few months of this year, the news only got worse, as the virus spread and schools and businesses shut down or converted to work-at-home.
Much will be written about the shifts this caused in terms of supply and demand. Bleach and bacon took an early hit, followed by car sales, retail goods, and then the entire travel and entertainment sector. Hundreds of thousands suffered cruel and lonely deaths, and hundreds of millions tried to stay home as much as possible. And unlike any other economic calamity of modern history, it hit the whole world at once.
This being a warranty newsletter, we've been looking for signs of all these dislocations in the warranty data. Were people afraid to go shopping or to schedule a repair technician's visit? Did consumers postpone making warranty claims or did they become priorities for those with nothing but leisure time? Or did people buy everything on Amazon and learn to fix it themselves on YouTube? Did households postpone purchases of home appliances and new computers? Or did all that baking and Zooming make them hungry for upgrades? You can't buy cars or trucks online, like books or clothes or food, so those industries took a deep hit initially. But by the third quarter, which is the latest data we have, they'd staged something of a V-shaped comeback.
Meanwhile, in the medical world, equipment sales and warranty expenses are way down in 2020. How could that happen when hospitals and medicine are such a priority this year? Beats me -- nothing makes sense any more. But the vaccine is now in distribution, and lives are being saved, though lockdowns are widespread again this holiday season. And travel is still a problem, as is dining out or watching a show. But I've got a feeling Twenty-One is going to be a good year, as the old song goes. And it's only weeks away from now.
Eighteen Warranty-Providing Industries
At the end of each quarter since 2017, we have collected data from all U.S.-based warranty providers concerning the amounts they paid in claims and the amounts they reported for warranty accruals. We also have collected product sales data, and use those figures to calculate claims as a percent of sales (the claims rate) and accruals as a percent of sales (the accrual rate). Since there won't be any annual reports published before the end of February or in early March, this is the last look we will have at the warranty metrics of U.S. companies for at least a few months.
We assign each company to one of 18 primary industries, based on the nature of their product lines. In 2020, we have moved Raytheon Technologies Corp. (formerly United Technologies) from the Appliance and HVAC group to the Aerospace group, and have added Carrier Global Corp. to the Appliance and HVAC group in its place. Otis Worldwide Corp. was added into Building Materials.
Also, we have a perennial problem with companies such as General Electric Co. and Honeywell International Inc. that disclose their warranty expenses only once a year, in March, in their annual reports. Since we have seen no warranty data for them for the first, second, or third quarters of 2020, we have to include placeholding estimates for them in these charts. Most certainly, when the actual data becomes available in March 2021, we will have to revise some of these totals and averages.
For the sake of readability, we are going to divide the 18 different industries into three groups. First, we will look at four vehicle-related industries: Cars & Motorcycles, Trucks & Buses, Auto Parts, and Aerospace. Next we will look at seven electronics-related industries: Computers, Telecom Equipment, Semiconductors & Printed Circuit Boards, Consumer Electronics, Medical Equipment & Scientific Instruments, Data Storage, and Peripherals. And then we will look at seven building-related industries: Appliances & HVAC, New Home Builders, Building Materials, Power Generation Equipment, Material Handling Equipment, Security, and Sports Equipment.
To avoid using a designation of an "other" category, we have forced some companies into places they don't fit, such as placing the watch and jewelry companies into the "Sports" category. And of course, to begin with, what does sports equipment have to do with the building trades? But it has to go somewhere. Sports watches, anyone?
Automotive Warranty Claims
Let's begin with the automotive and aerospace categories. Steady readers will note that the data below tells much the same story that was detailed in the November 12 newsletter. Claims took a notable downturn in the second quarter of 2020. And if we could suggest a preview of the data in Figure 5, warranty accruals fell even harder in that quarter.
These are the near-final numbers for all warranty reporters in these categories. We will need to make adjustments for annual reporters such as Eaton Corp. and Illinois Tool Works Inc., but they will change the quarterly totals only slightly.
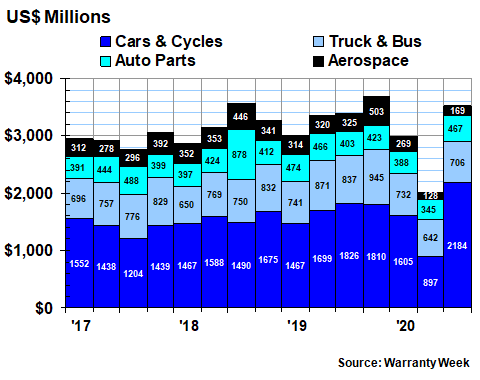
Figure 1
Worldwide Warranty Claims Payments
of U.S.-based Vehicle Makers
(claims paid in US$ millions, 2017-2020)
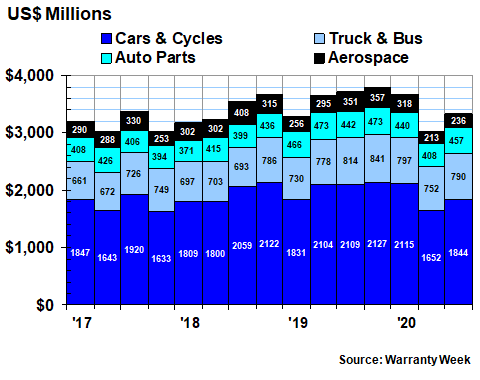
For the first nine months of 2020, car and cycle makers paid $5.61 billion in claims, down $434 million or -7.2% from the same period in 2019. Truck and bus makers saw a slight increase to $2.34 billion in claims paid, and auto p[arts manufacturers saw a -5.5% or -$76 million decrease to $1.31 billion. Aerospace manufacturers saw their claims total drop by -$135 million or -15%.
Comparing the 2020 quarters to the year-ago quarters, the entire vehicle sector saw a +12% increase in claims during the first quarter of 2020, a -17% decrease in the second quarter, and a -10% decrease in the third quarter. For the first nine months of 2020, the overall decline in claims paid by this sector was -5.9%.
Electronics Claims
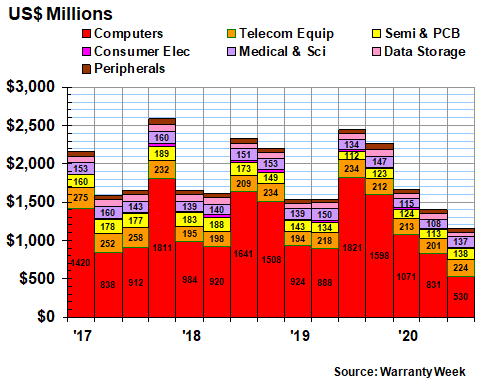
In Figure 2, we're looking at claims in the electronics sector. Proportionally, the biggest drop was the -25% decline in the semiconductor industry, followed by a -24% drop in the computer industry, a -20% drop in the data storage industry and a -16% decline in the medical and scientific equipment industry. Telecom equipment was down a comparatively slight -4.1%. Peripherals were up +2.9% and consumer electronics were up +7.8%.
Figure 2
Worldwide Warranty Claims Payments
of U.S.-based Electronics Manufacturers
(claims paid in US$ millions, 2017-2020)
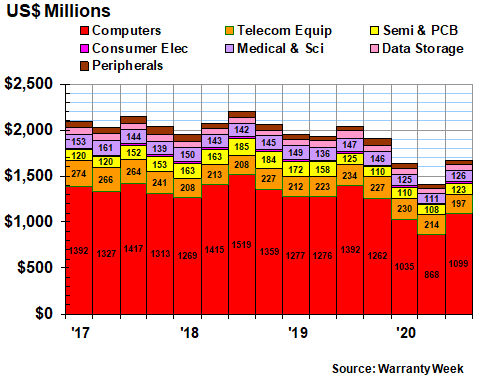
Once again, there is a noticeable notch in the second-quarter 2020 data. Claims across this entire sector were down -27% that quarter, as opposed to -16% during the first quarter and -18% during the third quarter. For the first nine months of 2020, this sector is down -20%, suggesting even more damage from the pandemic than was the case in the vehicle sector.
Claims in the Building Trades
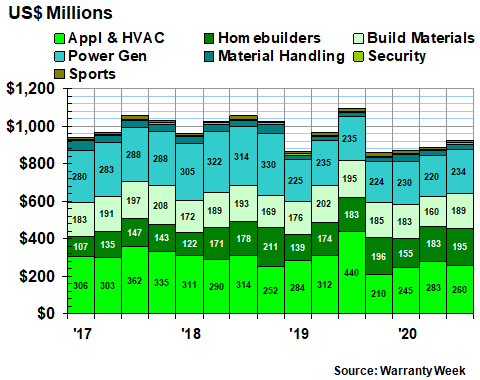
Across the building trades, four industries saw claims totals fall during the first nine months of this year, while three actually saw increases. Both building materials and material handling saw -18% declines. Sports equipment claims saw a -14% decline. And homebuilders saw a -8.4% decline.
In contrast, security equipment saw a +14% increase in claims in the first three quarters of 2020, while power generation equipment saw a +4.3% increase and the appliance and HVAC category saw a +1.8% increase. Overall, the seven industries together saw a -4.5% decline in claims to $2.75 billion, compared to the first three quarters of 2019.
Figure 3
Worldwide Warranty Claims Payments
of U.S.-based Building Trade Companies
(claims paid in US$ millions, 2017-2020)
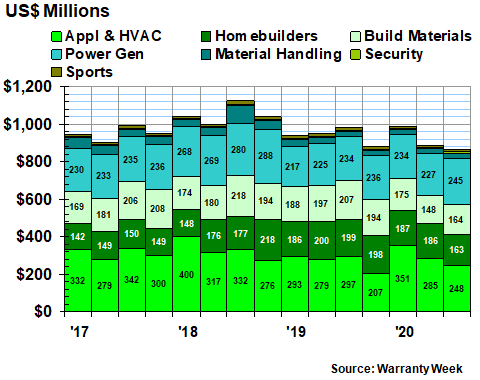
Comparing the same quarters of 2019 and 2020, these seven industries saw a +5.5% increase in claims during the first quarter, to a total of $991 million. In the second quarter of 2020, claims were down -6.5%, to $889 million. In the most recent quarter, claims were down -12% to $866 million.
Warranty Expense Rates
As is clear in Figure 4, warranty expense rates are no longer declining in the U.S., as they were for most of the decade from 2003 to 2013. In fact, they seem to have begun to follow a seasonal pattern, where the highest claims and accrual rates of each year are seen in the summer, and the lowest rates are seen in the spring.
At least, that was the pattern from 2017 to 2019. This year, the claims rate rose in the spring while the accrual rate fell, then the claims rate fell in the summer while the accrual rate rose. As we get deeper into specific industry totals we will try to determine which companies and which industries caused this to happen.
Figure 4
All U.S.-based Companies
Average Warranty Claims & Accrual Rates
(as a % of product sales, 2017-2020)
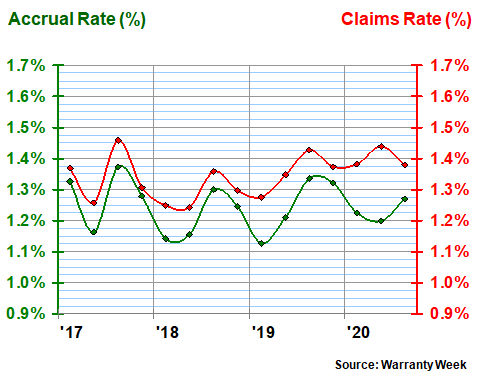
Over the 71 quarters for which we have gathered this claims and accrual data, the long-term average claims rate has been 1.47% with a standard deviation of 0.17%, while the average accrual rate has been 1.44% with a standard deviation of 0.20%. At 1.38% and 1.27%, respectively, the latest reading on the claims and accrual rates of U.S.-based manufacturers is somewhat below those long-term averages. But as the chart shows, the overall trend is no longer downwards.
Of course, movements in the claims and accrual rates are highly dependent on sales data. And as close as we can see, product sales are down around -7% so far in 2020, although that number will have to be revised as we get annual data from a handful of companies next March.
In the first quarter, we measured a -4% drop in product sales, and in the second quarter, the sales decline was -15%. So the lockdowns have apparently taken their toll on manufacturers this year.
Normally, in the absence of some significant change in product quality, reliability, or repair cost, warranty accruals and product sales usually remain proportional. As can be seen in Figure 4, however, this has not been the case in recent years. That green line is far from flat.
Warranty Accrual Trends
As we have detailed in previous newsletters, manufacturers seem to have overreacted to the pandemic with their warranty accrual reductions. In the second quarter of 2020, for instance, warranted product sales were down -15% but warranty accruals were down by -27%. Sales fell -7% in the third quarter but accruals fell -19%.
In Figure 5, we can see the deep notch in the accrual data of the automotive and aerospace industries during the heart of the lockdowns. Compared to the second quarter of 2019, aerospace accruals were down -60% in the second quarter of 2020. Accruals in the cars and small vehicle industry were down -47% in the months of April, May and June 2020. And these were the largest percentage declines among all 18 industries that we track.
Figure 5
Worldwide Warranty Accrual Payments
of U.S.-based Vehicle Makers
(accruals made in US$ millions, 2017-2020)
For the first nine months of 2020, the declines are moderated somewhat by the facts that the first quarter was down just a bit and the third quarter was actually up slightly. For the three quarters of 2020, compared to the same three quarters of 2019, car accruals are down -6.1%, truck accruals are down -15%, and auto parts accruals are down -11%.
It's the aerospace accruals, because of the ongoing problems at Boeing, that are down by -41% to $566 million for the year so far. That is by far the largest downturn in warranty accruals for any industry seen so far this year.
Electronics Accruals
Five out of the seven industries grouped together under the electronics heading have reported accrual declines in the first nine months of the year. Computers are in the lead with a -33% decline, followed by medica and scientific equipment with a -15% decline. But the most notable feature in Figure 6 is the repeated peaks in computer warranty accruals, which in the November 5 newsletter we traced to Apple's peculiar habit of stuffing most of its accruals into the second half of each calendar year.
Figure 6
Worldwide Warranty Accrual Payments
of U.S.-based Electronics Manufacturers
(accruals made in US$ millions, 2017-2020)
Accruals in the other industries in this group did not change by much in 2020. Telecom equipment saw accruals fall by -$7 million or -1%. Semiconductors saw a -$13 million or -3% decline in accruals. Data storage systems posted a -9% decline in accruals for the first three quarters of this year.
The accrual increases were equally modest. Consumer electronics saw a +$1.4 million or +3% increase in accruals. Computer peripherals saw a +$122,665 increase, equal to a 0.1% gain.
Building Trade Accruals
We already detailed the surprising increase in both sales and warranty metrics registered in the new home industry in the October 15 and November 19 newsletters. Even in the depths of the second quarter, warranty accruals rose +5% for this group. And for the year to date, accruals are up +8%, from $496 million to $534 million.
Warranty accruals are also up for the material handling equipment companies: +17% in the second quarter and +29% for the first nine months of 2020. But everything else is down. Appliance and HVAC manufacturers have cut accruals by -$248 million or -24% for the first nine months. Building materials accruals are down by -$42 million or -7%, and power generating equipment accruals are down by -$12 million or -2%. So there goes any theories that home improvement and infrastructure spending followed the upward trend in new home building.
Figure 7
Worldwide Warranty Accrual Payments
of U.S.-based Building Trade Companies
(accruals made in US$ millions, 2017-2020)
Overall, warranty claims reported in the first three quarters of 2020 added up to $17.5 billion, down by -$1.95 billion or just over -10% compared to the same period in 2019. Warranty accruals are down by -15% after a -$2.76 billion decline in the first three quarters of this year.
Of the 18 industries that we track, 10 saw declines in both their claims and accrual totals during the first nine months of this year. The most severely impacted industries were Aerospace, Computers, Sports Equipment, and Medical Equipment & Scientific Instruments. Notice we did not name any of the automotive groups in that list. They were down, but not as much as those four, because of a bit of a bounce back in the third quarter data.
And then three saw increases in both metrics (Peripherals, Consumer Electronics, and Security Equipment). And then three saw increases in claims but declines in accruals (Truck & Bus, Appliances & HVAC, and Power Generation Equipment), and two saw increases in accruals but decreases in claims (Material Handling Equipment and New Home Builders).
Happy Holidays!
And with that, we put an end to a tumultuous year. Incredibly, this is the eighteenth year-ending issue of Warranty Week, which began with a report on the warranty disclosures of online retailers at the end of 2002. It has been a pleasure to send all of you more than 850 newsletters in the decades since then.
We're going to take a three-week break for the holidays, and will return in a new year, with a new sense of optimism, on January 14, 2020. Until then, we wish all our readers a happy holiday and a healthy, safe, and prosperous new year!