New Home Warranty Report:
Because new home builders were so thoroughly mauled by the effects of the Great Recession, one would think they would also have suffered greatly during the pandemic. But one would be wrong, because sales are up, and warranty expenses have more or less kept pace.
The builders of new homes were hit hard for years after their industry peaked in 2007. But in 2020, there was a short downturn during the height of the lockdowns and then growth resumed quickly as many city dwellers looked towards the exits, and made new home ownership their goal.
Since early 2003, we have collected warranty expense data from a list of 55 new home builders, some of which went bust during the Great Recession but most of which continue to operate to this day. From each of their annual reports and quarterly financial statements we gathered three essential warranty metrics: the amount of claims paid, the amount of accruals made, and the amount of warranty reserves held.
We also gathered data on the amount of homebuilding revenue they reported (minus land sales and mortgage-lending income, if any), as well as the number of homes they sold. Using this data, we were able to calculate the percentage of sales spent on claims (the claims rate), and two calculations regarding accruals: the percentage of sales set aside as warranty accruals (the accrual rate) and the dollar amount of accruals set aside per home sold (calculated by dividing the accrual total by the number of homes closed).
The surprising result of all this data-gathering is how unsurprising it all turned out to be. Longtime readers will remember what a pounding the new home builders took during the Great Recession more than a decade ago. This time around, during the pandemic, a few of them were mildly impacted while the bulk of them actually prospered.
Nationally, according to the U.S. Census Bureau, sales of new single-family homes rose about 15% last year to 815,000 units. For the group of publicly-traded builders that we track, sales were up about 10% to 260,000 units -- representing a little less than a third of the industry.
Among the top 18 builders on our list, which we will spotlight further on down in this week's newsletter, only three reported a revenue decline in 2020, and only one reported a net loss for the year. For the group as a whole, homebuilding revenue was up 9.2%, and profits grew to $8.2 billion, up from $6.2 billion in 2019.
Anecdotally, we have heard many pandemic-driven stories of people fleeing the cities, moving to their summer homes a year ago or into the suburbs for good. Apparently, now that office jobs are obsolete and commuting to work is a matter of switching rooms, one cannot be too far away from the virus. Whether this phenomenon reverses itself in 2021 and 2022 remains to be seen, but it looks like we have the data to prove the idea that the appeal of homeowning increased in 2020.
Warranty Claims Totals
Usually, in these annual reports, we present just the annual data, as we did in the March 12, 2020 newsletter. But that would smooth over the data, and eliminate the curious parts of the chart we see in Figure 1 below.
Given the timing of the lockdowns, one would expect the months of April, May and June 2020 to have been the most difficult for the providers of warranty work, who must enter a home in order to fix it (unless, of course, it's a roofing or siding issue). But as is clear from the chart below, the down quarter was July-to-September, which was otherwise a brief respite between the first and second waves of the pandemic's onslaught.
Figure 1
Homebuilding Warranties
Claims Paid per Quarter by U.S.-based Builders
(in US$ millions, 2003-2020)
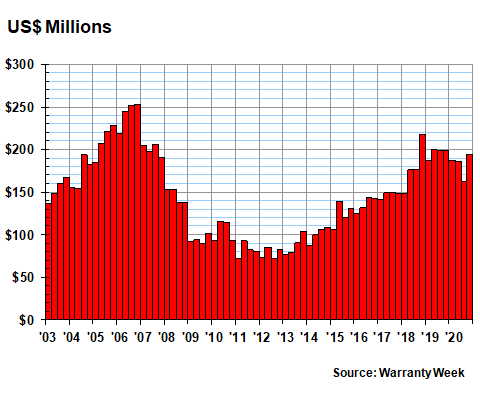
In the third quarter of 2020, new home builders spent just $163 million on claims, down -18% from the same year-ago quarter. And it was the steepest drop of the year, surpassing the -7% drop in the second quarter and the -2% drop in the fourth quarter of 2020. For the year, the amount of warranty claims paid by this group of builders was down $54 million or -6.8% to $730 million. But again, most of that drop took place in the third quarter.
Warranty Accrual Totals
In Figure 2, we're looking at the amount of warranty accruals set aside by the new home builders that we track. And by this measure, there were four quarters of growth in 2020. Accruals were up +12% in the winter, +5% in the spring, +7% in the summer, and up +12% in the fall, compared to 2019. For the year as a whole, warranty accruals rose by $61 million or +8.9% to $754 million.
Figure 2
Homebuilding Warranties
Accruals Made per Quarter by U.S.-based Builders
(in US$ millions, 2003-2020)
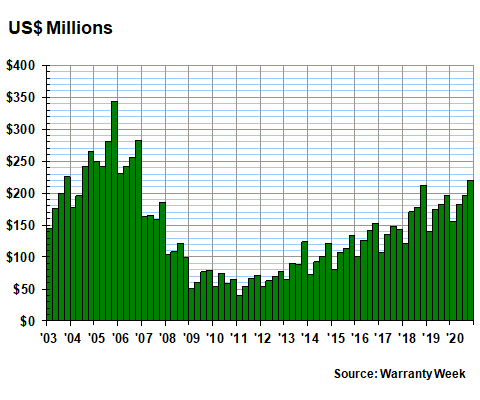
Notice how accruals so closely tracked sales growth. As we mentioned, unit sales were up +9.9%. Home sales revenue was up +9.2%. And warranty accruals were up +8.9%. This rough agreement in turn helped make the lines in Figure 4 so unappealingly boring and flat. No news is good news.
However, also note how far the industry fell from its peak in 2005 and 2006 to its trough in 2011. And in contrast, note how their warranty claims had one down quarter in 2020 and how accruals followed their traditional seasonal pattern of rising to a peak in the fall before falling back in the winter. It's happened in nine of the last ten years, with 2017 being the sole exception.
Warranty Reserve Totals
We measure the balances in the warranty reserve funds of the builders at the end of each quarter. So according to the data in Figure 3 below, as of December 31, 2020, new home builders carried a record amount of warranty reserves, surpassing the $1.4 billion total they carried at the ends of both 2018 and 2019 by nearly $100 million. And quite differently from Figures 1 and 2 above, they also decisively surpassed their decade-ago peak.
Figure 3
Homebuilding Warranties
Reserves Held per Quarter by U.S.-based Builders
(in US$ millions, 2003-2020)
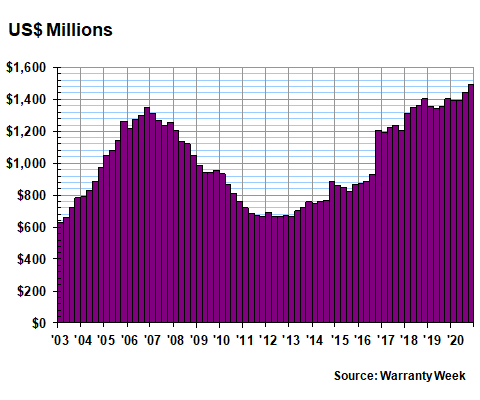
Another record also fell in 2020, but this one is a bit more obscure. If a company has $24 million in reserves and is spending $2 million a month on claims (or $6 million per quarter), then we could say its reserves are equal to 12 months of payments. In this industry, figures a bit under 24 months or two years are traditional. But in the third quarter of 2020, because of a fall in claims and a rise in reserves, that ratio hit a new high of 27 months. And that is exactly what one would expect to see if claims fall but accruals don't.
Warranty Accrual Rates
In this industry, as in the car industry, the top warranty providers report both unit sales and revenue totals. And because the units are relatively similar (albeit they span the gamut from starter homes to luxury mini-mansions, and from compact cars to street racers), we can readily calculate and compare the amounts they set aside in accruals per unit sold as well as accruals as a percent of sales revenue.
In Figure 4, we do both. By the end of 2020, new home builders were accruing an average of $2,657 per unit sold, and that was equivalent to 0.74% of their homebuilding revenue. Both those figures are virtually unchanged from the year-end 2019 readings: $2,659 and 0.73%, respectively.
Figure 4
Homebuilding Warranties
Average Warranty Accrual Rates
($ per home and % of revenue, 2003-2020)
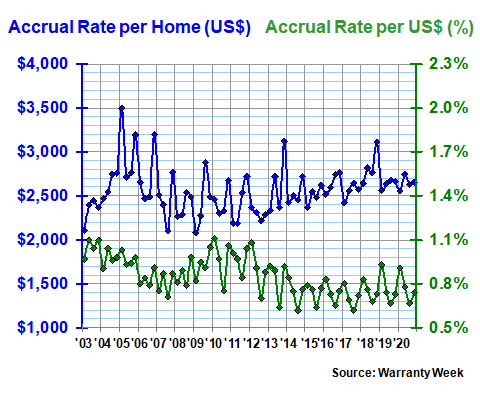
That consistency, in turn, is a reflection of how well-matched the growth of accruals has been to the growth in sales. It's as if the builders genuinely decided to set aside the same amount of funds every time they sold a home, as is the ideal for all warranty providers. But it also means there were relatively few surprises -- mold, moisture, drywall odors, etc. -- to drive up warranty accruals past the expected ratios.
Accruals by Individual Builders
In Figures 5 through 9, we will see that not everything was so unremarkable last year for the top 18 builders that we track. For instance, in Figure 5 we can see some sort of wild oscillation in the ratio between the unit sales and accrual totals of Toll Brothers Inc. over the four quarters of 2020. In the second quarter, it accrued $7,425 per home sold, and then in the fourth quarter if accrued only $1,968 per home sold. These figures were far above and far below its long-term average accrual of $4,070 per home sold.
Figure 5
Homebuilding Warranties
Warranty Accruals Made per Unit Sold
(in US Dollars, 2003-2020)
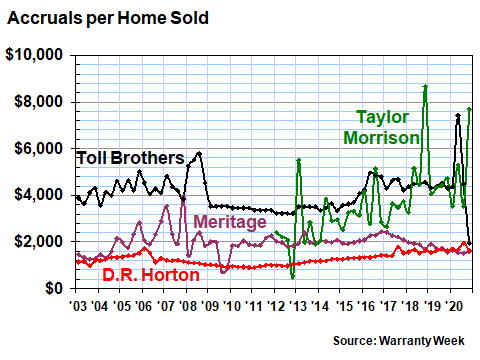
We can also see a sudden upturn at the end of the year for Taylor Morrison Home Corp., whose accrual rate per home sold soared to $7,693 in the final quarter of 2020. Meanwhile, both Meritage Homes Corp. and D.R. Horton Inc. turned in unremarkable steady-as-she-goes performances in 2020.
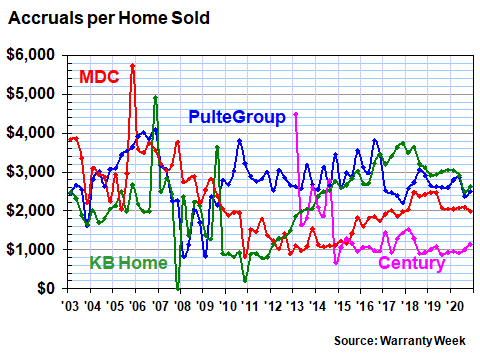
In Figure 6, we can see that while there was quite a bit of chaos in the metrics in past years, 2020 turned out to be rather quiet for these four builders. By year's end, KB Home had the highest accrual per home at $2,623, followed by PulteGroup Inc. at $2,497. M.D.C. Holdings Inc. was steady at $1,991 per home, while Century Communities Inc. was lowest at $1,149.
Figure 6
Homebuilding Warranties
Warranty Accruals Made per Unit Sold
(in US Dollars, 2003-2020)
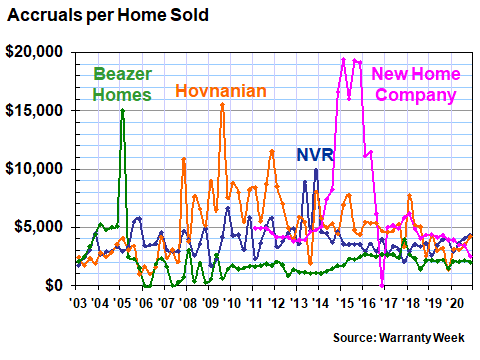
In Figure 7, we can see that New Home Company Inc. (yes, that is their real name) has settled down to industry-average levels after accruing as much as $19,300 per home sold back in 2015. Beazer Homes USA Inc. and Hovnanian Enterprises Inc. also had similar episodes years ago, but they too have settled into a more predictable pattern in 2020. In fact, the four readings of Beazer Homes' accrual rate last year were all below its long-term average and were all within $130 of each other. NVR Inc., on the other hand, saw its accrual rate rise steadily throughout the year, and was above average during the second half of 2020.
Figure 7
Homebuilding Warranties
Warranty Accruals Made per Unit Sold
(in US Dollars, 2003-2020)
In Figure 8, we're looking at two continuing operations and two builders that no longer report their warranty expenses. Shea Homes LP was never a public company -- it briefly reported its finances because it sold bonds that required it to do so. When those bonds were redeemed, it stopped reporting. And then William Lyon Homes was acquired by Taylor Morrison in February 2020, so it never delivered either its 2019 annual report nor any separate 2020 financial statements.
Figure 8
Homebuilding Warranties
Warranty Accruals Made per Unit Sold
(in US Dollars, 2003-2020)
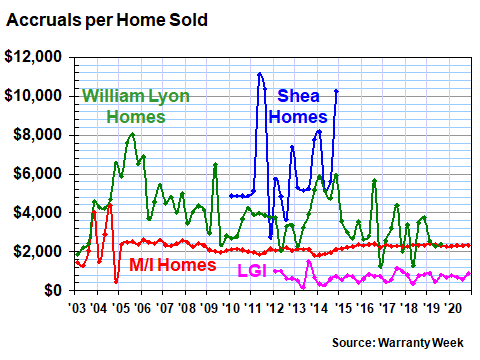
M/I Homes Inc., however, continued to deliver utterly consistent accrual rates per home sold, delivering four measurements in 2020 that were $100 or less below its $2,242 long-term average. And LGI Homes Inc. continues to hold the distinction of keeping its accrual rate below $1,000 per home sold, though that metric rose to $860 per home by year's end.
Our final chart looks busy, but because of mergers and acquisitions, it resolves to just one company by 2020. Standard Pacific Homes and Ryland Homes merged in 2015, and changed their name to CalAtlantic Group Inc. And then in early 2018, Lennar Corp. acquired CalAtlantic.
Figure 9
Homebuilding Warranties
Warranty Accruals Made per Unit Sold
(in US Dollars, 2003-2020)
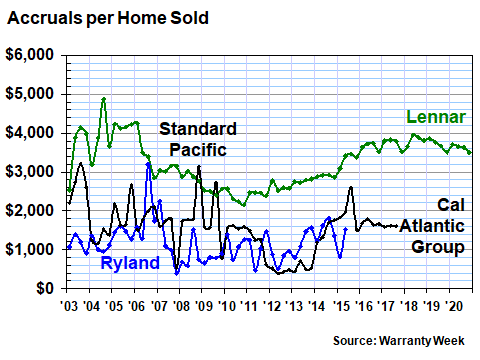
As can be seen by the shape of the line for Lennar, 2020 has been as uneventful in terms of warranty accrual rates as the few years before it. Over the 12 quarters since the CalAtlantic acquisition, its accrual rate has remained within a range of $3,500 to $4,000 per unit sold. Its unit sales rate, meanwhile, has not quite doubled since 2017, though revenue was relatively flat in 2020, compared to 2019.
Of the 14 top builders whose fiscal years end in October, November, or December, Lennar and NVR reported home sales revenue growth rates under 2.0%, while Toll Brothers reported a -2.0% decline in sales. PulteGroup was up 7% while KB Home was down -8%.
Nine others reported double-digit percentage changes in sales. Nobility and New Home were down by more than -10%, while Century Communities, Hovnanian, LGI Homes, M.D.C. Holdings, M/I Homes, Meritage, and Taylor Morrison each reported +10% sales gains. Admittedly, Taylor Morrison makes that list because of its acquisition of William Lyon Homes, which accounted for nearly a quarter of its 2020 revenue. But even without that acquisition, Taylor Morrison would be up for the year.
The thing is, just as we saw in last week's newsletter with the recreational vehicle manufacturers, not everybody's year was awful during the pandemic. Some companies actually did reasonably well, despite the lockdowns, the sickness, and the deaths. Or in this case, perhaps because of the lockdowns, the sickness, and the deaths in the cities, the allure of a new home on the outskirts of town became even stronger?