Eighteenth Annual Product Warranty Report:
When the pandemic began a year ago, shopping and work patterns changed radically, as many people found it hard to leave their homes or get to work. One would have expected a deep dive in warranty claims early on, but there was an even deeper drop in warranty accruals in the middle of the year, and a much higher makeup effort towards the end of the year.
By no means was this your typical downturn. Warranty management, by its nature, is half about dealing with whatever just happened and half about predicting what will happen in the future. And in early 2020, warranty managers seem to have overshot to the negative side when predicting how bad things would get during the pandemic and the lockdowns that followed, and then they overshot again to the upside towards the end of the year when trying to predict how swift the recovery would be.
In 2020 there were record amounts of volatility, as warranty managers radically reduced then raised their warranty accruals, and as customers postponed then demanded warranty work, with warranty providers ending the year carrying more money than ever before in their warranty reserve funds. Nobody seemed to know what would happen next as an unprecedented global health emergency shut down entire industries for months at a time, while others continued with business as usual.
For all U.S.-based manufacturers that issue product warranties, we look in the footnotes of their annual reports and quarterly financial statements for three essential warranty metrics: the amount of claims they paid, the amount of accruals they made, and the amount of warranty reserves they held at the end of each financial period. Usually, they're all buried in a table under "contingencies" or "liabilities" somewhere near the end of the reports.
We also look for the best representation of a total for warranted product sales, either on the income statement or in the revenue segmentation footnotes, so that we can calculate the claims rate and the accrual rate by dividing the claims and accrual totals by sales. This ratio, expressed as a percentage, represents the changing relationship between warranty expenses and product sales.
Based on a company's product line, each manufacturer is assigned to one of three sectors: vehicles, electronics, or building trades. And within those sectors, they are assigned to one and only one industry, such as cars, trucks, computers, appliances, medical equipment, new homes, or semiconductors. The goal is to allow us to compare and contrast the rises and falls in the totals and averages of these warranty metrics from one period to the next.
Each company typically publishes just one set of warranty metrics for all their products in all their markets. None publish product-specific failure rates or average cost per claim data, and those that operate internationally don't separate their warranty costs by country. Also, while some importers do publish warranty expense data in their home countries, many do not, because the requirement to do so is a U.S.-only rule that grew out of U.S. accounting scandals 20 years ago.
In the charts below, we will detail these totals and averages over the past 20 quarters, or five years, in order to provide a close-up view of what happened to these metrics during the year of the pandemic, when workers, suppliers, and customers had difficulties navigating around the lockdowns and the health emergency caused by the virus.
As we will show, the year 2020 ended up looking much like its own new kind of bathtub curve, with the two side walls happening in the first and fourth quarters, and this plunge taking place in the second and third. Had we instead defaulted to annual data, the year wouldn't look so bad, because the massive highs and the depths of the lows would have cancelled each other out.
Vehicle Warranty Accruals
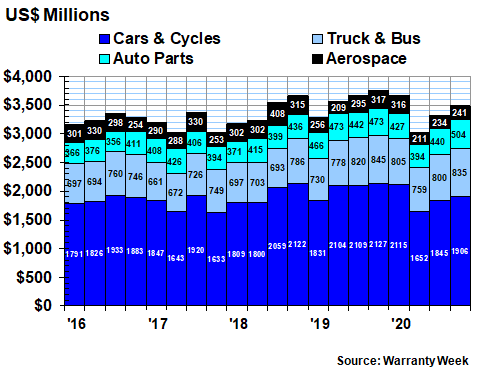
In the first chart below, we're looking at the total amount of warranty accruals made by companies in four industries: cars and cycles, trucks and buses, parts suppliers, and aviation. As is plain to see, both the highs and lows of the past 20 quarters were set last year in several industries, following the cycle of lockdowns and reopenings quite closely. The first quarter was down a bit; the second quarter was a write-off; the third quarter was about normal; and the fourth quarter was the time to make up for lost ground.
Figure 1
Worldwide Warranty Accruals Made
by U.S.-based Vehicle Makers
(accruals made per quarter in US$ millions, 2016-2020)
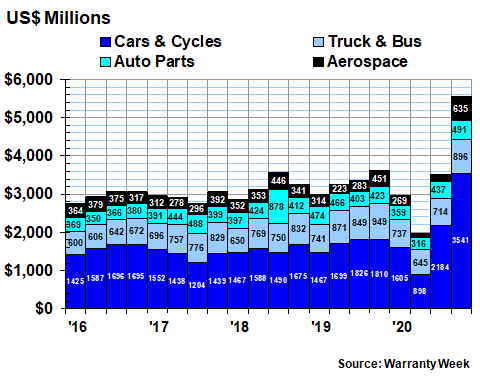
For the year as a whole, accruals in this vehicle sector were up by $771 million or +5.8% to $14.0 billion in 2020. But that annual summary glosses over both the depth of the second quarter plunge and the height of the spike in the fourth quarter. Actually, for the year as a whole, accruals were up +21% for cars & cycles, but they were down -12% for trucks & buses, -9.3% for auto parts suppliers, and were down -5.6% for aerospace manufacturers.
But the chaos at an even more granular level was a sight to see. For last year, let's say we calculate claims totals for these four industries over four quarters, for a total of 16 separate measurements. And then we calculate the same 16 measurements for the year 2019, and compare them. An incredible 11 out of the 16 measurements changed by +/-15% or more last year, with the car & cycle industry scoring both the low (claims fell -47% in the 2nd quarter) and the high (claims grew +96% in the 4th quarter) for the entire vehicle sector.
Electronics Accruals
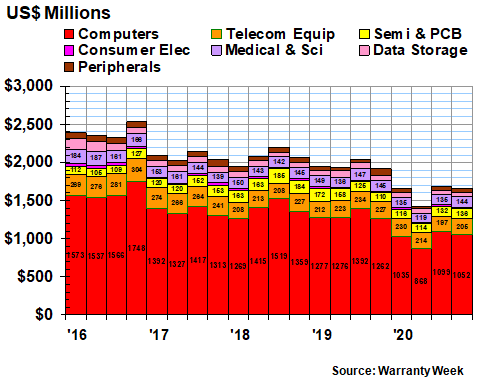
In Figure 2, we're looking at seven more industry categories grouped together under the heading of electronics. The largest by far is the computer industry, which is the home of Apple Inc. and its iPhone, as well as HP and IBM and all their gear. Other industries include data storage, computer peripherals, telecom equipment, medical equipment, consumer electronics, and semiconductors.
Figure 2
Worldwide Warranty Accruals Made
by U.S.-based Electronics Manufacturers
(accruals made per quarter in US$ millions, 2016-2020)
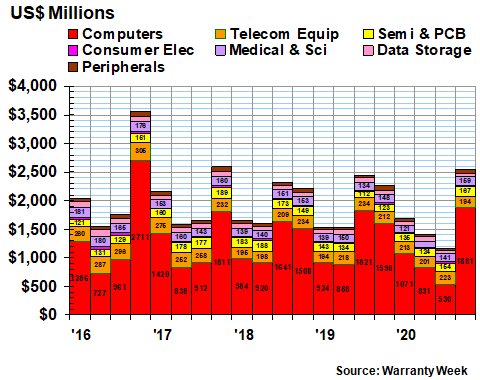
Warranty accruals in this electronics sector were down by $986 million or -13% last year to just under $6.8 billion. But once again, that glosses over the spikes and plunges of the seven individual industries during the four separate quarters of 2020.
For last year, let's say we calculate totals for seven industries over four quarters, for a total of 28 measurements. And then we calculate the same 28 measurements for the year 2019. Once again, 11 of the measurements changed by +/-15% or more last year, with the computer industry leading the plunge with a -71% drop in accruals in the third quarter, and the semiconductor industry leading the recovery with back-to-back +37% and +36% spikes in accruals during the third and fourth quarters of the year.
The only industry in this sector that did not change its total accruals by +/-15% or more last year was telecom equipment. Even during the second quarter, accruals were down by only -8%, compared to 2019. In contrast, in the consumer electronics industry (which is admittedly very small here because it does not include imports), accruals plunged -28% in the second quarter followed by a +32% spike in the third quarter.
Accruals in the Building Trades
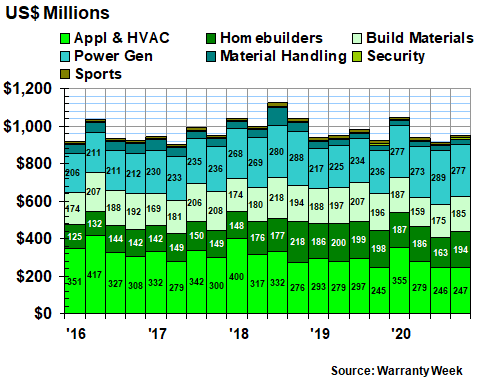
We track seven more industries under the heading of the building trades sector. Admittedly, some headings such as sports equipment have little to do with actual buildings, but they'd be a worse fit in either the vehicles or electronics sectors (although perhaps the Peloton Interactive Inc. exercise bikes with TV hookups span them all). But we include the new homes here, along with the appliances and heating/cooling systems they contain, building materials such as fixtures and furniture, roofing, carpets, windows and doors, electrical power generating equipment (both diesel and renewable), security systems, and material handling equipment.
On an annual basis, this sector's warranty accruals were down a sleepy two percent to $3.77 billion in 2020, but again, that glosses over the quarterly and the industry-by-industry comparisons. For instance, appliance and HVAC accruals were down by -40% in the third quarter of 2020, but that was more of a return to normal from a 2019 spike. And security system accruals more than doubled in the fourth quarter, but that's hard to see because the industry is so small.
Figure 3
Worldwide Warranty Accruals Made
by U.S.-based Building Trade Companies
(accruals made per quarter in US$ millions, 2016-2020)
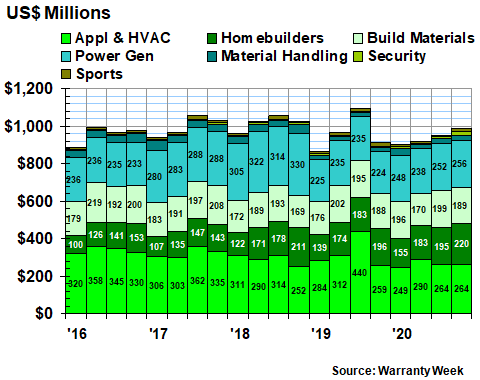
New home builders reported four straight quarters of moderate growth in accruals, as we detailed in our March 11 newsletter. Electrical power equipment makers did likewise, with no negative quarters and none with more than a +15% increase in accruals. But they were the only two industries to pull off that feat last year. All others featured either a spike or a plunge, or both.
Warranty Expense Rates
One would expect the chaos in accrual totals to show up in the warranty expense rates, but for the most part they didn't. In Figure 4, we've included all the available data going back to 2003, to highlight two phenomena. First, during the recessionary year of 2009, claims rates spiked and accrual rates plunged, while during the pandemic year of 2020 claims rates remained about the same while accrual rates fell then rose. Second, while during the ten years from 2003 to 2012 expense rates generally dropped, during the eight years since they have generally modulated up and down -- sometimes within the same year.
Figure 4
All U.S.-based Companies
Average Warranty Claims & Accrual Rates
(as a % of product sales, 2003-2020)
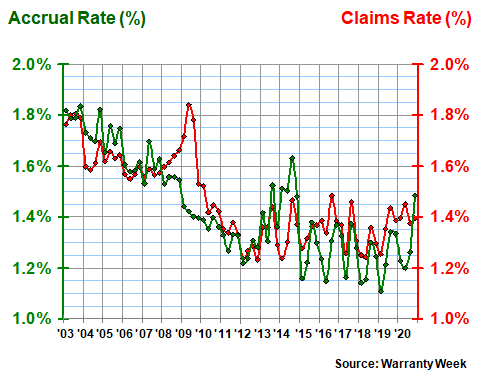
During the four quarters of 2020, the claims rate of all manufacturers remained very close to 1.4%. But in the second quarter of 2020, their average accrual rate fell to 1.2%, and then in the fourth quarter it rose to almost 1.5%. In recent years, the claims rate has been higher at points in 2017, 2016, and 2014, but the accrual rate hasn't been as high as it was at the end of 2020 since mid-2014.
The reason, we think, is a matter of timing. In the second quarter, sales dove and accruals plummeted faster. But in the fourth quarter, sales rose and manufacturers overcompensated with added accruals.
Once again, the annual data makes it sound like a smooth year: Accruals were down by -1.2% and product sales were down by -4.6%. And manufacturers ended the year setting aside about 1.5% of their product sales revenue as warranty accruals. But the quarterly measurements, and the industry breakouts, demonstrate how chaotic the data really was in 2020.
Warranty Claims Totals
While the amount of accruals made by manufacturers was heavily affected by predictions and expectations about what would or could happen, the amount of claims they paid was determined by what actually happened. Plain and simple, customers had a hard time getting out of the house and into the workplace during the months of April, May, and June 2020, and the data reflects that.
Almost anywhere we look, we can see a clear notch in the second-quarter claims data, not because people didn't need warranty work but because the logistics of doing so were quite formidable. During the second quarter of 2020, all U.S. manufacturers paid only $5.4 billion in claims, and that was the lowest total we've ever tabulated -- at least since companies began making public disclosures in 2003.
In the vehicle sector, the $3.02 billion that companies paid in warranty claims during the second quarter was the lowest three-month total they've reported since early 2014. And with this metric, there was no make-up period at the end of the year, as there was with accruals. In 2020, vehicle manufacturers and their suppliers paid out just under $13.5 billion in claims, and that was down -5.5% from 2019.
Figure 5
Worldwide Warranty Claims Paid
by U.S.-based Vehicle Makers
(claims paid per quarter in US$ millions, 2016-2020)
Strangely, the truck & bus manufacturers paid slightly more in claims during 2020 than they did in 2019, while the other three industry groupings paid out less. Top prize in terms of both money and percentages went to cars & cycles, which saw claims fall by $652 million or -8%.
But once again, if you go a level deeper into the data, you find more volatility. During the second quarter, car & cycle companies saw claims fall by -21%, while their suppliers saw a -17% decline. During the second half of the year, the aerospace manufacturers saw claims fall precipitously. But in the first quarter of 2020, claims actually rose swiftly, compared to the same period in 2019.
Electronics Claims Totals
In the electronics sector claims totals detailed in Figure 6, we see the same kind of notch in the second-quarter data. But because of a secular decline in both sales and expenses (once again, we are not including imports in this sector), the $1.43 billion reading for claims paid during the months of April, May, and June 2020 is the lowest-ever total, going back at least to when measurements began in 2003.
Figure 6
Worldwide Warranty Claims Paid
by U.S.-based Electronics Manufacturers
(claims paid per quarter in US$ millions, 2016-2020)
Claims fell and kept falling, so that for the year as a whole, they declined to $6.44 billion, down -18% from 2019 levels. And that was a new low for any year since 2003 for this sector. One level deeper, 12 out of the 28 quarter-to-quarter comparisons for these seven industries came in more than 15% larger or smaller than the year-ago totals, reflecting an even greater level of volatility than we saw with accruals. And once again, the second quarter was the most volatile, with claims down -32% for computers, down -31% for data storage systems, and down -28% for semiconductor and printed circuit board manufacturers.
Building Trade Claims Totals
On the surface, the seven industries included in the building trades sector seem the sleepiest, at least from a quick glance at Figure 7. And indeed, claims payments for the year as a whole hit $3.86 billion in 2020, up a slight 1.6% from 2019 levels.
However, once again, if we go a level deeper we can see the volatility. For the seven industries over four quarters, we have 28 totals we can compare to 2019 levels. And 14 of them were plus-or-minus 15% or better, including all four for the power generating equipment industry, and two apiece for building materials, security systems, and material handling equipment.
Figure 7
Worldwide Warranty Claims Paid
by U.S.-based Building Trade Companies
(claims paid per quarter in US$ millions, 2016-2020)
Overall, for the 18 industries that we track, over the four quarters that we measured, 32 out of the 72 claims total measurements were up or down by 15% or more. And six of those were up or down by 30% or more, suggesting an unprecedented amount of volatility in 2020. No wonder the accrual totals were so variable. Who can predict tomorrow when they don't know what happened today?
Warranty Reserve Balances
We have one more warranty metric to detail: the balance left in the warranty reserve funds of the manufacturers at the end of each quarter. We don't have space for all 18 industries we track, so in Figure 8 we've included just the top eight, with the smallest 10 combined into the dreaded "other" category.
Warranty reserve fund balances are always the least volatile of all the metrics we track, and 2020 was no exception. Out of the 72 comparisons we could make between 18 industries and four quarters, only six were +/-15%, and none were +/-30%. And only in the aerospace industry were there two +/-15% measurements for the year (they were both up, +19% in the second quarter and +18% in the third quarter, reflecting the growing warranty problems at Boeing Co.).
Figure 8
Worldwide Warranty Reserves
Held by U.S.-based Companies
(reserves held in US$ millions, 2016-2020)
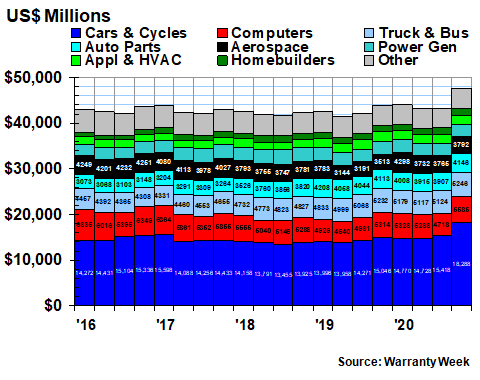
At the end of 2020, U.S. warranty providers carried $47.56 billion in reserves, and that was up by $3.63 billion or +8.3% from year-end 2019 levels. And that was a record for not just any year, but also for any of the 72 quarters since measurements began in early 2003.
And that in turn was caused primarily by the car & cycle manufacturers, whose $18.29 billion balance at the end of 2020 smashed the previous record by more than $2.76 billion. But others contributed as well, with the number two industry category of computers seeing their reserves grow by +5% to $5.59 billion, and the number five industry aerospace boosting its reserves by +8% to $3.79 billion by the end of 2020.
Overall, warranty reserves grew in 11 industries and fell in seven others. But in six, the balances hardly changed at all. For example, truck & bus manufacturers raised their collective reserve balances by $14 million to $5.25 billion -- a +0.3% increase. Auto parts suppliers raised their reserve balances by $138 million -- an +0.8 increase. And in both consumer electronics and medical equipment, balances fell by less than one percent.
In the weeks ahead, we will take deeper dives into some of these industries, while keeping in mind that the pandemic affected them all. In past newsletters we've already documented how some such as recreational vehicles and new home construction actually did well as the pandemic caused shifts in the way people felt about where they lived or how they traveled. In this newsletter, we showed how the warranty managers in some industries overdid the downturn in the spring and then overdid the upturn in the fall. And we expect to uncover additional surprises as we delve deeper into the data.