Warranty Expenses vs. Product Sales & Net Income:
We're adding a new metric into the mix: net income. When manufacturers boost warranty accruals, net income suffers. And when warranty expenses drop, net income rises. But is there really a correlation between net income and warranty accruals? Or perhaps warranty reserves and net income?
As external observers, we can look at the data in a company's annual reports and quarterly financial statements and figure out how much they're spending on product warranties. And we can measure the changes from year to year and figure out who's cutting costs the most and who's having a bit of a crisis.
According to U.S. accounting rules, all manufacturers that use the accrual method to process warranty costs must reveal the beginning and ending balances in their warranty reserve, the net additions and subtractions, and any adjustments they make for acquisitions, foreign exchange, and other reasons. But they don't have to tell us what effect their warranty expenses have upon their profitability.
This week, we're setting out to invent some new warranty metrics, to see what we get, and check if it's useful. At the end of 2019, at the suggestion of warranty expert Ron Giuntini, we began collecting an additional metric from every financial statement, for net income. And we began collecting not only the most recent data, but also the year-ago figures. So for each of the U.S.-based warranty providers we track, we now have nine quarterly measurements of net income, stretching back to the fourth quarter of 2018.
Now the question is what to do with this data? We already have 18 years of data for claims paid, accruals made, and reserves held, along with totals for warranted product sales. And with that sales data in hand, we are able to calculate the claims rate (claims as a percentage of sales) and the accrual rate (accruals as a percentage of sales). So we have six metrics. Do we need a seventh?
Warranty Expense Rates
First, let's take a close-up look at the last five years of data for the claims and accrual rates. In Figure 1, we can see the gradual annual and seasonal oscillations of the two rates from 2016 to 2019, and how they both remained a bit higher than usual in 2020. In fact, at the end of 2020, the accrual rate hit its highest level (1.48%) since the middle of 2014.
Figure 1
All U.S.-based Companies
Average Warranty Claims & Accrual Rates
(as a % of warranted product sales, 2016-2020)
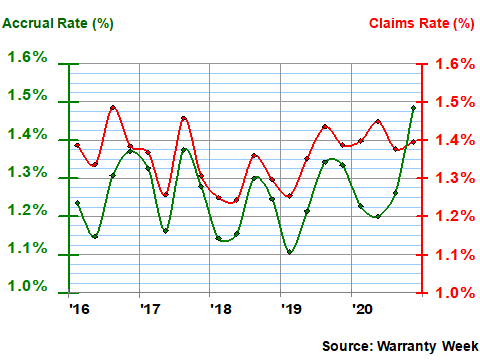
Of course, the claims and accrual rates represent an interplay between warranty expenses and sales totals, so the percentage rates rise when sales fall as well as when the underlying expenses themselves rise. Last year, both sales and accruals plunged more or less proportionally early in the pandemic, but then later in the year accruals rose faster than sales, driving the percentage rate up to that six-year high.
Sales & Net Income Data
So let's introduce the new metric: net income, and at the same time let's detail the usually unseen metric: warranted product sales totals. In Figure 2, we're displaying twenty quarters of sales data, and nine quarters of net income data. The sales data is in billions of dollars, and the net income data is expressed as a percentage of sales -- the profit margin.
Figure 2
All U.S.-based Companies
Warranted Product Sales vs. Profit Margin
(in $ billions & as a %, 2016-2020)
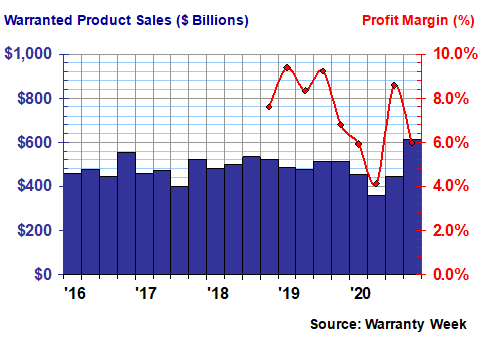
By the way, for anyone who's wondering which net income data we collected, it was always the bottom-line figure -- the one they use to calculate earnings per share, and the one that usually gets double-underlined in the income statement. From the data we've collected so far, it appears that for most warranty-providing manufacturers, eight or nine percent profit margins seem to be the typical average. But in the lockdown-plagued second quarter of 2020, that ratio dropped to four percent.
Accruals vs. Net Income
As was mentioned, at the end of 2020 the accrual totals suddenly shot up to a recent high of 1.48% of sales. Figure 3 shows that figure in dollars ($9.1 billion), and also shows the second-quarter plunge in dollars ($4.3 billion). That one year could hold the record for both most and least accruals per quarter shows just how crazy 2020 really was, as the ebb and flow of the virus drove us inside, outside, then back inside again.
Figure 3
All U.S.-based Companies
Warranty Accruals vs. Income / Accrual Multiple
(in $ billions & as a multiple, 2016-2020)
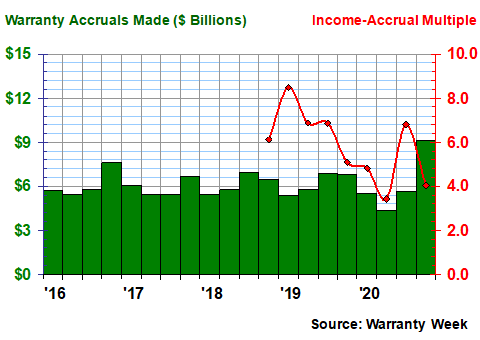
Rather than repeating the data for accruals as a percent of sales, we've invented a new metric here: the Income-Accrual Multiple, which is calculated by dividing net income by accruals. As the data collected so far suggests, in ordinary times the multiple seems to be in the range of six to eight, meaning that net income is typically six, seven or eight times as large as the accrual total.
However, in that awful second quarter of 2020, this ratio dropped to only 3.4, with net income at $14.8 billion and accruals at $4.3 billion. And then, in the fourth quarter, when net income recovered but accruals really soared, that ratio fell again, this time to 4.0 (net income rose to $36.6 billion while accruals rose to $9.1 billion).
Flipping back to Figure 2 for a second, it's clear that accruals and sales have remained more or less proportional over the past year. Sales dipped to $360 billion in the second quarter, but recovered to $612 billion in the fourth quarter. This in turn drove the accrual rate down to 1.20% in the second quarter, and up to 1.48% in the fourth quarter.
Warranty Reserves vs. Net Income
In Figure 4, we're trying out one more set of comparisons, and inventing one more warranty metric. In round numbers, it appears that in normal times, the amount of warranty reserves held by U.S.-based manufacturers is approximately the same as their net income, give or take. For instance, at the end of 2018, manufacturers reported $39.6 billion in net income and held $41.8 billion in reserves (a ratio of 95%).
And then at the end of 2019, net income was down to $34.7 billion while reserves were up to $43.7 billion, for a ratio of 79%. In the fourth quarter of 2020, net income was up to $36.6 billion and reserves were up to $47.6 billion, for a ratio of 77%. In between those annual end points, the ratio swung from 113% all the way down to 34%.
Figure 4
All U.S.-based Companies
Warranty Reserves vs. Income / Reserves Ratio
(in $ billions & as a %, 2016-2020)
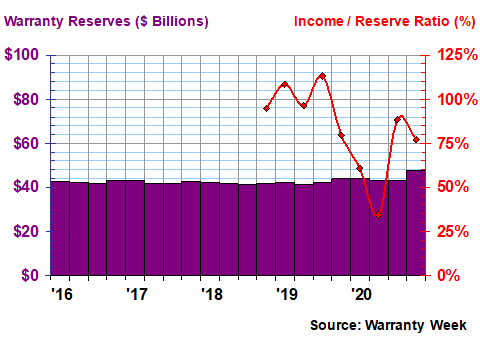
This wide swing serves to show how unstable the net income metric is compared to the stability of the warranty reserve fund balances. But we already knew how unstable the net income data was from looking at Figure 2. The story of that second quarter of last year is that while warranted product sales fell, and accruals fell proportionally, but net income plunged. Compared to the second quarter of 2019, sales were down 24%, and accruals were down 25%, but net income was down 58%.
The question is, does any of this new data appear to be useful? We know for sure that there's a direct relationship between net income and accruals, in the sense that larger accrual totals mean smaller net income figures, and vice versa. What we don't know is whether there's any relationship between net income and warranty reserves, beyond the obvious link that when funds are taken out of the reserve fund through a change of estimate, they go right to the bottom line.
Perhaps the most illuminating statistic of all is that despite the volatility of the income-to-accrual multiple, for the past nine quarters net income has been an average of 5.8 times as large as accruals. Or, if you prefer the inverse, accruals have on average been about 17% as large as net income. Secondarily, or other new metric suggests that for the past nine quarters, the total net income of these manufacturers has been about 84% as large as their combined warranty reserve balances.
Not Enough Data?
However, both those measurements are a blend of the "normal" data from 2018 and 2019 and the pandemic data from 2020. If we had 18 years of net income data to compare with our 18 years of warranty data, we could make more definitive measurements. And we would know what happens during financial crises like in 2009 and in health crises like in 2020.
But there's one very big problem with these new ratios, and it is simply the fact that while both the accrual and reserve totals can be either zero or a positive number, net income can also be a negative number (a net loss). And while what we're doing here is adding together hundreds of positive and negative numbers to get a net number that's so far always been positive, there is no guarantee that will be the case during the next recession. Should there be a negative ratio?
But the even more basic question remains: is any of this data useful? We could parse it by industry or even by individual companies, figuring out which manufacturers and which industry sectors are above or below average, in terms of warranty expenses and net income. Or maybe it's not worth it, in the sense that net income is affected by far more than just product sales, let alone the warranty expenses those sales generate. Please weigh in with your thoughts.