European Automaker Warranty Expenses, Part 2:
In this latest part of a worldwide roundup of automaker warranty expense totals and averages, we find that VW has always had the highest costs, while the French companies have always had the lowest. This doesn't correlate well with either customer perceptions or reliability trends, but facts are facts, while opinions are subject to bias (and advertising).
Because of the pandemic, car sales by seven manufacturers based in Europe plummeted last year, but their claims remained about the same and their warranty accruals fell less slowly. So there were some curious annual changes in expense rates. But as the twin effects of air bag recalls and diesel emission test scandals retreat into the distant past, their warranty metrics are beginning to return to normal levels.
Every year since 2003, we've rounded up the warranty expense numbers of all the major manufacturers worldwide. And we plan to do so again this year, but not all at once. Instead, we will publish a series of regional annual updates, followed by a global summation later on.
This week's newsletter is the second half of a two-part European automaker report, focusing on seven of the top car manufacturers based in Europe: BMW AG, Daimler AG, Fiat Chrysler Automobiles NV, PSA Peugeot Citroen, Renault S.A., Volkswagen AG, and the Volvo Car Group. Last week we took a detailed look at the 2020 totals and averages. This week we will look at the 2016-to-2020 trends.
From the annual reports of each company, we gather three essential warranty metrics and two additional sales metrics. The warranty metrics are the amounts of claims paid, the amounts of accruals made, and the amounts of warranty reserves held at the end of each fiscal year. The sales metrics are the amounts of automotive product revenue and the number of vehicles sold.
Because all the European data is annual, there is no benefit from dividing it up into four equal quarterly amounts. Each sequence of four data points would be exactly the same, and there would be no fluctuations observed from one quarter to the next (except from the end of one year to the beginning of the next year). However, if you remember from the U.S. automaker report, there was a deep dive in the second quarter of 2020, and a big spike in the fourth quarter, which we correlated with the lockdowns and the reopenings of the pandemic.
Using the warranty and sales metrics contained in each annual report, we are also able to calculate three additional metrics: the claims rate (claims / revenue), the accrual rate (accruals / revenue), and accruals per unit sold (accruals / vehicles).
In most cases, we gather the data and make the calculations in each company's native currency, then we convert everything into U.S. dollars, using the yearly average exchange rates published by Fiat Chrysler Automobiles (for the euro) and by the IRS (for the Swedish kronor). Keep in mind that because these exchange rates also fluctuate, they may change the year-to-year increases or decreases in and of themselves.
Warranty Claims Totals
Let's begin with five years of claims data. The highest annual amount was by far the equivalent of US$30.4 billion paid by these seven manufacturers in 2017, when the twin crises of the emissions test cheating and the air bag replacements were conspiring to drive up several manufacturers' warranty costs. In fact, by 2018 their claims payments were back down to US$24.0 billion, and last year they dipped to US$22.9 billion.
Figure 1
Warranty Claims Paid By
Seven European Manufacturers
(in US$ billions, 2016-2020)
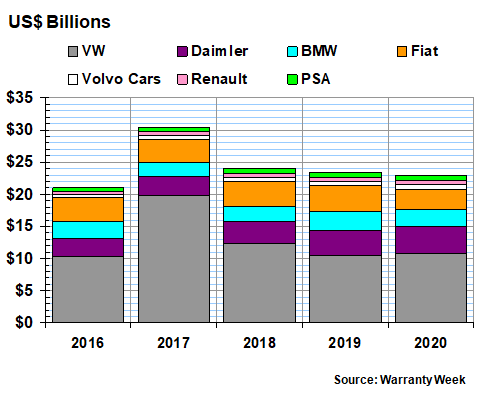
The value of the euro changed from US$1.12 in 2019 to US$1.14 in 2020, so that contributed little to the annual fluctuations. But the exchange rate was as high as US$1.18 in 2018 and as low as US$1.11 in 2016, so we cannot say it has no effect at all.
But the annual change in the dollar total from 2019 to 2020 was -$581 million, or -2.5%. Within that metric, however, Volvo, Daimler, and VW saw annual increases in claims cost, while BMW, Fiat, PSA, and Renault saw annual decreases. Fiat saw the largest annual decrease (-21%) while Volvo saw the largest annual increase (+23%). Renault and PSA each saw -16% decreases, while Daimler saw a +10% increase. VW and BMW saw smaller annual fluctuations.
Warranty Claims Rates
When we take product sales into account (see Figure 1 in the May 20 newsletter for details), we find that only Fiat Chrysler saw an annual decrease in the percentage of revenue that went towards paying claims last year. And that's only because its claims rate fell from 3.55% of revenue to 3.51%. Or to put it a different way, claims fell -21% while revenue fell -20%, so the rate fell -0.04%.
Everyone else saw their claims rates rise, as did the industry average (from 3.0% in 2019 to 3.5% in 2020). The main reasons for that big jump were even larger percentage increases by top manufacturers such as VW and Daimler. But the biggest relative rate increases were reported by PSA and Volvo, as can be seen in the chart below.
Figure 2
Warranty Claims Rates of
Seven European Manufacturers
(as a percentage of product revenue, 2016-2020)
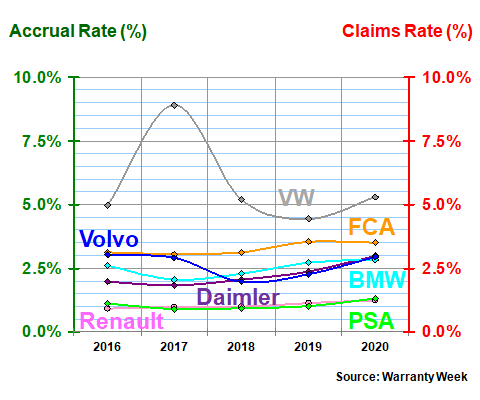
Note that over the past five years, the two French manufacturers have reported the lowest claims rates. Without making you skip ahead, we can also report that they have the lowest accrual rates. This suggests either they have the best cars or the best accountants. Reliability reports by third parties suggest the latter, but the true test will be when the newly-combined Stellantis N.V. has to either confirm or deny the previously separate reports of Fiat and PSA.
Other merger partners have reported they were shocked to discover just how different their warranty-counting systems were. For instance, how did they account for parts costs? What about recalls? What about indirect costs such as call centers and dealer training? There are numerous ways to tabulate what is and what isn't a warranty expense. Our only hope is that they remain consistent with their methodologies from one year to the next.
The other thing we wanted to point out about Figure 2 is how high Volkswagen's claims rate has been over the past five years. In 2017 it topped-out at 8.9%, and in 2020 it went back above five percent. During this time period, no other auto manufacturer reported a claims rate above four percent. And, without making you skip ahead too much, none besides VW reported an accrual rate above four percent either (Figure 4).
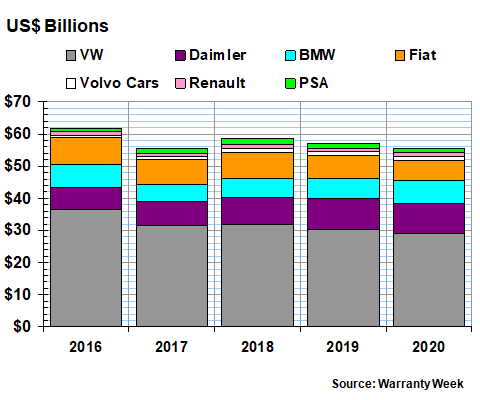
Warranty Accrual Totals
In Figure 3, we are detailing the annual accruals made by these seven manufacturers, once again translated from euro and kronor into dollars. This conversion to a common denominator will simplify things later on this summer when we add in the Chinese, Japanese, Korean, and Indian warranty data that usually arrives in June, July, and August.
It's difficult to see by eye, but VW's share of the total is actually decreasing, from more than half in 2016, 2017 and 2018, to less than half in 2019 and 2020. Meanwhile, Fiat's share peaked in 2016; BMW's share peaked in 2020; and Daimler's share peaked in 2019. Volvo, Renault, and PSA combined have never accounted for more than ten percent of the continent's auto warranty accruals, though in 2018 they came close to doing so.
Figure 3
Warranty Accruals Made by
Seven European Manufacturers
(in US$ billions, 2016-2020)
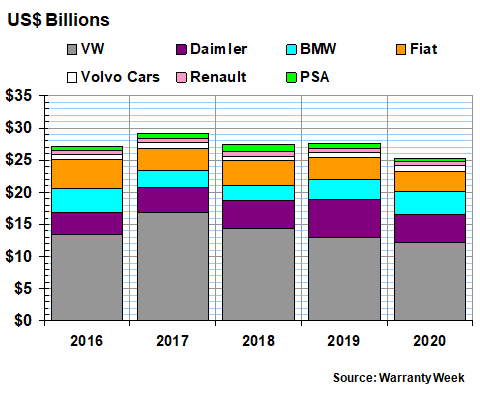
Warranty accruals were down for this group by -US$2.4 billion or -8.6% in 2020, compared to 2019 totals. Fiat fell a bit faster, while VW fell a bit slower than average. Big annual declines were reported by PSA (-45%), Daimler (-25%), and Fiat Chrysler (-17%), while a big gain was reported by Volvo (+38%). According to the U.S. taxman, the value of the kronor rose only slightly, from 9.46 to the dollar in 2019 to 9.21 to the dollar in 2020. So this factor cannot be blamed for that spike.
The only one of the seven we didn't mention is BMW, which saw its accruals rise by +12%, from the equivalent of US$3.17 billion to US$3.56 billion. But the company's annual accrual total was even higher in 2016 (US$3.56 billion), when the air bag recalls were in full swing.
Warranty Accrual Rates
Because of the pandemic, both unit sales volumes and automotive revenue totals were down for all seven manufacturers in 2020. Unit sales fell by -18 to 24.1 million vehicles sold worldwide, while worldwide automotive revenue for these seven companies fell by -17%, or -US$131.8 billion.
We mention that here because in this industry we can measure the accrual rate two ways: as a percentage of revenue, and as an amount set aside per vehicle sold. The calculation formulas are straightforward: accruals / revenue = % and accruals / units = $ per unit.
We'll start with the more familiar metric, which is accruals as a percentage of revenue. In Figure 4, the five-year European industry average starts out at 4.0% in 2016, falls to 3.4% in 2018, and rises back to 3.9% in 2020. That's because Fiat and PSA reported their highest accrual rates in 2016, and BMW, Volvo, and Renault reported their highest accrual rates in 2020. Meanwhile, VW's peaked in 2017 and Daimler's peaked in 2019.
Figure 4
Warranty Accrual Rates of
Seven European Manufacturers
(as a percentage of product revenue, 2016-2020)
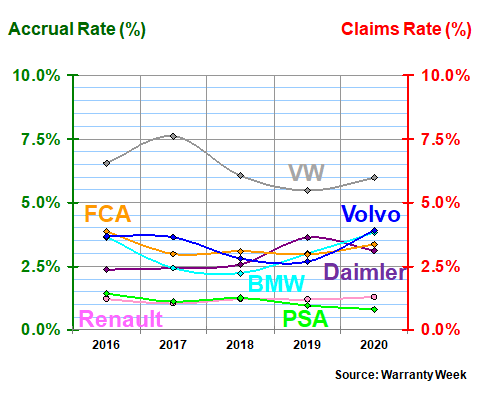
Last year, both VW and Volvo's accrual rates were above the industry's average. In 2019, it was VW and Daimler. From 2016 to 2018, it was VW alone above the median. But because the company's sales and accrual totals are so large, it is able to weight the average all by itself. And it's always had the highest accrual rate in the industry, even during the years of 2008 and 2012, when its accrual rate briefly dipped below five percent.
Absent a meaningful change in either reliability or repair cost, accrual rates should remain about the same from one year to the next. Unlike claims and revenue, which pursue different tracks from one year to the next, because of the lag time between when a car is sold and when it requires warranty work, accruals and revenue should remain more or less proportional, even during a recession. If less cars are sold, less accruals are made at the time of sale.
Most of the five-year curves actually do show little variation -- in fact the curves for PSA and Renault are nearly flat, and Fiat is close to it. However, only Renault kept the ratio between accruals and sales nearly proportional last year, as the pandemic decimated sales. The other six did not, so their accrual rates changed noticeably. Daimler and PSA cut accruals faster than sales fell, so their accrual rates also fell. Fiat, BMW, Renault, and Volvo cut their accruals less than sales fell, so their accrual rates rose.
Accruals per Vehicle Sold
The other way we can measure the accrual rate is in dollars per vehicle sold. In this case, with these companies, we could also measure it in euro per vehicle, but then we'd have to convers Volvo's kronor into euro. And we'd have to make further conversions later on this year when we add in the American and Asian manufacturers. So we'll do it in dollars, keeping in mind that this can alter the results all by itself.
In Figure 5, we're keeping the colors consistent but the companies have been rearranged in terms of descending cost per vehicle in 2020. At the top is Daimler at US$1,548 per vehicle, followed by Volvo at US$1,492 per vehicle, BMW at US$1,426 per vehicle, and VW at US$1,331 per vehicle.
The median in 2020 was US$1,050 per vehicle, up from US$941 per vehicle in 2019. Fiat, Renault, and PSA have always been below the median, while VW, Daimler, BMW, and Volvo have always been above. This pattern correlates well with both their average price per vehicle and customer perceptions regarding luxury vs. economy nameplates.
Figure 5
Warranty Accruals Made per Vehicle Sold by
Seven European Manufacturers
(in US$ dollars, 2016-2020)
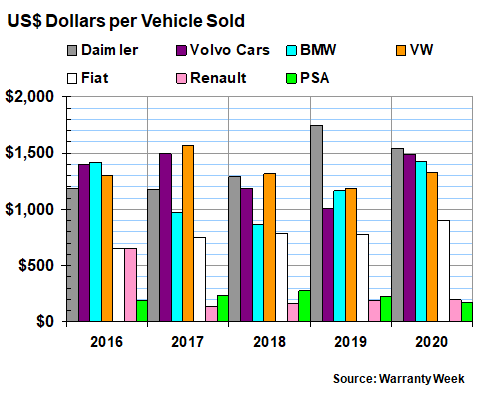
However, as with the measure of accruals as a percentage of revenue, this metric should not change much from year to year. Yet it does. Last year, for instance, six out of the seven companies changed their accrual rate per vehicle sold by plus-or-minus ten percent or more. Only Renault kept it relatively the same, albeit at the absurd rates of only US$187 and US$198 per car (again, the triumph of French accounting).
Does that sound unfair? Well, please also consider that Volvo's and BMW's accrual rate per vehicles rose, and Daimler's fell by more than either PSA or Renault accrued in total per vehicle last year. So again, this suggests either they have the best cars or the best accountants in Europe. We suspect the latter.
Warranty Reserve Totals
We have one more warranty metric to consider: the balance reported in the warranty reserve fund at the end of the year by each company. As we mentioned last week, it's a metric that has slowly declined for VW (except for 2017-2018, when it fell in euro but was skewed by the dollar conversion rates).
For Daimler, PSA, and Renault, the reserve balance rose and then fell over the past five years. For BMW, it fell and then rose. For Fiat, it fell, then rose, then fell again. And for Volvo it just rose.
Figure 6
Warranty Reserves Held by
Seven European Manufacturers
(in US$ billions, 2016-2020)
The total reserve balance at the end of 2020 for these seven companies was US$55.5 billion, down from US$57.1 billion at the end of 2019. But at US$61.7 billion, 2016 remains the peak, and again we can point the finger at the emissions testing scandal and the air bag recalls.
As a share of the total, VW's reserves have also been gradually declining since 2016, while for Daimler and BMW they hit a new high in 2020. And the relative reserve levels of Renault, PSA, and Volvo combined have ranged from just under five percent to just over seven percent of the total -- barely large enough to be seem in this chart.
Months of Claims in Reserve
And finally, though we don't have a chart for this somewhat esoteric metric, when we divide the year-ending reserve balances by the amount of claims each company paid per month last year, we calculate that Fiat Chrysler Automobiles currently maintains 24 months' worth of reserves; Daimler keeps 27 months' worth; BMW is at 31 months; and VW is at 32 months. In comparison, the Ford Motor Company was at 24 months and General Motors Co. was at 34 months at the end of 2020. Tesla Inc. ended last year at 48 months, which reflects its conservative attitude about fully financing future claims costs.