American Home Shield During the Pandemic:
While sales of existing homes dipped during the worst of the lockdowns, they soared for the rest of last year. But while home warranties have historically been closely tied to the sale of existing homes, American Home Shield has moved on to selling the annual policies directly to homeowners staying put, and then encouraging those homeowners to renew year after year.
American Home Shield, by far the largest provider of home warranties to U.S. consumers, seems to have weathered the effects of the pandemic and the lockdowns that came with it. The metrics contained in its financial reports, measured in seven different ways, show only minor downturns and not even a flattening of their upward slopes over the past five years.
American Home Shield, along with HSA, OneGuard, and Landmark Home Warranty, are the home warranty brands owned and operated by Frontdoor Inc. AHS was founded in 1971 and pioneered the home warranty industry as an independent company until it was acquired by ServiceMaster Brands in 1989. In addition to AHS, HSA, OneGuard, and Landmark, ServiceMaster also accumulated other home care and lawn care brands such as Terminix, TruGreen, and Merry Maids, before reversing its acquisitive strategy a decade ago and beginning a series of divestments and spin-offs.
In 2018, ServiceMaster spun off the home warranty business, creating a holding company called Frontdoor Inc. The spin-off was completed October 1, 2018, through the issuance of one new Frontdoor share for every two shares of ServiceMaster common stock. ServiceMaster Global Holdings Inc. subsequently renamed itself Terminix Global Holdings Inc., to reflect its new focus on exterminator services. And then in March 2019, Terminix sold its remaining 16.7 million shares of Frontdoor, resulting in the full separation of the two companies.
All along, the home warranty business continued to grow, and AHS continued to dominate it. According to Warranty Week estimates, AHS and its sister companies continue to gradually expand their market share, from 42% of a $1.56 billion market back in 2010 to nearly 47% of a $3.15 billion market in 2020.
Frontdoor itself estimates that 1.4 million out of the 5.64 million existing homes sold last year in the U.S. had home warranties purchased by either the buyer or the seller, and that four million out of an estimated 121 million homes in existence were currently covered by a home warranty. It estimates its own customer count at 2.25 million home warranty clients at the end of last year, up from two million at the end of 2017.
Frontdoor said a significant percentage its revenue is concentrated in the western and southern regions of the U.S., including the states of Arizona, California, Florida, and Texas. This is a reflection of the importance of having air conditioning and service contracts in force for those systems during the hot summer months. Outside of the sunbelt, customers typically purchase home warranties to cover not only their heating and cooling systems, but also their kitchen and laundry appliances. Some also elect to cover home computers and electronic entertainment systems.
Home Sales Rose in 2020
Much of the analysis we've done this year on product warranties has looked for signs of damage from the pandemic, especially during the late winter and spring of 2020 when the lockdowns made in-person shopping complicated and warranty work difficult to arrange. But in the March 11, 2021 newsletter, we found that new home sales were actually up by 15% last year, and that warranty expenses were keeping pace.
This week, we find that same pattern with existing home sales, using home warranties as a proxy. According to the National Association of Realtors, existing home sales hit a 14-year high in 2020. After plummeting in March and April of last year, sales suddenly began to soar in May. By the end of 2020, 5.64 million homes changed hands, the highest total since 2006. Nobody saw that coming.
Frontdoor doesn't provide any metrics for how many home warranties it sold, but it does provide detailed segmentation for its revenue. What we aim to do this week is take you though some of those details, focusing on the years since it was separated from ServiceMaster.
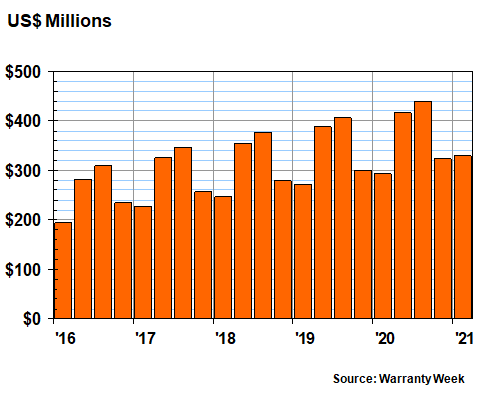
Let's begin with a simple chart of 21 quarterly measurements of total revenue, taken from the company's annual reports and quarterly financial statements. Notice the half-year seasonal pattern for the revenue: April-to-September are typically great, but October-to-March are typically lifeless.
But also notice in Figure 1 that both the peaks and valleys in this chart always have an upward slope. In other words, revenue in the second quarter of 2020 was up 7.5% from revenue in the second quarter of 2019. And revenue in the first quarter of 2020 was up 8.5% from the same quarter a year before. Revenue grew 12% in the first quarter of this year, compared to 2020. There are no annual declines -- not one!
Figure 1
Frontdoor Inc.
Quarterly Revenue
(in US$ dollars, 2016-2021)
In its most recent annual report, Frontdoor provides a bit of perspective on this seasonal revenue pattern.
Our business is subject to seasonal fluctuations, which drives variations in our revenue, net income and Adjusted EBITDA for interim periods. Seasonal fluctuations are primarily driven by a higher number of central HVAC service requests in the summer months.
In 2020, approximately 20%, 28%, 30%, and 22% of our revenue, approximately 12%, 43%, 43%, and 2% of our net income, and approximately 17%, 37%, 34% and 12% of our Adjusted EBITDA was recognized in the first, second, third and fourth quarters, respectively.
And if that explanation did not suffice, here is our graphical representation of the seasonal pattern of net income, calculated as a percentage of total revenue from the start of 2016 to the end of the first quarter of 2021. Note that because back in 2016 Frontdoor was still part of ServiceMaster, which did not publish home-warranty-only amounts for net income, we had to use four equal calculations of 12% for the four quarters of that year.
Figure 2
Frontdoor Inc.
Profit Margin
(Income / Revenue, 2016-2021)
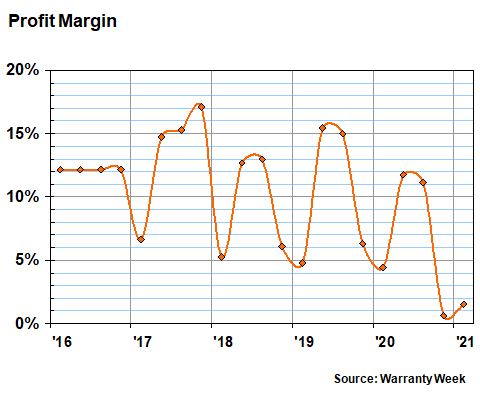
In all of these financial metrics, the only sign of a slowdown seems to have been the six months between October 2020 and March 2021, when the company's profit margin dipped below two percent for the first and only time in its independent existence. Net income fell from $60 million in the second quarter of 2019 to $49 million in the second quarter of 2020, and its profit margin slipped from 15% to 12% as a result.
Revenue per Customer
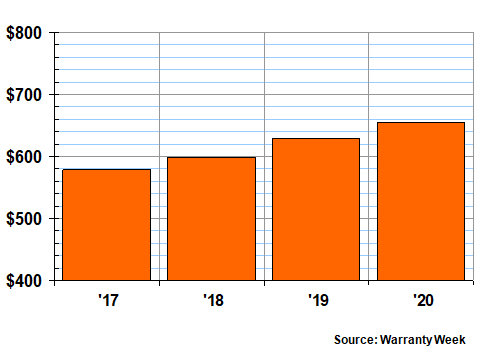
Frontdoor also periodically announces how many home warranty customers it has. That metric has also been growing annually, with a generous amount of annual renewals and more new contract signings than drop-offs. In Figure 3, we've taken that metric one step further, and calculated the amount of revenue per customer, which has also apparently been growing steadily, from $579 in 2017 to $655 in 2020.
Figure 3
Frontdoor Inc.
Revenue per Customer
(per Year, 2017-2020)
In nearly all financial reports, there is a section where companies detail all sorts of possible perils, warning investors that the good times will not go on forever. They typically warn us of war, drought, terrorism, fires, strikes, floods, meteor strikes, and in this last year, of pandemics. Frontdoor took that a step further, and included in its most recent annual report a synopsis of what actually happened when the virus struck:
During 2020, our results of operations and financial performance were adversely impacted by the COVID-19 pandemic as follows:
- We experienced a decline in first-year real estate sales attributable, in part, to the adverse impact COVID-19 had on U.S. existing home sales in the second quarter of 2020. Due to the annual nature of our home service plan agreements, the impact of this decline carries forward into future periods.
- We experienced an increase in appliance and plumbing claims primarily due to the increased usage of home systems and appliances driven by state and local shelter-at-home orders and recommendations. In addition, industry-wide availability challenges in the appliance trade have caused increased cost pressure, and, more specifically, appliance parts availability challenges drove additional replacements, contributing to the increased costs.
- We increased our marketing spend in the first-year direct-to-consumer channel to help mitigate the decline in first-year real estate sales.
- We incurred incremental wages at our customer care centers due to increased demand driven by temporary closures at our offshore business process outsourcers and a higher number of service requests in the appliance and plumbing trades, which is primarily a result of customers sheltering at home in response to COVID-19.
- We incurred incremental direct costs in response to COVID-19, which were temporary in nature and primarily related to incremental health and childcare benefits for our employees and hoteling costs related to our offshore business process outsourcers.
Yes, home warranty sales did slow down in the real estate channel, but Frontdoor compensated by pushing more sales in the direct-to-consumer channel. Claims rose because many people stayed home during the lockdowns, and call center costs rose because of not only more claims, but also less-available staff in low-wage countries. Again, nobody saw that coming.
There is one more COVID-19-related development that turned out to have some fortunate timing for Frontdoor. Late in 2019, the company acquired an augmented reality technology called Streem, which allowed consumers to take a technician on a virtual tour of their home appliances using a smartphone's camera.
Using this innovative solution, we are enabling contractors to engage remotely with customers to reduce the number of required in-person visits and speed the repair process. For real estate professionals, an agent can connect remotely with a home seller, lead a virtual tour and guide the owner to areas that need closer inspection, all while allowing the creation of high-definition digital assets that future buyers can view remotely without ever entering the home.
Revenue Segmentation Trends
In its quarterly financial statements, Frontdoor segments its revenue into four categories: direct-to-consumer sales, initial sales of home warranties through the real estate channel, renewals, and other revenue. But again, because it was part of ServiceMaster in 2016, it did not provide this level of segmentation for that year. So in Figure 4, we're tracking these metrics for just the 17 quarters since the start of 2017. And we're estimating the relative shares for the first two quarters of 2017.
Figure 4
Frontdoor Inc.
Quarterly Revenue Segments
(in US$ dollars, 2017-2021)
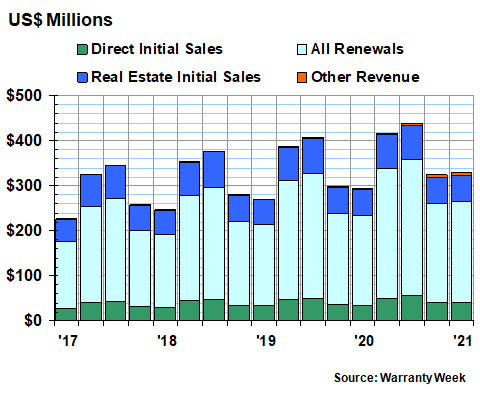
It's rather hard to see in this chart, but initial sales of home warranties in the real estate channel did actually decline by -1.3% in both the second and third quarters of 2020. And they've been flat at $57 million per quarter in the fourth quarters of 2018, 2019, and 2020. So it's quite accurate to say that the popularity of home warranties attached to existing home sales is declining.
Renewals Dominate Revenue
In contrast, the direct-to-consumer channel has continued growing without interruption, and the growth of policy renewals is actually accelerating in recent quarters. In fact, as Figure 5 details, the renewal of these annual home warranty policies dominates, whether they were initially sold through the real estate channel or direct to consumers. For the past several years, renewals have accounted for roughly two-thirds of revenue, while initial sales of home warranty policies to new customers have accounted for a third or less.
Figure 5
Frontdoor Inc.
Quarterly Revenue Segments
(share of 100%, 2017-2021)
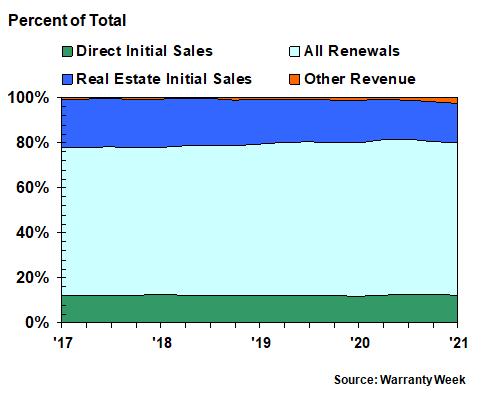
As was mentioned, Frontdoor is rather helpful when it comes to segmenting its home warranty revenue based on the way the policies were sold. Historically, most were sold with the assistance of a professional involved in the resale of an existing home (the real estate channel), but lately the best source of growth has been sales to owners of existing homes that are not currently for sale (the direct-to-consumer channel). Here's how Frontdoor explains it:
For the year ended December 31, 2020, our total operating revenue included 69 percent of revenue derived from existing customer renewals, while 18 percent and 12 percent were derived from new home service plan sales made in conjunction with existing home resale transactions and direct-to-consumer sales, respectively, and one percent was derived from other revenue streams.
For the year ended December 31, 2019, our total operating revenue included 68 percent of revenue derived from existing customer renewals, while 19 percent and 12 percent were derived from new home service plan sales made in conjunction with existing home resale transactions and direct-to-consumer sales, respectively, and one percent was derived from other revenue streams.
And then from a previous annual report:
For the year ended December 31, 2018, our total operating revenue included 66 percent of revenue derived from existing customer renewals, while 21 percent and 12 percent were derived from new unit sales made in conjunction with existing home resale transactions and direct-to-consumer sales, respectively, and one percent was derived from other revenue streams.
In its annual reports, Frontdoor also provides additional metrics which enable us to separate these renewals based on the channel in which they were first sold -- direct or real estate. And so, in Figures 6 and 7, we have segmented Frontdoor's annual revenue into five categories: direct initial sales, direct renewals, real estate initial sales, real estate renewals, and other revenue.
Through this lens, it's fairly obvious that the primary source of Frontdoor's growth is the annual renewal of direct-to-consumer home warranty contract sales, depicted in bright green in the figure below. Initial sales, through both the direct and real estate channels, seem to be growing more slowly.
Figure 6
Frontdoor Inc.
Annual Revenue Segments
(in US$ dollars, 2016-2020)
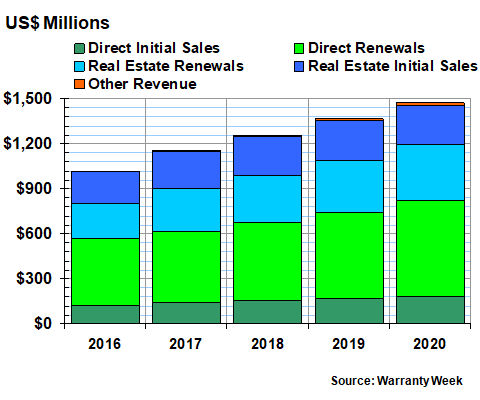
Without the help of quarterly measurements, the dip in initial sales through the real estate channel observed during the second and third quarters of 2020 disappears from view, replaced by essentially zero percent annual growth in that channel (in dark blue) from 2018 to 2019 and into 2020 (262 million, $263 million, and $263 million, respectively).
Direct-to-consumer initial sales also grew slowly in 2018 and 2019, but the pace picked up to 9.6% growth in this channel from 2019 to 2020 ($167 million to $183 million). And renewals in the real estate channel have actually been slowing, from 24% growth in 2016-17 to 11% growth in 2017-18, 10% growth in 2018-19, and 7.5% growth in 2019-20.
Largest and Fastest Growing Segment
That leaves direct-to-consumer renewals as not only the largest segment, but also the fastest-growing in 2019-20, when it expanded from $579 million to $639 million. In the process, direct renewals expanded their share of total revenue from 42% in 2019 to 43% in 2020 (see Figure 7, below).
Figure 7
Frontdoor Inc.
Annual Revenue Segments
(share of 100%, 2016-2020)
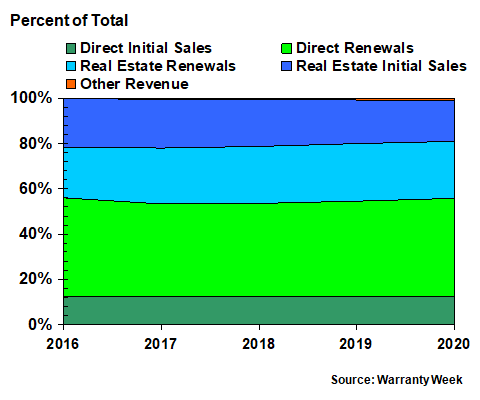
At the same time, real estate renewals (in light blue) have accounted for a near-constant 25% of total annual revenue, while direct initial sales (in dark green) have accounted for a near-constant 12% share of total annual revenue. Initial sales of home warranties through the real estate channel have accounted for a declining share of revenue: 22% in 2017, 21% in 2018, 19% in 2019, and 18% in 2020.
Attachment to Home Sales Weakens
Think about this for a moment: in the real estate channel, where the home warranty industry began, the sale of policies attached to existing home sales accounts for a declining portion of its market leader's total revenue. In fact, sales have been flat for three years, even as existing-home sales set a 14-year high in 2020.
On the other hand, even by Frontdoor's own tabulation, only four million out of an estimated 121 million existing homes now have home warranty. Using the language of the retail extended warranty industry, that's an attachment rate of only 3.3% of the installed base. Or to flip it into the language of the glass-half-full optimist, there are currently 117 million prospects out there waiting for a chance to buy a home warranty.