Apple's Product Warranties & AppleCare:
The world's largest extended warranty program got even larger last year, reaching an estimated $8.5 billion in revenue. At the same time, Apple's product warranty expenses continue to shrink, with claims falling to a nine-year low even as product revenue soars in the fiscal year that just ended.
Every cloud has a silver lining, the saying goes. And as awful as the pandemic and the lockdowns have been for the past two years in terms of both health and wealth, sales of both smartphones and protection plans have apparently accelerated over that period. People trapped in their homes, worried about their health, and fearful for their very lives, are apparently more likely to appreciate the peace of mind that protection plans offer, not to mention the relief from boredom a new smartphone can bring them.
Apple Inc. follows a fiscal year that ends in September of each year, which is then followed by an annual report that typically is issued at the end of October. So that's why this edition of Warranty Week -- the first newsletter of November 2021, as well as the first of the month in past years -- is always about Apple's hot-off-the-presses product warranty and service contract metrics. And this year they tell a story about how a company can successfully turn the expenses of warranties into a profitable aftermarket service.
Plainly stated, Apple's product warranty expenses continue to decline, while AppleCare protection plan sales have resumed their growth. By the end of this most recent fiscal year, AppleCare was bringing in three times as much money as product warranties were taking away. So it's not at all misleading to say that Apple has managed to find a way for its customers to pay for their own protection.
To arrive at our product warranty calculations, we gathered four essential metrics from each of Apple's annual reports and quarterly financial statements: the amount of claims paid, the amount of accruals made, the amount of warranty reserves held, and the amount of product sales. Using the product sales figures as our denominator and the claims and accrual figures as our numerator, we also make two calculations: claims as a percent of sales (the claims rate) and accruals as a percent of sales (the accrual rate).
To arrive at our estimates for AppleCare service contract sales, we look at the amount of deferred revenue listed in each annual report, and we make some guesses as to how much of that total is the result of gift card sales, and how much is the result of service contract sales. Apple does not provide any data publicly regarding its AppleCare sales -- never did, never will. But that hasn't stopped us from making some educated guesses.
Warranty Claims
First, let's look at the product warranty metrics. In Figure 1, we are looking at 23 quarters of claims data, staring with the quarter that began on December 26, 2015 and concluding with the quarter that ended on September 25, 2021. In the most recent quarter, Apple paid $666 million in claims, down around -14% from the same quarter a year ago. For the most recent fiscal year, Apple paid $2.67 billion in claims, down around -10% from fiscal 2020.
Figure 1
Apple's Product Warranties
Claims Paid per Quarter, 2016 to 2021
(in Millions of U.S. Dollars)
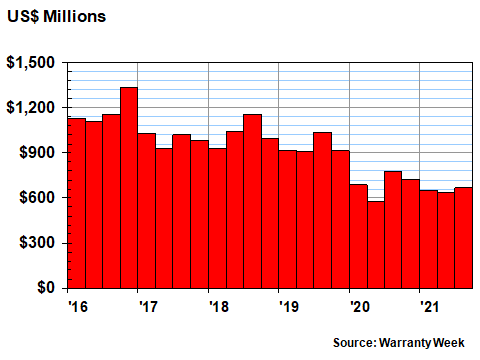
Notice the gradual downward slope in the quarterly claims data. Back in the fourth calendar quarter of 2016, which corresponds to the fiscal period from September 24 to December 31, 2016, Apple reported paying $1.34 billion in claims -- more than twice as much as it spent this most recent quarter. So it would be accurate for someone to say that Apple cut its claims cost in half in under five years.
Warranty Accruals
Figure 2 shows a more irregular pattern, with most quarters coming in around $500 million in accruals, but one or two per year coming in at double or even triple that total. Usually, it's the fourth quarter that gets the outsized accruals, and that of course corresponds to the holiday season when iPhone sales soar. But note than in both calendar 2018 and 2019, it was the third quarter that saw the highest totals.
Figure 2
Apple's Product Warranties
Accruals Made per Quarter, 2016 to 2021
(in Millions of U.S. Dollars)
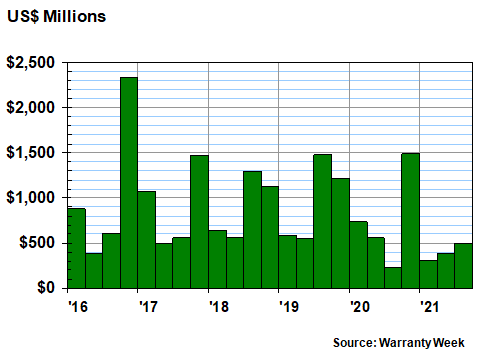
For fiscal 2021, the accrual totals for the four quarters are $1.49 billion, $309 million, $384 million, and $498 million. And the annual total is therefore $2.68 billion. That's actually down by two percent from a $2.74 billion total in the previous fiscal year, when the quarterly totals were $1.28 billion, $739 million, $557 million, and $226 million.
We'll spare you the quarter-to-quarter comparables for accruals because they really make no sense. One year the steps in the staircase goes down, then the next year the staircase goes up. It's never proportional to sales, and it soars and plummets on a schedule only Apple understands.
Warranty Reserves
Like claims, the warranty reserve fund balance at the end of each quarter also trends downward over time. Back on March 26, 2016, the balance was just a hair under $5 billion. At the end of calendar 2020 it was at $4.12 billion. And then at the end of this fiscal year, it was down to $3.36 billion -- a drop of more than $1.6 billion over the 23 quarters.
Figure 3
Apple's Product Warranties
Reserves Held per Quarter, 2016 to 2021
(in Millions of U.S. Dollars)
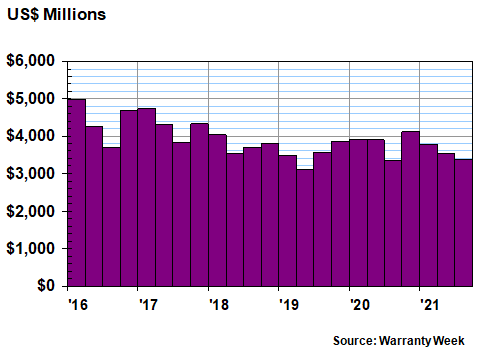
The balance at the end of fiscal 2020 was actually $3.35 billion, so reserves have actually grown by 0.03% over the past 12 months. But the balance was $3.57 billion at the end of fiscal 2019 and $3.69 billion at the end of fiscal 2018, so the longer-term trend is clearly downwards.
AppleCare Sales Estimates
All of the above calculations are exact and are made with figures readily retrievable from Apple's own financial statements. All of the data below are the result of estimates, guesses, and conjecture, so please let the buyer beware.
In Figure 4, we are taking the amount of deferred revenue reported by Apple and dividing it into gift card sales and service contract sales. There are some other contributors to the deferred revenue totals, but for this exercise we're going to dismiss them as immaterial.
The blue represents AppleCare sales while the purple represents gift cards. And from just a cursory glance, it's clear that while we estimate that AppleCare sales fell slightly in fiscal 2017, 2018, and 2019, they absolutely soared in fiscal 2020 and 2021.
Figure 4
Apple's Deferred Revenue:
Service Contracts vs. Gift Cards Sales
Estimates for Fiscal Years 2016 to 2021
(in Millions of U.S. Dollars)
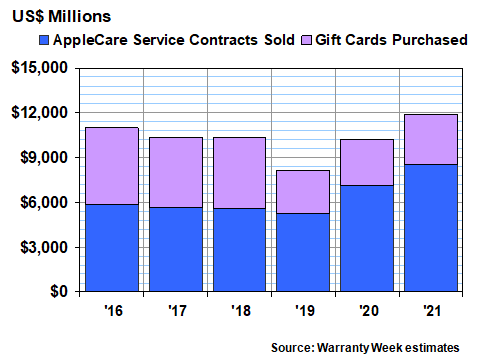
We estimate that AppleCare sales rose 20% to $8.5 billion in fiscal 2021. Sales of protection plans rose even faster in fiscal 2020 (by 37%), from what seems to be a near-term bottom of $5.23 billion in fiscal 2019. But keep in mind that these are just estimates, with no basis in hard numbers, as is the case with the product warranty data. It's conceivable that gift cards are what's really soaring in popularity -- not sales of protection plans -- but that's a story a newsletter called Gift Card Week will have to write.
The pandemic began more or less halfway through Apple's fiscal year 2020. And we would attribute the surge in sales of both devices such as iPads and the protection plans for those devices to the needs and worries of consumers who found themselves in lockdowns as a result.
It's a horrible conclusion and we hate to say it after all the death and despair the virus caused. But after looking at the quarterly revenue trends at American Home Shield, Lowe's Companies, and Assurant, and now Apple, (representing the leading indicators for the home warranty, appliance service contract, vehicle service contract, and now the consumer electronics industry), we can safely say that while the start of the lockdowns might have put a short-term crimp on sales, protection plans recovered quickly and then soared in the summer and fall of 2020.
Compared to Product Revenue
In Figure 5, we're taking the totals from Figures 1, 2 and 4 and comparing them to product revenue totals. There are six annual measurements for AppleCare as a percent of revenue, and 23 pair of quarterly measurements for the claims and accrual rates.
Since products such as iPhones and Macs are the object of the warranties and protection plans, and since services such as Apple Music aren't subject to warranties, the product revenue total is the right number to use to answer the question of how warranty expenses and AppleCare sales compare to the rest of the company.
In fiscal 2020, AppleCare sales exceeded three percent of revenue. In fiscal 2021, AppleCare sales fell just below three percent of revenue. Over the long term, the average rate is 3.6%, and it's 3.3% in the iPhone era (since 2007). So although the percentage rate is up from the doldrums of fiscal 2018 and 2019, it's still a bit below average.
Figure 5
Apple's Protection Plans:
Claims Paid, Accruals Made & AppleCare Sales
as a Percentage of Product Revenue, 2016 to 2021
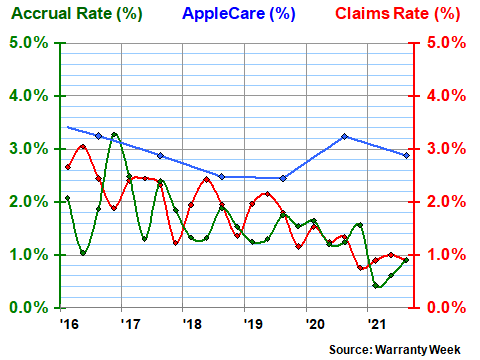
Product warranty expense rates, meanwhile, continue to decline. Back in fiscal 2016 the claims rate briefly exceeded three percent while the accrual rate climbed to 3.3%. At the end of fiscal 2021, both expense rates were down to 0.9%. But the accrual rate briefly went even lower -- to only 0.4% in the winter.
Apple's product revenue was up an incredible 35% in fiscal 2021, after rising only 3.2% in fiscal 2020. Claims in dollars were down -10% and accruals were down -2.0%, but AppleCare sales, we estimate, were up 20% in the most recent fiscal year. And it's the interplay of all these increases and decreases that produces the changes in percentages seen in Figure 5.
Product Warranty vs. Extended Warranty
The recent trend, as we explained above, is for product warranty expenses to decline while extended warranty sales rise. From an accounting point of view, they're apples and oranges, if you'll pardon the pun, so it is completely improper to compare them. But we'll do it anyhow.
In Figure 6, what we've done is to take the annual amount of accruals made during each of the last six fiscal years, and add that to the amount of AppleCare sales that we estimated. Whatever that added up to we called 100%. And then we charted the shares for each, in terms of percentages of the whole.
In fiscal 2016, the cash flow ratio was 38% product warranty to 62% extended warranty. The next year, the product warranty share rose to 44%. But then, as product warranty expenses continued to fall and extended warranty sales began to rise, the ratio shifted to new extremes. In fiscal 2020, extended warranty's share was up to 72%, and last year it rose again to 76%.
Figure 6
Apple's Warranty Cash Flows:
Accruals Made vs. AppleCare Sales
as a Percentage of the Total, 2016 to 2021

Apple has always had a minimal product warranty, which ironically is one of the reasons why some of the biggest opponents of extended warranties sometimes cited AppleCare as a good buy -- to make up for the short duration of the free protection plans. As a matter of fact, in Europe, China, and Australia, the company has been forced to lengthen the durations of its product warranties, either by custom or by law, to more closely match what the regulators expect.
However, the data shows that Apple has very successfully migrated its protection plans from free to paid, to the point that as we show in Figure 6, the sales of extended warranties now exceed the cost of product warranties by a ratio of more than three-to-one.
By the way, did we mention that at our estimate of $8.5 billion in annual revenue, AppleCare is easily the world's largest extended warranty program -- bigger than any car company's or any retailer's? Even in 2019, when we estimate it was just a tiny little $5.2 billion program, it was still the world's largest.
And it's not even available in every country of the world. And outside of sales completed at Apple Stores, it competes with the smartphone protection programs sold by both other retailers and by the very companies that operate the mobile networks. Samsung may sell more phones, but nobody sells more phone protection than Apple.