Nineteenth Annual Product Warranty Report:
While the erratic nature of accruals continued in 2021, claims totals remained stable. But warranty reserves hit a new record high late in the year, and expense rates briefly set a new low record early in the year. Manufacturer's warranty expenses are sorted into 18 industries and three major sectors: vehicles, electronics, and building trades.
Every year since 2003, we take a look at the annual reports and quarterly financial statements of all U.S.-based manufacturers, to see if they included the required disclosures about their product warranty liabilities. From those statements, we extract four essential metrics: the amount of warranty claims paid, the amount of warranty accruals made, the amount of warranty reserves held, and the total for product sales. Using the sales, claims, and accrual data, we also calculate claims paid as a percentage of sales (the claims rate), and accruals as a percentage of sales (the accrual rate).
Next, we sort all the companies, based on their dominant product line, into one (and only one) of 18 different industry categories. In the vehicle sector we track cars & cycles; trucks & buses; auto parts; and aerospace. In the high-tech sector we track computers; telecom equipment; semiconductors && printed circuit boards; consumer electronics; medical equipment & scientific instruments; data storage systems; and peripherals. And in the buildings sector we track appliances & HVAC systems; new home builders; building materials; power generating equipment; material handling systems; security systems; and sports equipment.
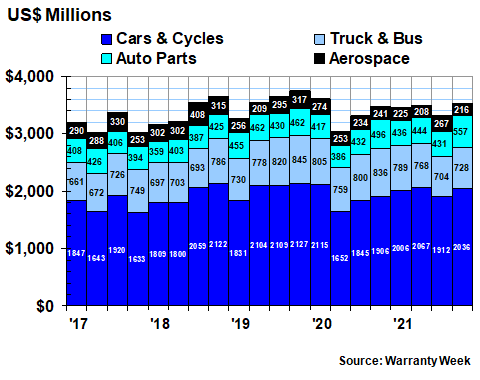
Vehicle Warranty Accruals
In Figure 1 we're starting off with what's perhaps the most dramatic chart of the lot: the warranty accrual totals for the vehicle sector during the last 20 quarters. As is clear, there was both a deep notch in the second quarter of 2020 and a tall spike in the fourth quarter of 2020. But amazingly, the second, third and fourth quarters of 2021 came in almost as high as that.
The $5.16 billion total counted in the fourth quarter of 2020 remains the highest quarterly total for this sector's accruals over the entirety of the past 19 years. The $4.56 billion total in last year's second quarter is the second-highest of the past 76 quarterly measurements. And the $4.30 billion total in the third quarter of 2021 is the new third-placeholder.
As we detailed in last week's newsletter, these troubles can be clearly traced to the problems of Ford Motor Company and General Motors Co. But they're not the only ones having trouble adjusting to the post-pandemic world and the supply chain issues that followed. In future newsletters, we will detail some of the other large warranty providers who saw their warranty expenses surge in 2021.
Figure 1
Worldwide Warranty Accruals Made
by U.S.-based Vehicle Makers
(accruals made per quarter in US$ millions, 2017-2021)
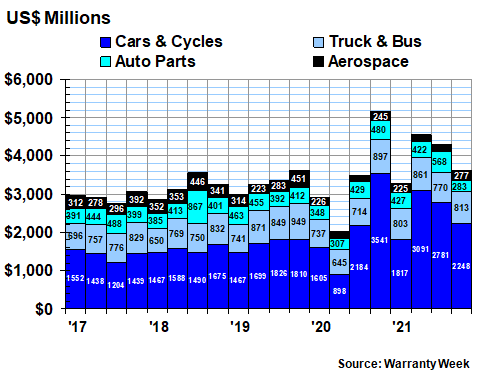
For the year as a whole, the vehicle sector saw accruals rise somewhat faster than manufacturers as a whole. While all U.S. manufacturers raised their accruals last year by 6.8% to $25.78 billion, cars & cycles raised their accruals by 21%; auto parts and truck & bus by 9%, and aerospace by 8%.
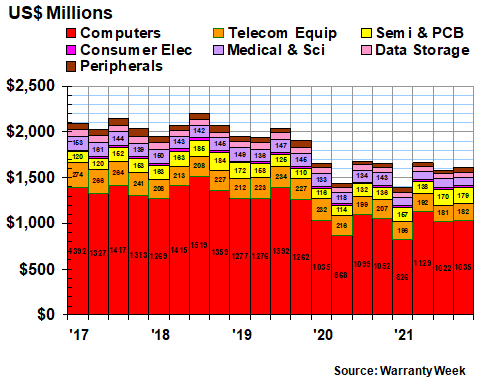
Electronics Accruals
In Figure 2, we're looking at the high-tech electronics sector, and the seven industry categories that fit within it. The largest by far is the computer industry, which is the home of Apple Inc. and its iPhone, as well as HP and IBM and all their gear. Apple, in fact, is the reason for the high-rises within the skyline below, as we detailed in the November 4 newsletter last year. The company has a habit of suddenly making unusually large accruals every so often, driving up the red bars and the overall totals as a result.
There were no unusually large accruals made in 2021 -- in fact, quite the opposite happened. Accruals in the computer industry (read: Apple) were unusually small in the first calendar quarter of 2021 as well as in the third quarter of 2020. One might surmise that the size of warranty accruals, despite explanations to the contrary, are made based on methodologies that aren't always related to either sales patterns or claims totals.
Figure 2
Worldwide Warranty Accruals Made
by U.S.-based Electronics Manufacturers
(accruals made per quarter in US$ millions, 2017-2021)
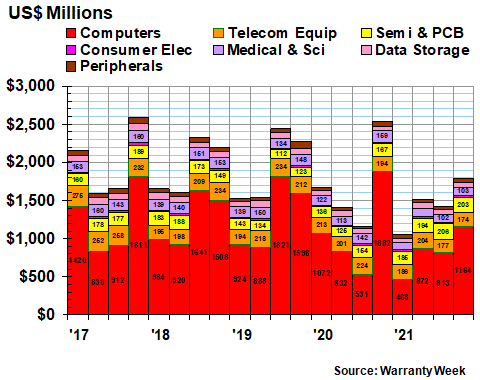
Overall, only six industry categories saw their accrual totals shrink in 2021, and four of those six were in the high-tech sector. some of that decline was due to mergers and acquisitions by non-U.S. companies; some was caused by companies unilaterally deciding to stop revealing their warranty expenses to investors; and some was part of a long-term secular decline in this sector of the U.S. manufacturing landscape.
For all of 2021, accruals in the high-tech sector were down by 15% to $5.78 billion. The steepest drops were in medical & scientific (-25%); computers (-23%) and telecom equipment (-11%). Data storage was also down a bit, and peripherals were actually up a bit. Only semiconductors (+36%) and consumer electronics (+11%) saw any significant increases in accruals.
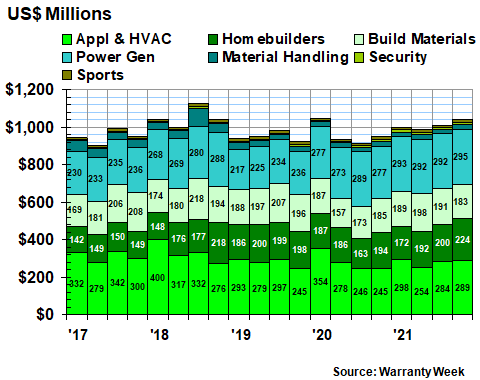
Accruals in the Building Trades
In Figure 3, we're looking at warranty accruals in the building trades. Not surprisingly, it looks to be the most predictable and least disorderly of the three sectors. There was a spike in appliance accruals back in the third quarter of 2019, but ever since the total has been growing slowly.
Manufacturers set aside $1.09 billion in accruals during the last quarter of 2021, which was a tiny bit smaller than they did in the third quarter of 2019. But both those quarterly totals were surpassed numerous times back in the pre-recession days of 2006 and 2007. The sad fact is that despite the constantly growing accrual total in the new home industry, it was far larger before the Lehman Brothers collapse.
Figure 3
Worldwide Warranty Accruals Made
by U.S.-based Building Trade Companies
(accruals made per quarter in US$ millions, 2017-2021)
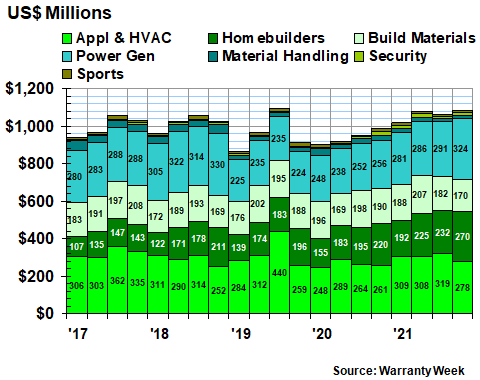
For all of 2021, accruals in the building trades were up 13% to $4.25 billion. This is sharply higher than the +6.8% growth for all manufacturers, but not as fast as the vehicle sector. But of the seven industry categories grouped under the building trades, only material handling and building materials saw any shrinkage in warranty accruals last year. Homebuilders were up 22%; power generating equipment makers were up 19%; and appliances and HVAC were up 14%.
Warranty Expense Rates
The dollar amounts in and of themselves tell only part of the story. Warranty accruals are supposed to remain proportional to product sales, unless there's been a noticeable change in reliability or repair cost. And that ratio between sales and expenses can go up or down, resulting in changes in the accrual rate.
In 2021, warranty accruals were up 6.8%, but product sales were up 18%. In other words, revenue rose faster than expenses, despite the spikes in accruals we saw in certain industries. For those keeping score at home, warranty claims were up by just 1.4%, so it is true to say that sales revenue grew faster than both expense metrics last year.
Unfortunately, we measure sale and expenses four times a year, and as can be seem in Figure 4 below, something wacky happened in the first quarter of 2021. Sales were relatively normal, but warranty expenses plunged, driving the claims rate down to 1.1% and the accrual rate down to 1.0%. Both are record lows.
And then, just as suddenly, warranty expenses rebounded, driving the claims rate back up to 1.25% and the accrual rate back up to 1.4% by the end of last year. It almost seems like the data in Figure 4 can be divided into two halves: steady improvements from 2003 to 2011 (except for the recessionary spike in the claims rate), followed by noisy oscillations from 2012 to 2021.
Figure 4
All U.S.-based Companies
Average Warranty Claims & Accrual Rates
(as a % of product sales, 2003-2021)
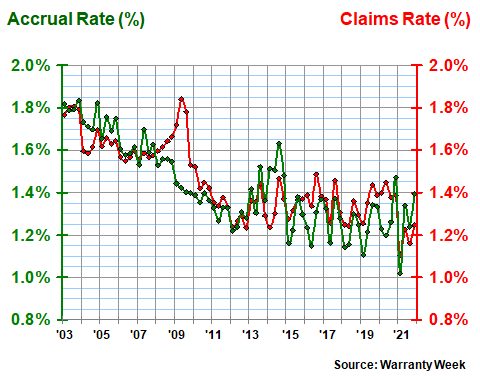
In fact, we don't know who to blame for this, but notice how the accrual rate (in green) suddenly dove from 1.5% in the fourth quarter of 2020 to 1.0% in the first quarter of 2021. Half-point drops like that are not supposed to happen. Yet there it is.
Even stranger, these calculations are based on real math, not some wacky extrapolations or wild guesses. All the expected warranty data for the first three quarters of 2021 is already in, with only a handful of smaller companies yet to report their fourth quarter numbers to investors. So the best guess we can come up with as to cause is that manufacturers boosted their accruals artificially late in the year and cut them artificially early in the next. Something similar happened in 2014-15. Maybe it's a common improvisation that nobody ever noticed before?
Over the long term, over 76 quarters, the average claims rate for U.S.-based manufacturers stands at 1.45%, with a standard deviation of 0.17%. The average accrual rate is 1.43%, with a standard deviation of 0.20%. So another way of looking at the data in Figure 4 is left half above average, right half below average.
Warranty Claims Totals
Comparatively speaking, the warranty claims totals in Figures 5 to 7 are fairly well-behaved. Yes, there are notches in the data for the lockdown quarter of April to June 2020, but if anything it seems to have merely time-shifted the warranty work to later periods.
Overall, warranty claims grew slightly to $24.07 billion last year. But the $23.73 billion total was the smallest of the past 19 years, and 2021 was second-smallest. So it looks as if the downturn in claims is persisting. And Dr. Anthony Fauci is to blame, we suspect.
Figure 5
Worldwide Warranty Claims Paid
by U.S.-based Vehicle Makers
(claims paid per quarter in US$ millions, 2017-2021)
In the vehicles sector overall, claims were up a meager 2.5% to $13.79 billion. Claims in the cars & cycles and auto parts categories were up, while claims in the truck & bus and aerospace categories were down.
And then in the electronics sector, claims were down by 2.9% last year to $6.24 billion, with claims rising very fast in the semiconductor category (+29%) and falling very fast in the medical & scientific category (-32%). Computers, by far the largest of the seven industry categories in Figure 6, saw claims fall very slightly, as did the total for peripherals. Data storage and telecom equipment saw somewhat faster declines.
Figure 6
Worldwide Warranty Claims Paid
by U.S.-based Electronics Manufacturers
(claims paid per quarter in US$ millions, 2017-2021)
Note the notch in the data for the first quarter of 2021. The $1.39 billion total during that quarter was actually just a bit smaller than the $1.43 billion total in the second quarter of 2020. And both of those were the slowest quarters for electronics warranty claims since record-keeping began in 2003.
Building Trade Claims Totals
In Figure 7, we see a rather orderly claims pattern in the building trades over the last five years. The only data point that seems out of place is the $354 million total for the appliance and HVAC category in the first quarter of 2020.
After that anomaly, the sector's quarterly claims totals dropped below $1 billion for five straight quarters. However, they grew to $1.01 billion in the third quarter and to $1.04 billion in the fourth quarter of 2021. And that's more or less been the pattern for the past 19 year: a few quarters above $1 billion, followed by a few quarters below that level.
Figure 7
Worldwide Warranty Claims Paid
by U.S.-based Building Trade Companies
(claims paid per quarter in US$ millions, 2017-2021)
For the entire year, warranty claims in the building trades stood at $4.03 billion, up about 4.8% from $3.85 billion in 2020. Homebuilders and building material manufacturers both saw claims rise about 8% last year, while the appliance & HVAC category saw claims remain almost unchanged.
Warranty Reserve Balances
Finally, we have one more warranty metric to detail: the ending balance in the combined warranty reserve funds of the hundreds of manufacturers that we track. And so we don't have to slog through three more separate charts, we've drawn in data for the eight largest industry categories and combined the remaining 10 into one big "other" category.
Figure 8
Worldwide Warranty Reserves
Held by U.S.-based Companies
(reserves held in US$ millions, 2017-2021)
As can be seen here, and as we detailed in last week's newsletter, the increases in the warranty reserves of GM and Ford are driving up the car & cycle category, and in turn the overall totals. By the end of 2021, U.S.-based manufacturers reported a cumulative $50 billion in their warranty reserve funds for the first time ever.
The reserves held by car & cycle manufacturers represented about 41% of that total, followed by truck & bus at 11% and computers at 10%.
Warranty reserves grew by 5.1% by the end of last year to $50.06 billion. Once again, semiconductor category grew fastest (+31%), followed by cars (13%), new homes (+12%), and aerospace (+11%). The reserve balances of companies in the medical & scientific category fell fastest (-28%), followed by computers (-12%). All the other balances changed much more slightly.