Worldwide Auto Warranty Expenses:
Most auto manufacturers have filed their latest annual reports, so the totals are in for 2021: $45.9 B in claims paid, a 2.4% claims rate, $54.0 B in accruals made, a 2.8% accrual rate, $128.4 B in reserves held, and $653 in accruals made per vehicle sold. Claims and accrual totals changed little last year, but because sales rebounded in 2021, the expense rates fell.
After a six-month break, it's time to produce another warranty newsletter. And it's a big one. That's because of all the industries that produce products typically covered by warranty, only a few contain enough manufacturers that routinely publish their warranty expense figures to make a worldwide roundup possible. And of those few industries, coverage is close to universal in only one: the passenger car and light truck industry.
Of the top 40 automobile manufacturers in the world, roughly 25 publish their warranty expense reports in the footnotes of their annual reports. And depending on the estimates one constructs for those remaining 15 non-reporters, the worldwide share of the warranty-reporting group is well over 90% of the world's total for all of the warranty metrics that we track.
Research Methodology
For each vehicle manufacturer, we gathered five metrics from each of their annual reports: the amount of claims paid, the amount of accruals made, the amount of warranty reserves held, the unit number of vehicles sold, and the amount of vehicle sales revenue.
With the claims, accruals and sales revenue data in hand, two expense rates were calculated: claims as a percentage of revenue, and accruals as a percentage of revenue. And with the accruals and unit sales data, a dollar amount for accruals made per vehicle sold was calculated.
Data was gathered from 25 passenger car and light truck manufacturers from six markets. From the United States, we followed Ford Motor Company, General Motors, and Tesla. From Europe, we followed BMW, Mercedes, Renault, Stellantis, Volvo Cars, and Volkswagen. The PSA Group stopped reporting in 2019, and was acquired by Stellantis last year.
India brought in Mahindra and Tata Motors (which owns Jaguar Land Rover). Japan added Honda, Nissan, Subaru, and Toyota (though Subaru is late to file its 2021 annual report). All of the companies in India and Japan use fiscal years that end on March 31 -- three months later than their peers -- so their annual reports are typically published in the summer months.
South Korea brought in Hyundai and Kia as warranty reporters. And then no less than eight manufacturers in China now include warranty expense data in their annual reports: BAIC Motor, BYD Auto, Changan Automobile, Dongfeng Motor, GAC Group, Li Auto, and Nio Inc.
All the data was gathered in its native currency and then was translated into U.S. dollars. For the sake of simplicity and transparency, all the exchange rates were taken from the Yearly Average Currency Exchange Rates chart published by the Internal Revenue Service.
At least a dozen more auto manufacturers did not publish any warranty expense data, so we fashioned estimates for each of them. Some of the largest among them were Japanese manufacturers Mazda and Suzuki; and Chinese manufacturers FAW Group, Geely Automobile, Great Wall, and SAIC Motor Corp. In 2021, these estimates comprised 7% of the claims totals, 8% of the accruals and reserves totals, 19% of the unit sales, and 13% of the worldwide sales revenue.
SAIC is the only manufacturer named in any of the charts below for which we had to create estimates of their warranty expenses. None of the others are large enough to surpass Tata or Honda. The company, formerly known as Shanghai Automotive Industry Corporation, did report that it sold 5.46 million vehicles last year and made about US$117.8 billion in sales revenue, but it did not report either its warranty claims or warranty accrual totals. So we assigned them a claims rate of 1.3% and an accrual rate of 1.5%, based on their similarity to Chinese manufacturers that did report.
Warranty Claims Totals
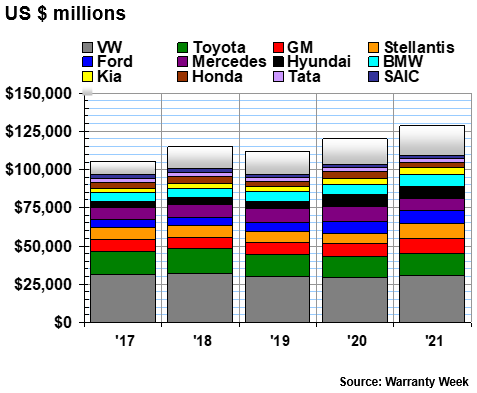
In 2021, the worldwide total for warranty claims paid barely grew, from $45.875 billion in 2020, to $45.892 billion last year. As the data in Figure 1 below illustrates, these were the lowest totals of the last five years, reflecting both slower sales and less wear and tear on the vehicles in use during the pandemic.
Just the 12 largest claims providers fit into the format of each chart, but rest assured there are 25 sets of hard numbers in there, plus a dozen more estimates included in the totals. Volkswagen remains the largest claims payer by far, continuing to pay over $10 billion a year in 2021. Mercedes (Daimler) remains in second place, paying $4.54 billion in claims last year.
Ford, Stellantis and GM are in the three-billion range. BMW, Toyota, and Hyundai are in the two-billion bracket. Kia, Honda, SAIC (we estimate), and Tata are in the one-billion domain. None of the other expense-reporting companies pay more claims than Tata, and none of those for which we fashioned expense estimates pay out more claims than SAIC.
Figure 1
Worldwide Auto Manufacturers
Claims Paid per Year
(in millions of US dollars, 2017-2021)
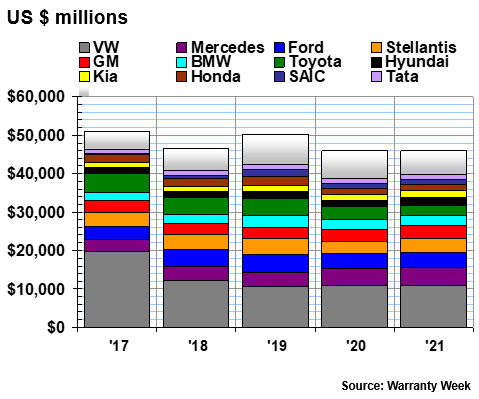
On a relative basis, Hyundai's claims total increased the fastest, growing by more than a third from 2020 to 2021. Stellantis saw the second-largest increase in claims last year -- most likely as a result of the merger with the PSA Group. GM and Mercedes saw modest increases, and Kia, Honda, Ford, VW, and BMW remained about the same. Among the companies named in Figure 1, only Tata and Toyota paid less in claims last year than they did in 2020.
Among those warranty expense reporters that did not get named (swallowed up in the "other" category), the biggest gains in claims totals came from the electric vehicle manufacturers. And yes, there are now more besides Tesla: we've added BYD, Xpeng, Li Auto, and Nio to the roster, and all five of them saw swift rises in claims payments last year (reflecting fast-growing sales, we hope).
Warranty Claims Rates
The best way to tell whether an increase in annual claims payments is good (a reflection of growing sales) or bad (more frequent and more costly claims) is to compare each annual total to sales revenue. There is of course a lag time between when a vehicle is sold and when it needs warranty work, but external observers do not have access to data concerning the age or model year of each vehicle at the time that warranty work is performed.
With companies enjoying radically fast sales growth, such as those making electric vehicles, comparing one year's claims to the same year's sales is going to produce unusually low percentage rates for claims as a fraction of sales. And indeed, there at the very bottom of the list in Figure 2 are Nio, Xpeng, and Li Auto, with BYD there in the middle at 0.7% and Tesla not far above at 1.1% last year.
Figure 2
Worldwide Auto Manufacturers
Average Warranty Claims Rates
(as a percentage of sales, 2020 & 2021)
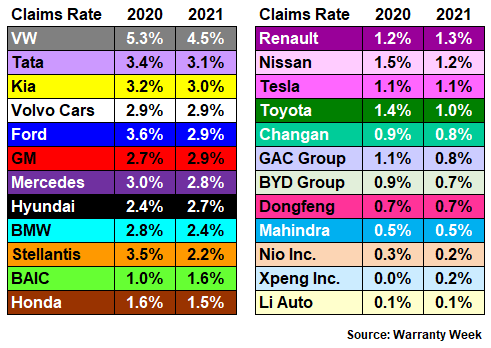
At the high end of the scale is VW at 4.5%, but that expense rate is down from well over five percent in 2020. Tata and Kia are in the three-percent range. Ford, GM, Mercedes, Hyundai, BMW, and Stellantis are in the two-percent range, and in fact the worldwide average is just over 2.5%. BAIC, Honda, Renault, Nissan, Tesla, and Toyota are well below average.
As was mentioned, these are all calculations made using data published by the manufacturers themselves. So those sub-one-percent numbers for Changan, GAC Group, Dongfeng, and Mahindra are not estimates. In fact, Tata Motors used to be in that same low range until it acquired Jaguar Land Rover, so the error is not in our math.
Warranty Accrual Totals
Auto manufacturers worldwide accrued an estimated $54.03 billion in 2021, down slightly from the $54.17 billion recorded in 2020. Hard data gathered from the annual reports represented 92% of that total, down slightly from the hard-number share in 2020. That's because the hard-number accruals fell faster than the estimated share, from $50.2 to $49.6 billion versus $4.0 billion to $4.4 billion for the estimates.
Honda and Hyundai each cut their accruals roughly in half, while Kia and BMW did so more moderately. Stellantis, again because of the merger, was up considerably, while GM, Tata, and Mercedes raised their accruals more moderately. Ford, VW, and Toyota were little-changed.
Figure 3
Worldwide Auto Manufacturers
Accruals Made per Year
(in millions of US dollars, 2017-2021)
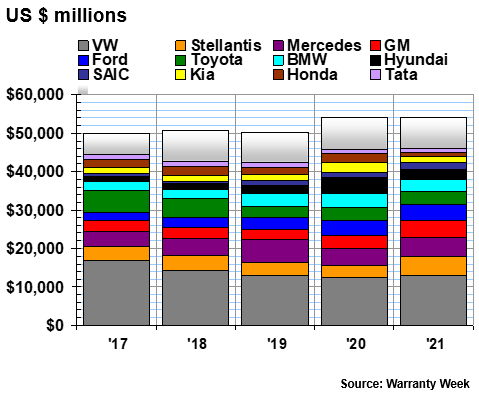
Among those not named on the chart above, Volvo Cars, Nissan, and Dongfeng held their accrual totals at roughly the same level as they did in 2020. Everyone else was up -- some by considerable amounts. For instance, Xpeng quadrupled its accruals; Li Auto tripled; Nio doubled; and Tesla was up from $625 million to $1.056 billion -- a healthy 69% increase. But sales of their electric vehicles were up proportionately, so there's less to worry about.
Warranty Accrual Rates
Under normal circumstances, warranty accruals rise and fall more or less proportionally to sales. For instance, Tesla's accruals were up 69% while unit sales were up 87% and sales revenue was up 66%. As a result, its accrual rate was little changed from 2020 to 2021. It was much the same story for the other EV manufacturers, with Nio actually cutting its accrual rate by half a percentage point.
In Figure 4, we've listed the accrual rates we calculated for the past two years for 24 auto manufacturers (Subaru has yet to publish an annual report for its most recent fiscal year, which ended six months ago, nudge, nudge). Ten were up and 14 were down. Of the latter group, five fell at a faster rate than the overall industry average: Ford, BMW, Kia, Hyundai, and Honda. All five had a bad 2020.
Figure 4
Worldwide Auto Manufacturers
Average Warranty Accrual Rates
(as a percentage of sales, 2020 & 2021)
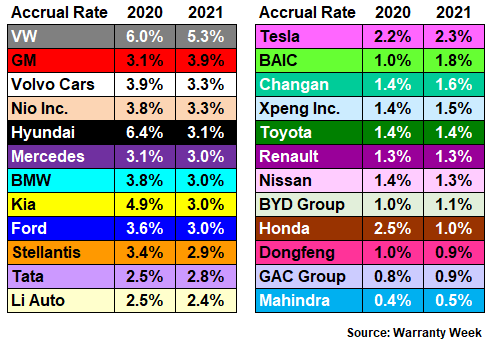
Note that the accrual rates for all five of the "pure play" EV manufacturers are radically higher than their claims rates, partly because of soaring sales and partly because EVs seem to get less warranty work. However, all the EV manufacturers also seem to over-accrue, perhaps out of fear that some massively-costly defect or recall will one day take them by surprise. Tesla's been doing it for more than a decade, for instance, and the sky has yet to fall.
Accruals per Vehicle Sold
There is a second way to calculate an accrual rate for automobile manufacturers, which is to divide total accruals by unit sales, and to figure out the average accruals made per vehicle sold. This works for accruals, because the standard operating procedure is to figure out the average future cost of a given warranty for a given make and model, and to set that amount of money aside every time a vehicle is sold.
Warranty claims, on the other hand, have a very delayed relationship with new sales, in the sense that warranty work won't be needed until months or years after sale. And it also doesn't work to divide this year's claims by past years' unit sales, because some of the most heavily-used vehicles drive themselves out of warranty long before their years are up, and others are wrecked while still under warranty.
People frequently request data for average warranty cost per car, whether they mean per car sold or per car on the road and under warranty. For the reasons stated above, the latter is unknowable. The former is knowable, but not very useful, because of the lag time between sales and warranty work. Fortunately, however, by raising and lowering their accruals to match the ebb and flow of sales, each manufacturer is essentially telling us what their best actuarial estimates are for the average future warranty costs of the suite of vehicles they sell (or else they are purposefully over- or under-accruing for this key liability).
What makes this metric somewhat controversial is the fact that it's just a simple number -- too simple, some would say -- and it makes the warranties of luxury vehicles and electric vehicles look expensive. And it makes the warranties of many Chinese brands look very inexpensive, suggesting either very high quality or very inexpensive warranty work. And by turning everything into US dollars, it makes everything far too easy to compare, and perhaps misleadingly so, given the rise and fall of the dollar and the effect that alone can have on the metric.
But we'll leave the interpretations up to others. What follows are the 2020 and 2021 numbers for 24 warranty expense-reporting automotive brands worldwide (Subaru would be #25 if their annual report wasn't late), organized into three charts, for high, medium, and low accrual rates per unit sold.
In Figure 5a, Chinese EV maker Nio Inc. has the most expensive warranties per vehicle sold worldwide for both 2020 and 2021. But that's only because it is still a relatively small company, Last year it sold only 91,000 vehicles, but it accrued more than $167 million for them. So mathematically it takes the top prize for accruals per vehicle, even if it's on a very small production volume.
The Mercedes-Benz Group AG, the new name of what was previously known as Daimler, is world-renowned for its luxury quality brand, as well as its reputation for high-end service and warranty work at the dealerships. And from Figure 5a, it becomes clear that those donuts the dealerships give away aren't really free.
Figure 5a
Worldwide Auto Manufacturers
Accruals Made per Vehicle Sold
(in US dollars, 2020-2021)
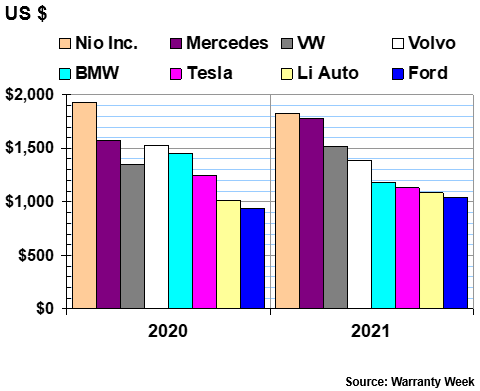
There are other luxury auto companies on this chart as well as other EV manufacturers. Tesla, Volvo, and BMW can also take comfort in their modest reductions in accruals per vehicle last year. And then there are VW and Ford, makers of the people's cars, who perhaps spend more than they should on the people's warranties.
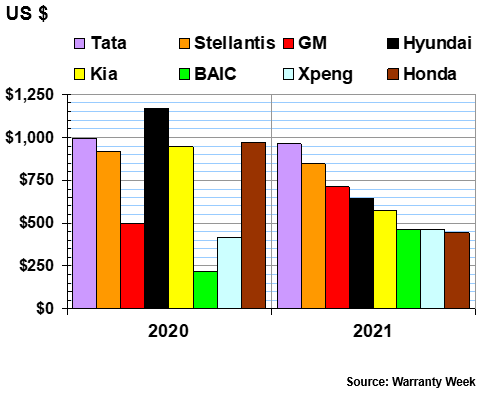
In Figure 5b there are eight more manufacturers that set aside between $445 and $964 in accruals per vehicle last year. Hyundai, we note, cut its accruals per vehicle nearly in half, with Kia not far behind. Honda cut its accruals per vehicle by more than half -- from $974 to $445.
Tata and Stellantis were down a bit; Xpeng was up a bit. The bad news here was GM's accruals up by 43% and BAIC's accruals more than doubling per unit sold.
Figure 5b
Worldwide Auto Manufacturers
Accruals Made per Vehicle Sold
(in US dollars, 2020-2021)
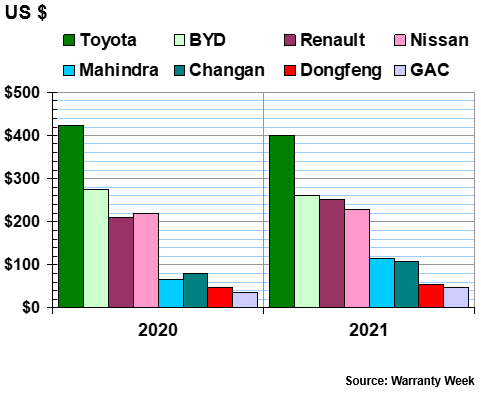
From a quick glance at Figure 5c, it appears that Toyota might be on the wrong chart. Indeed, its accrual rate per vehicle is closer to Honda's or Kia's than to Renault's or Nissan's. But we had room for only eight companies per chart, so here we are.
The good news here is that Toyota's and BYD's accrual rate per vehicle sold dropped modestly in 2021. Nissan and Dongfeng were up modestly. Renault, GAC, Changan, and Mahindra were up significantly. But then again, in 2020 they were all accruing less than $100 per vehicle sold, so perhaps an increase was prudent?
Figure 5c
Worldwide Auto Manufacturers
Accruals Made per Vehicle Sold
(in US dollars, 2020-2021)
Out of the 24 manufacturers we're tracking, accruals per vehicle were down for 11 and up for 13 last year. For the group as a whole, counting just those that reported hard numbers for both accruals and unit sales, the worldwide average for accruals per vehicle dropped from $776 in 2020 to $740 per vehicle in 2021.
But when you add in the estimates fashioned for the non-reporters, that average drops to $688 in 2020 and $653 last year. That's just a product of the simple math: 78.8 million vehicles sold worldwide in 2020; 82.7 million in 2021. And then $54.17 billion in accruals in 2020 versus $54.03 billion in accruals in 2021.
Worldwide Average Warranty Expense Rates
Speaking of worldwide averages, the average auto manufacturer sets aside just over 2.5% of their sales revenue as warranty accruals and spends just over 2.5% of it on warranty claims. A quick glance back to Figures 2 and 4 shows that most manufacturers are below those marks, but some of the largest manufacturers worldwide are above them, and their weight is what drives up the worldwide average.
In 2021, the good news is that both the average claims rate and accrual rate fell in 2021, to 2.4% and 2.8%, respectively, down from 2.8% and 3.3% in the pandemic year of 2020. Meanwhile, that bump in accruals back in 2015 was the result of a cascade of major recalls, and 2017 was the peak of payments. So in a lot of respects, 2021 was a year where many of these metrics returned to normal.
Figure 6
Worldwide Auto Manufacturers
Average Claims & Accrual Rates
(as a percentage of sales, 2012-2021)
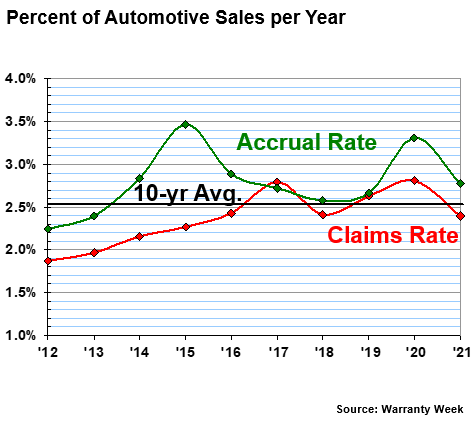
Once again, the weighting of the largest manufacturers helped drive the averages down. For instance, VW, Ford, Nissan, Toyota and Stellantis saw the biggest relative declines in their claims rates. Ford, BMW, Kia, Hyundai, and Honda saw the biggest relative reductions in their accrual rates. And these in turn outweighed the effect of the other manufacturers upon the averages.
Warranty Reserves
We have one more warranty metric to detail for you. Figure 7 is a total of the world's automotive manufacturers' warranty reserve fund balances at the end of each of the last five years. Once again, only the top 12 are named, but there are 25 automakers that reported their balances and year-end estimates are added for an additional 12 companies.
Figure 7
Worldwide Auto Manufacturers
Reserves Held at Year's End
(in millions of US dollars, 2017-2021)
The worldwide total reserve fund balance at the end of 2021 was $128.44 billion, up sharply from $120.15 billion at the end of 2020, and $112.12 billion at the end of 2019. We calculate that 92% of that total was the result of hard-number reporting by the manufacturers in their annual reports, with only 8% the result of estimates.
VW has by far the largest warranty reserve fund in the world, with a $31.13 billion balance at the end of last year. That's almost as much as Toyota, GM, and Stellantis, combined. But it's up only a modest 5% from the $29.62 billion reported at the end of 2020.
Of the big 12 named in the chart above, Stellantis grew its reserve balance the fastest last year, again due to its absorption of the PSA Group. GM and BMW also grew their balances somewhat swiftly. But for Mercedes, Honda, and Tata, the reserve balance reported at the end of 2021 was actually down.
Among the smaller manufacturers not named in Figure 7, the EV makers once again reported the swiftest growth in this warranty metric. Li Auto and Xpeng nearly tripled their reserves, while Nio doubled and Tesla was up 43%. BYD Auto boosted its reserves by a mere 30% -- slowest of its peer group.
Four other Chinese manufacturers -- Changan, Dongfeng, BAIC, and GAC -- boosted their reserves moderately, while Renault and Nissan were up slightly and Volvo and Mahindra were down slightly. Overall, out of the 24 manufacturers for which we have exact reserve balances for the past two years, 19 balances grew and 5 did not.
Extended Warranty Management Conference
These past few years, it sure has been easy to stay home and avoid business travel, what with wars, storms, pandemics, supply chain upheavals, political gridlock, and cancelled flights to be considered. But as the weather calms down and those perils begin to recede at least a bit, could it be time to think about attending an extended warranty conference again?
In less than two weeks, the 13th annual Extended Warranty & Service Contract Innovations conference returns to the Renaissance Hotel in Nashville, Tennessee. It's being put together by Strategic Solutions Network LLC, the same company that assembled the Global Warranty & Service Contract Innovations conference that debuted in San Diego this past April.
This year's agenda takes a deep-dive into new frontiers in extended warranty and service contract innovations. Coverage includes customer service, new product development, disruptive technology, marketing & sales, legal & regulatory, and finance & insurance. More than 30 speakers representing companies in multiple industries, including auto, appliance, mobile, electronics, home, and heavy equipment will appear. And as much fun as it can be to zoom all day at home in sweatpants, those of you yearning to shake a hand, clink a glass, or swap a business card might think about making the trip to the Music City. See you there, in person!